
November 10, 2021
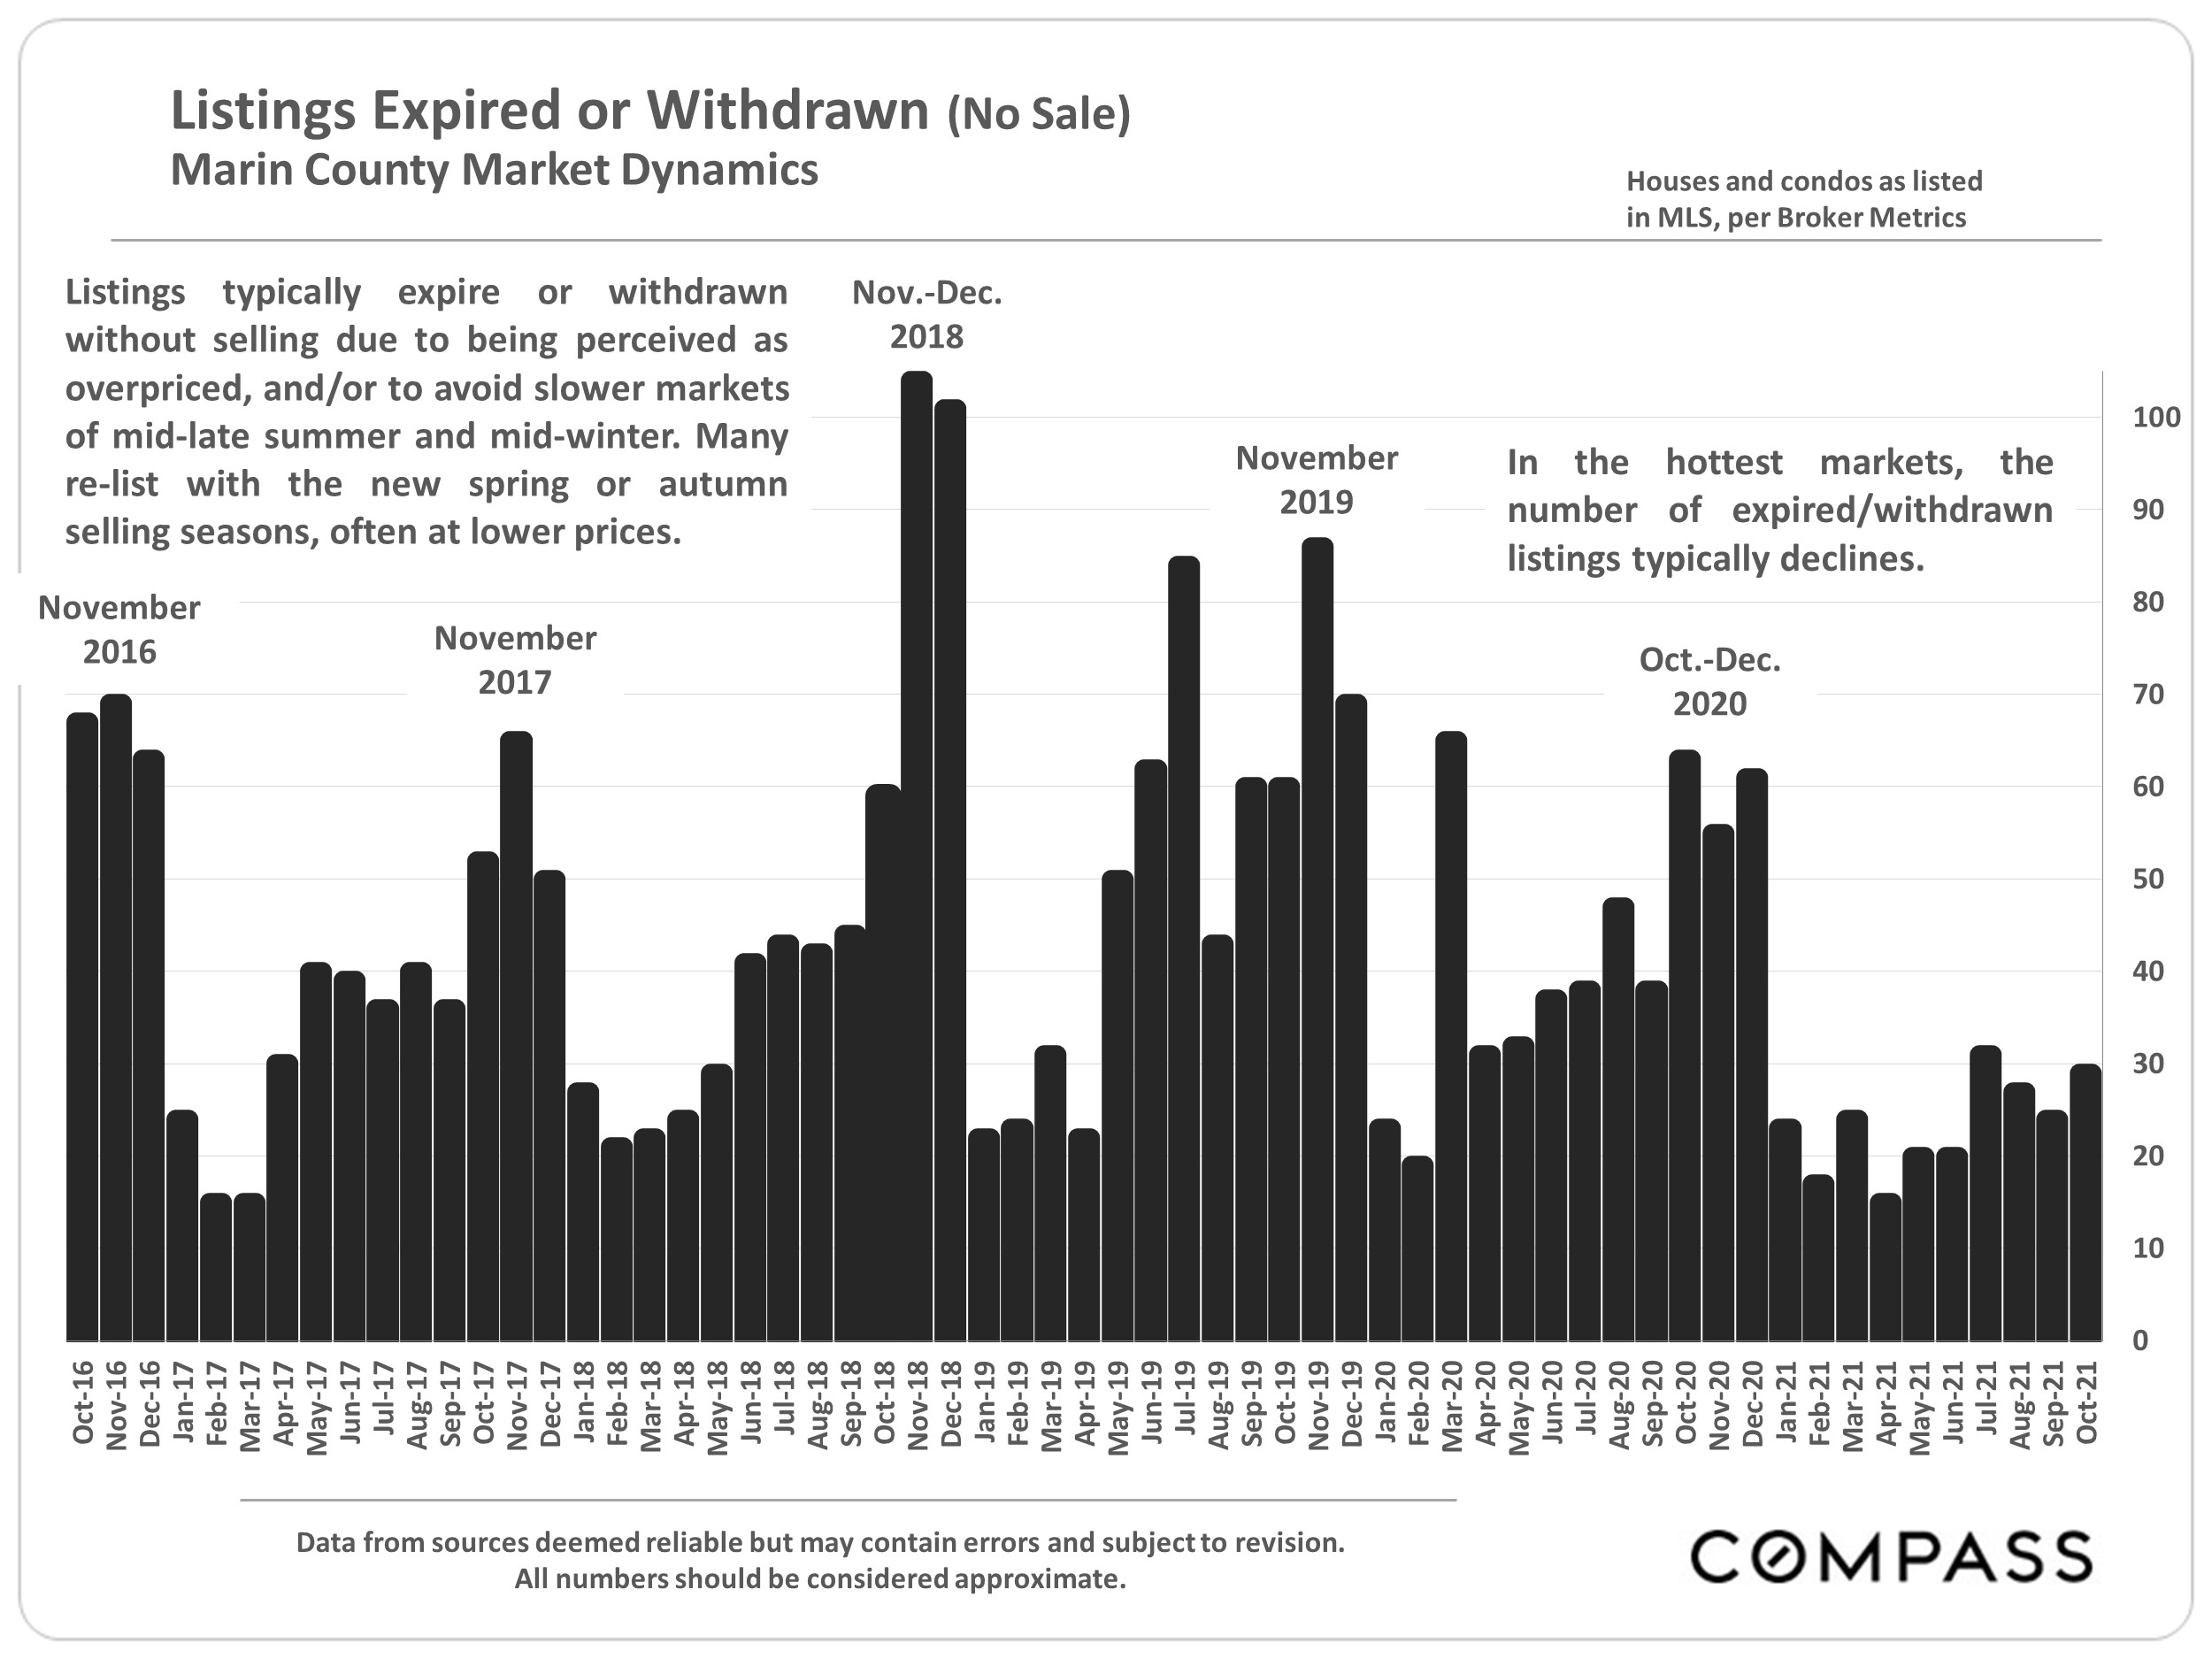
Marin: Nov 2021 Market Stats
By Compass
.JPG)
.JPG)
.JPG)
.JPG)
.JPG)
.JPG)
.JPG)
Want to learn more about Bay Area market trends?
Let’s connect! With relationships and networks across the city, there are a variety of ways I can help you make informed real estate decisions. Call, email, or text – I’m here to help.
Contact