Feature image for Marin: August 2026 Market Stats

August 20, 2026

Marin: August 2026 Market Stats

By Compass


Marin Market Recap

Key Market Highlights

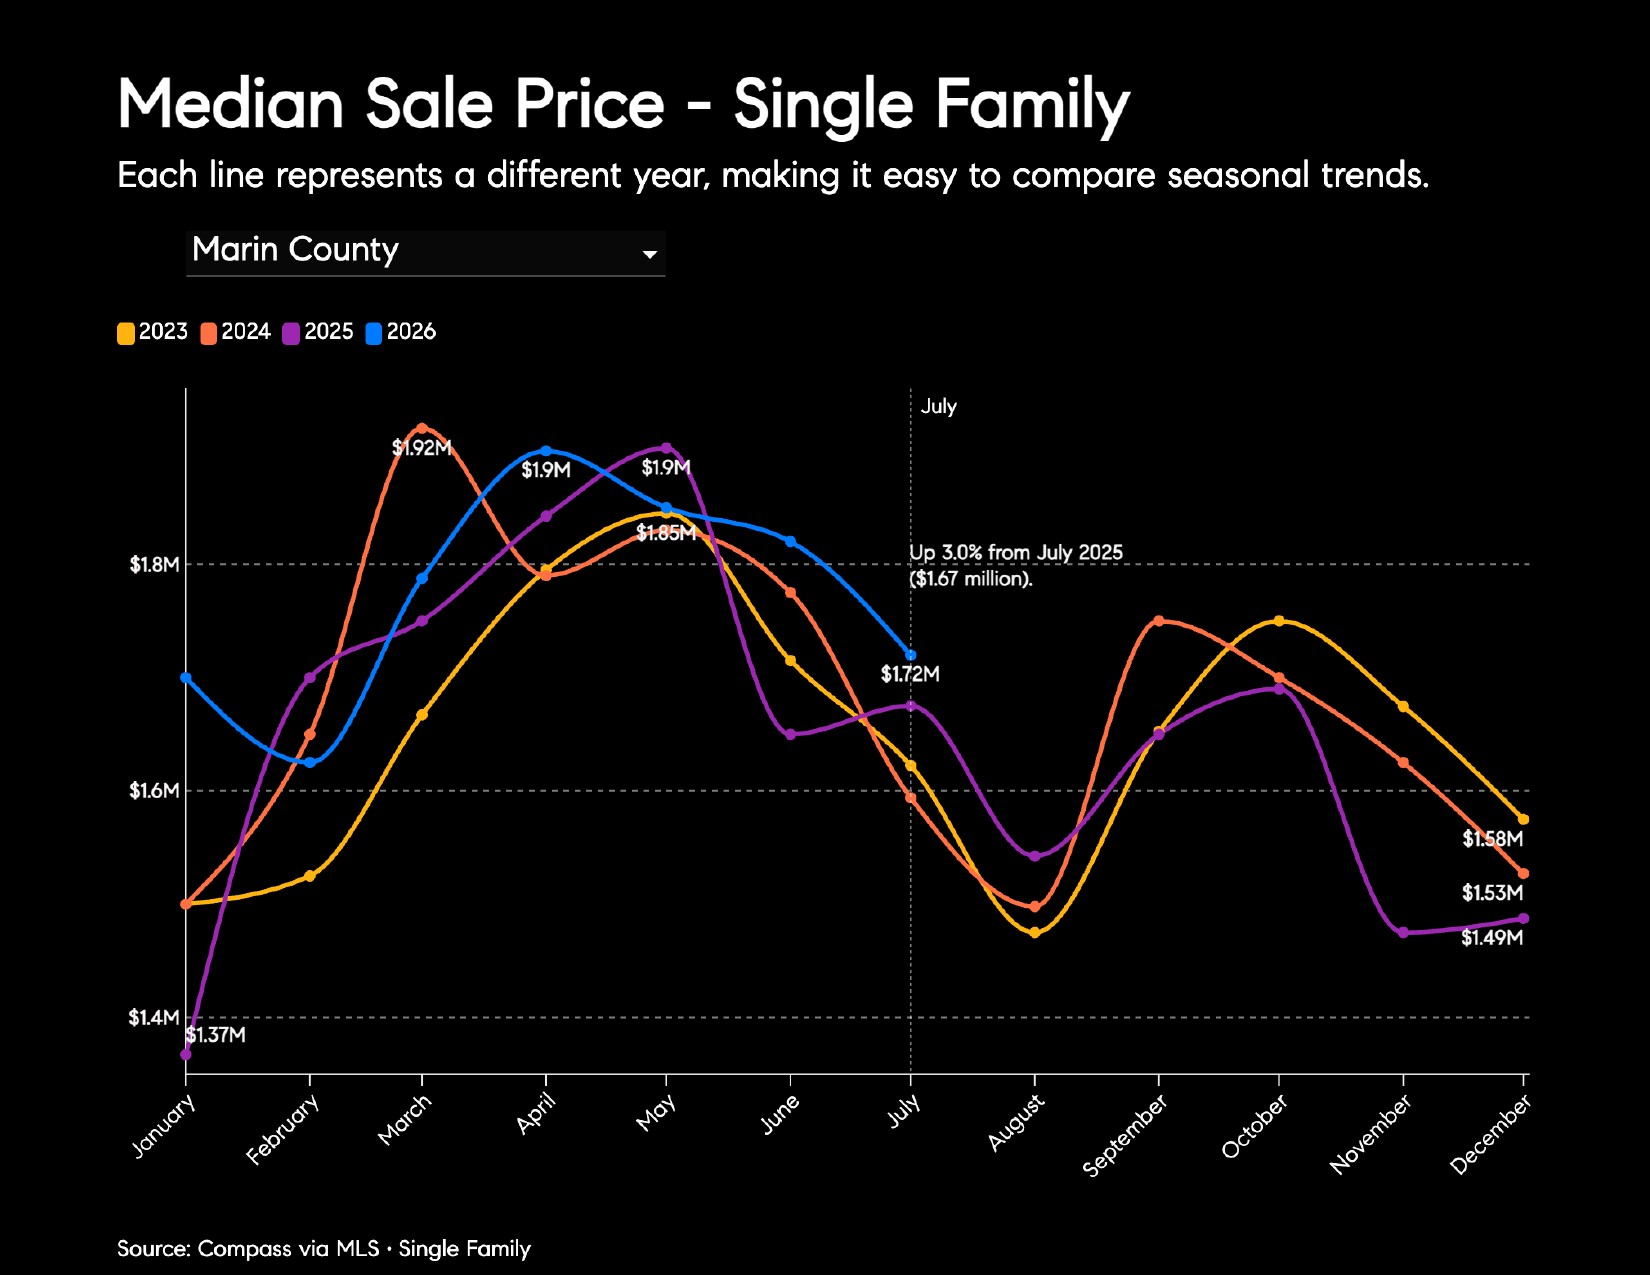
  • Median sale price: $1.72M, up 3% YoY.
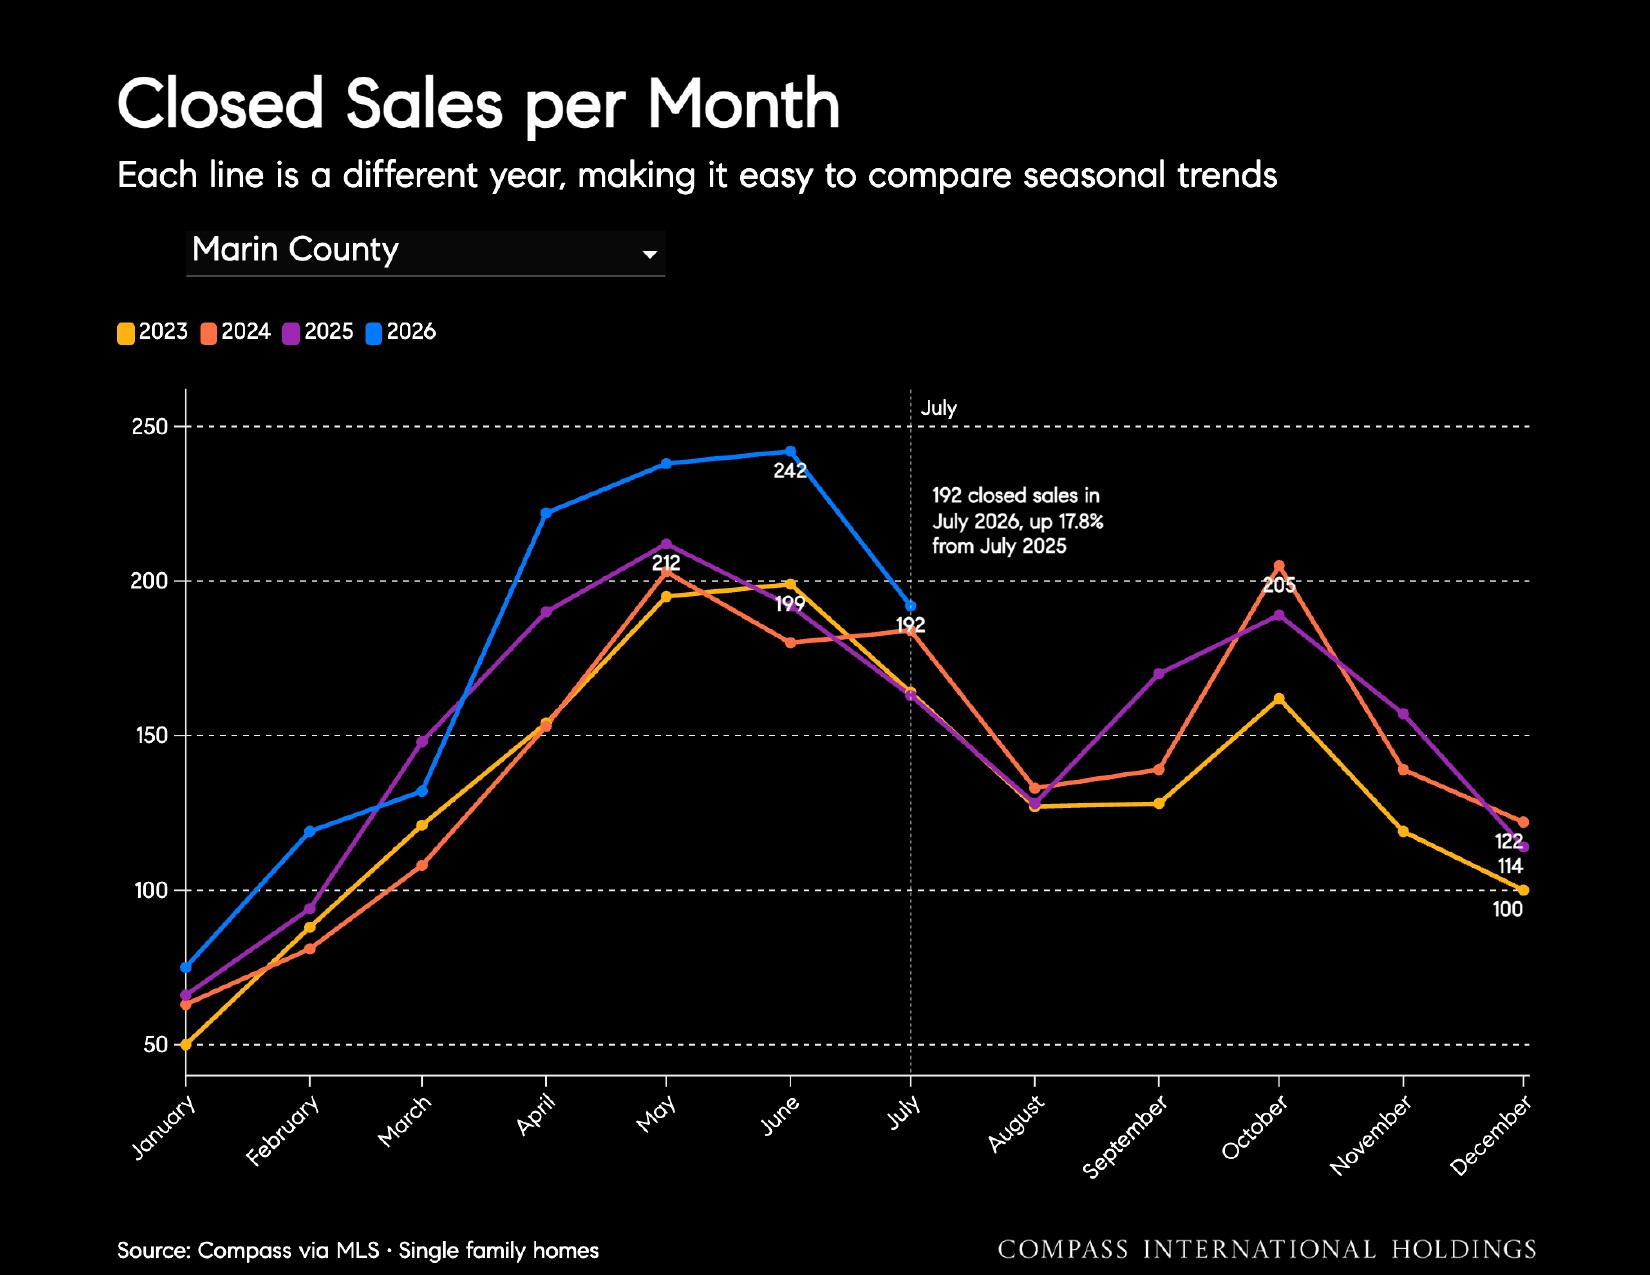
  • 192 closed sales, up 18% YoY.
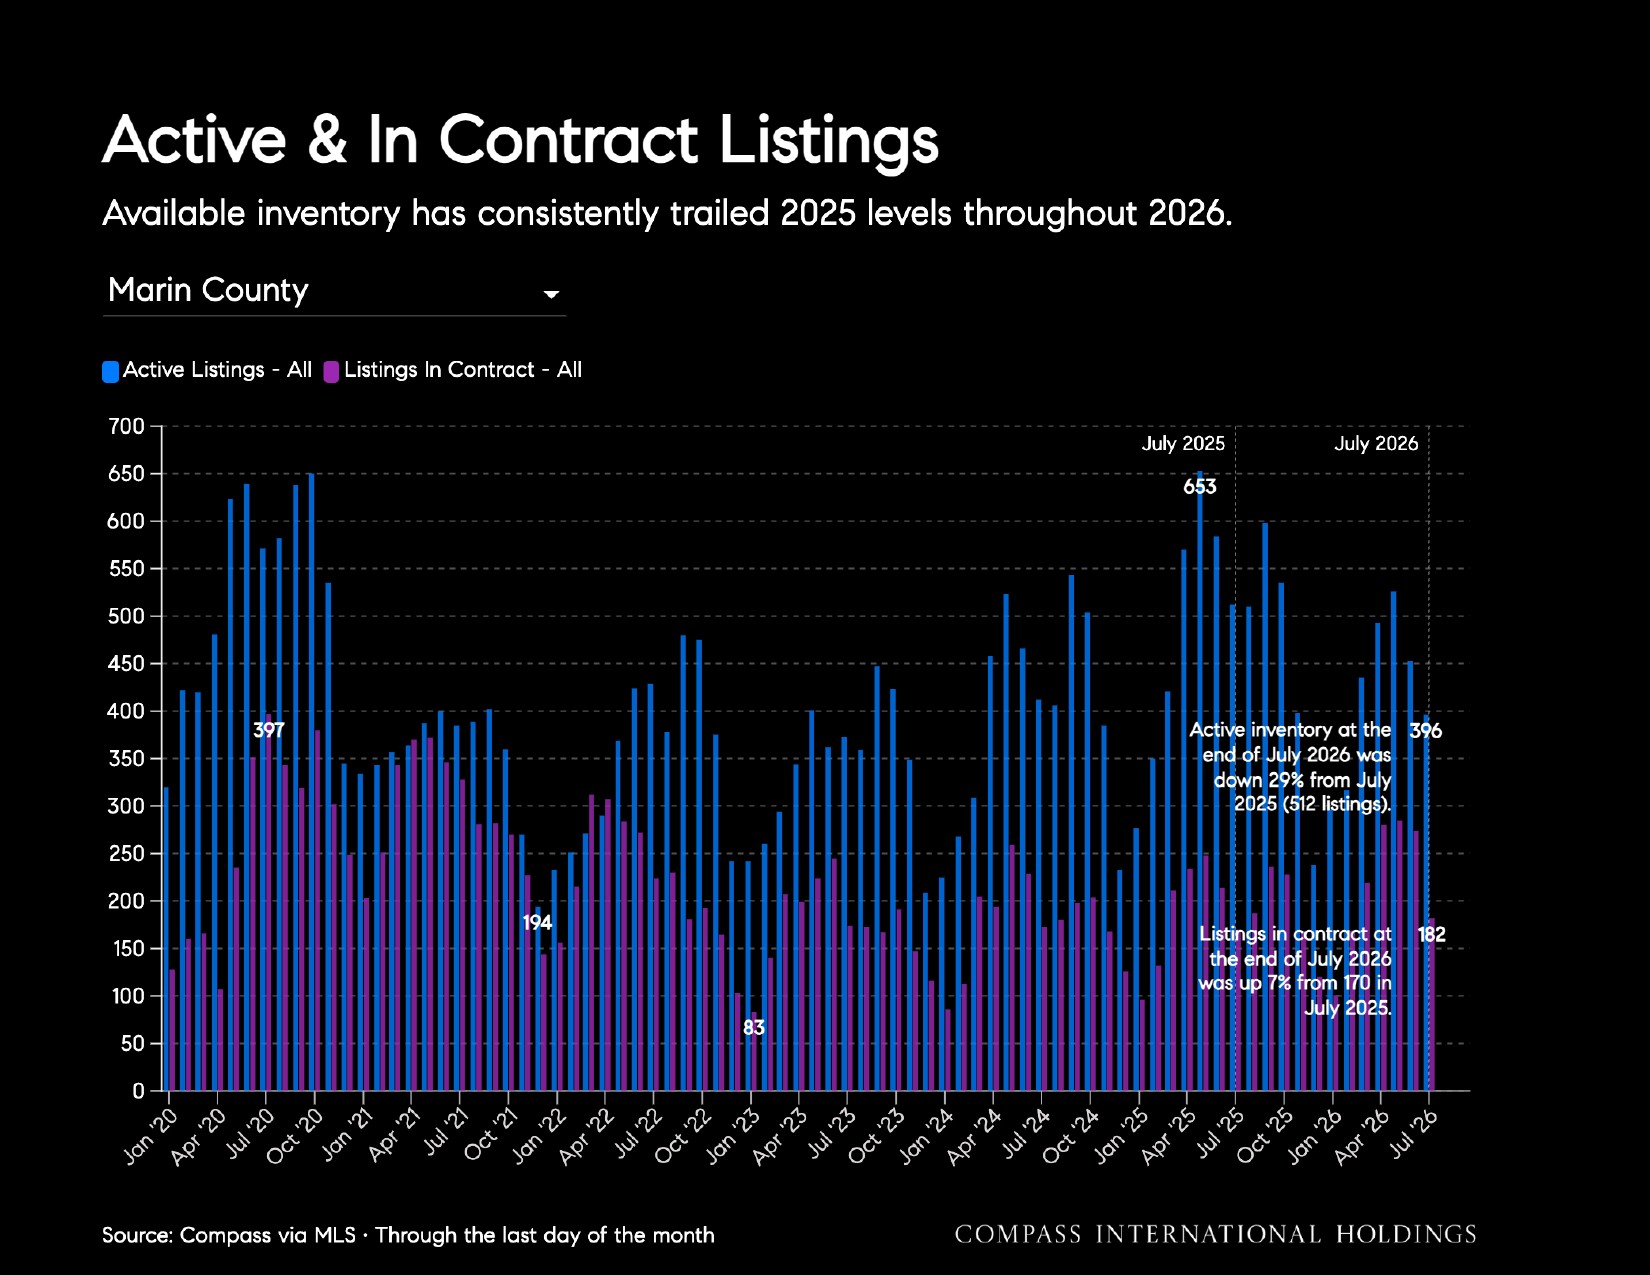
  • 402 active listings, down 22% YoY.
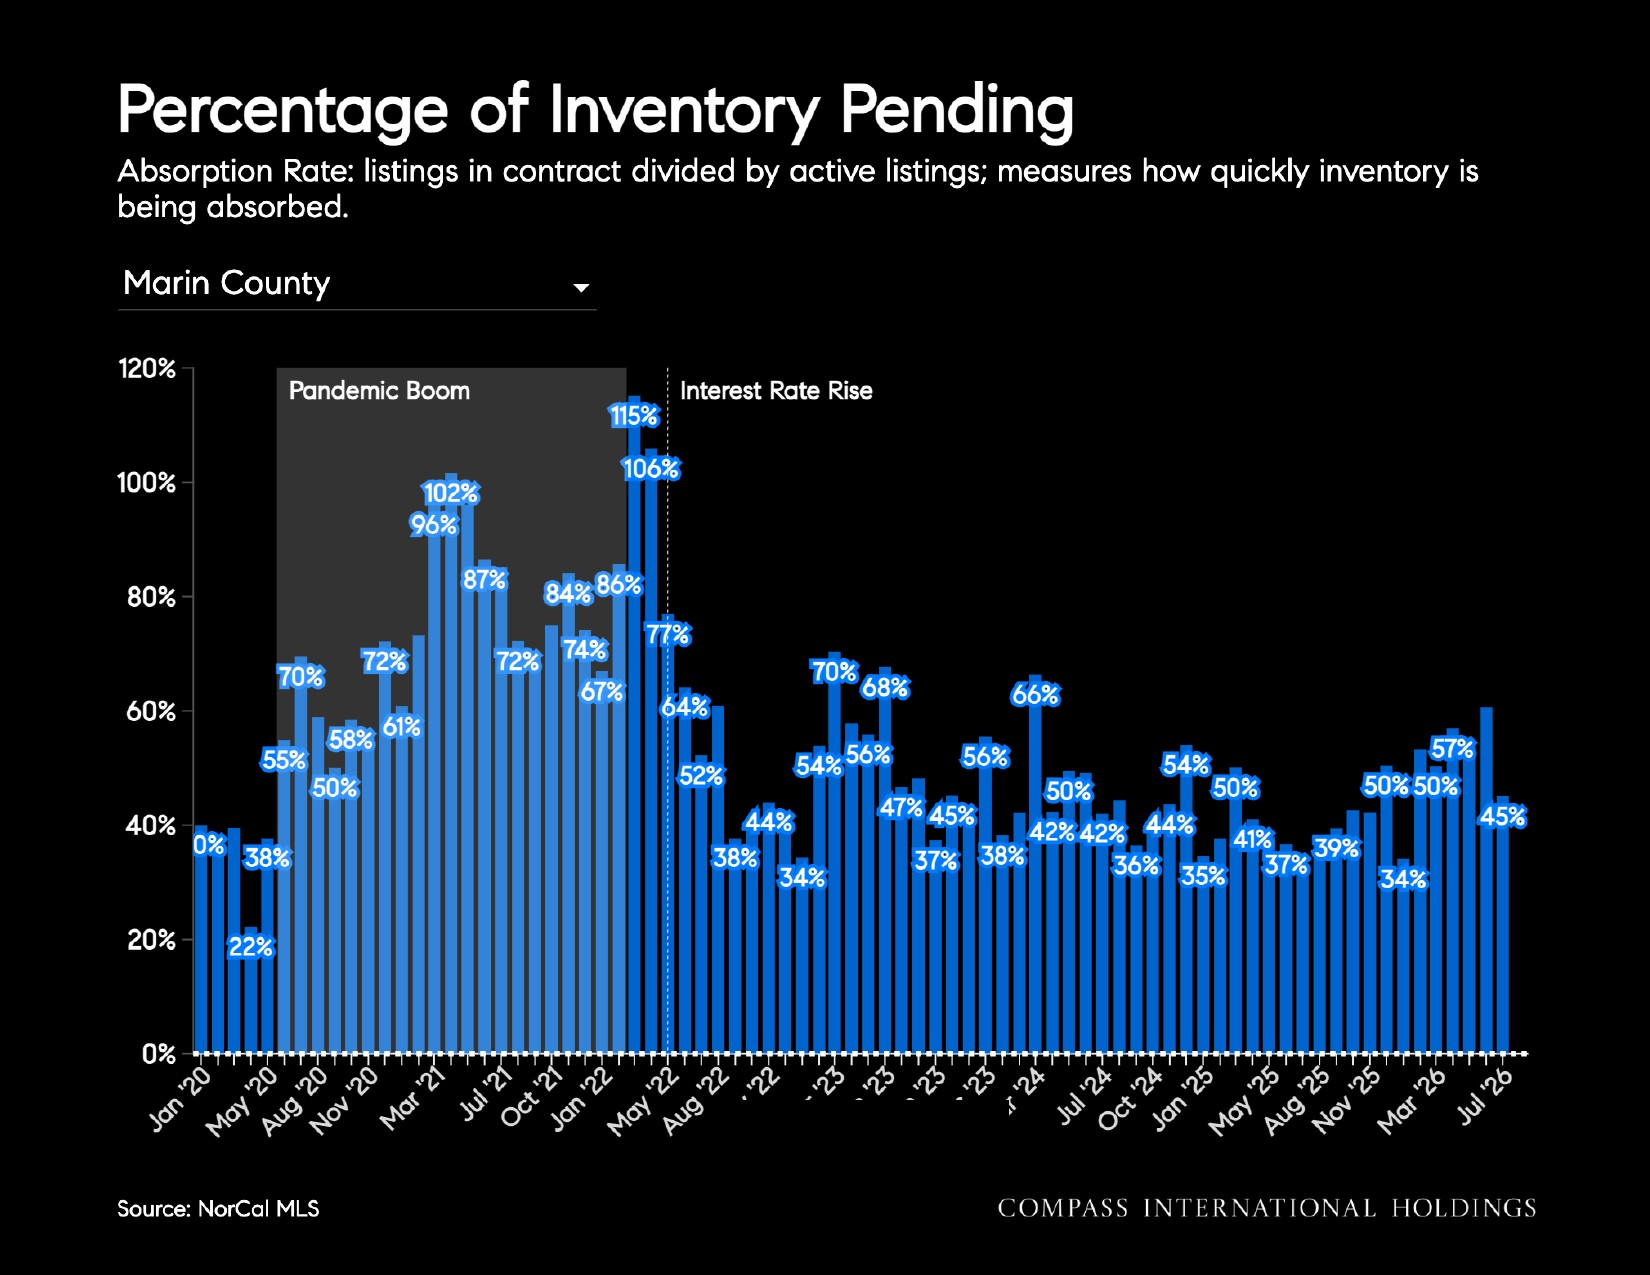
  • 165 listings in contract.
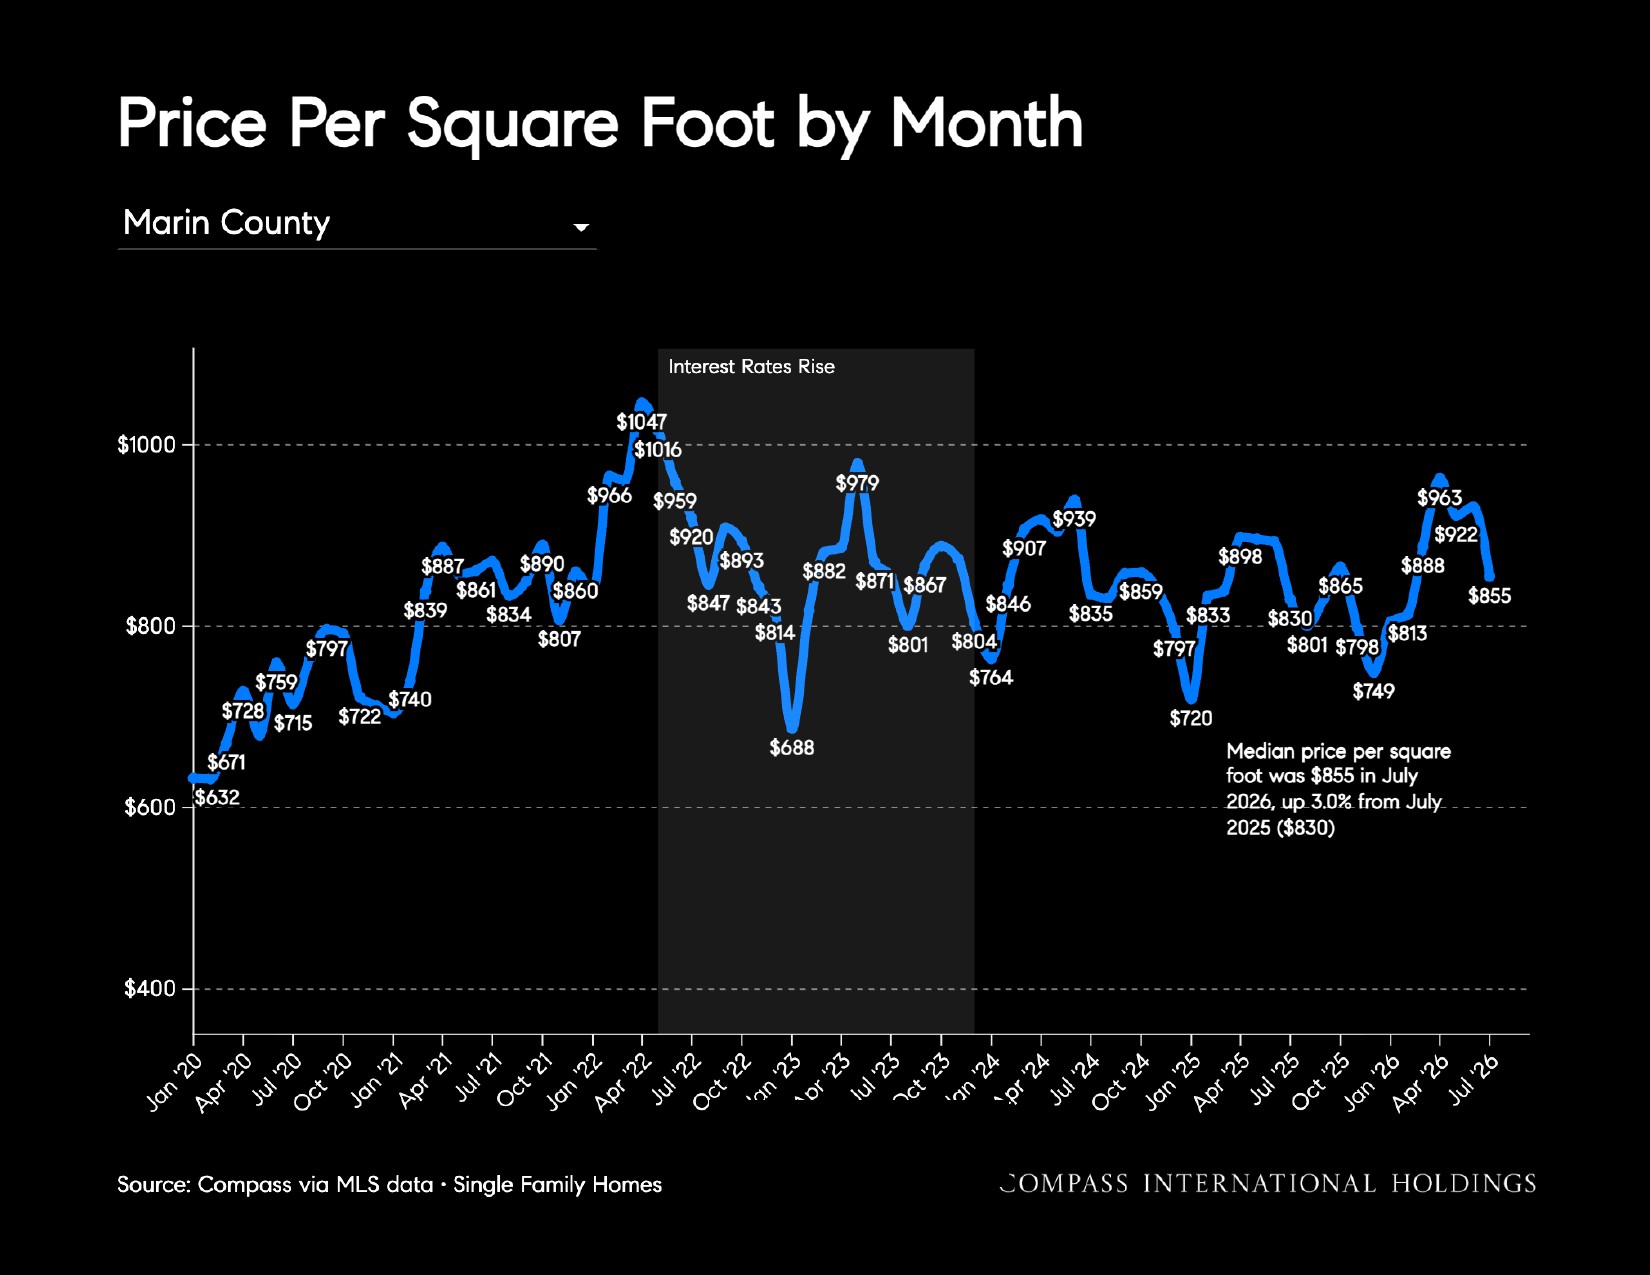
  • Median price per square foot: $855, up 3% YoY.
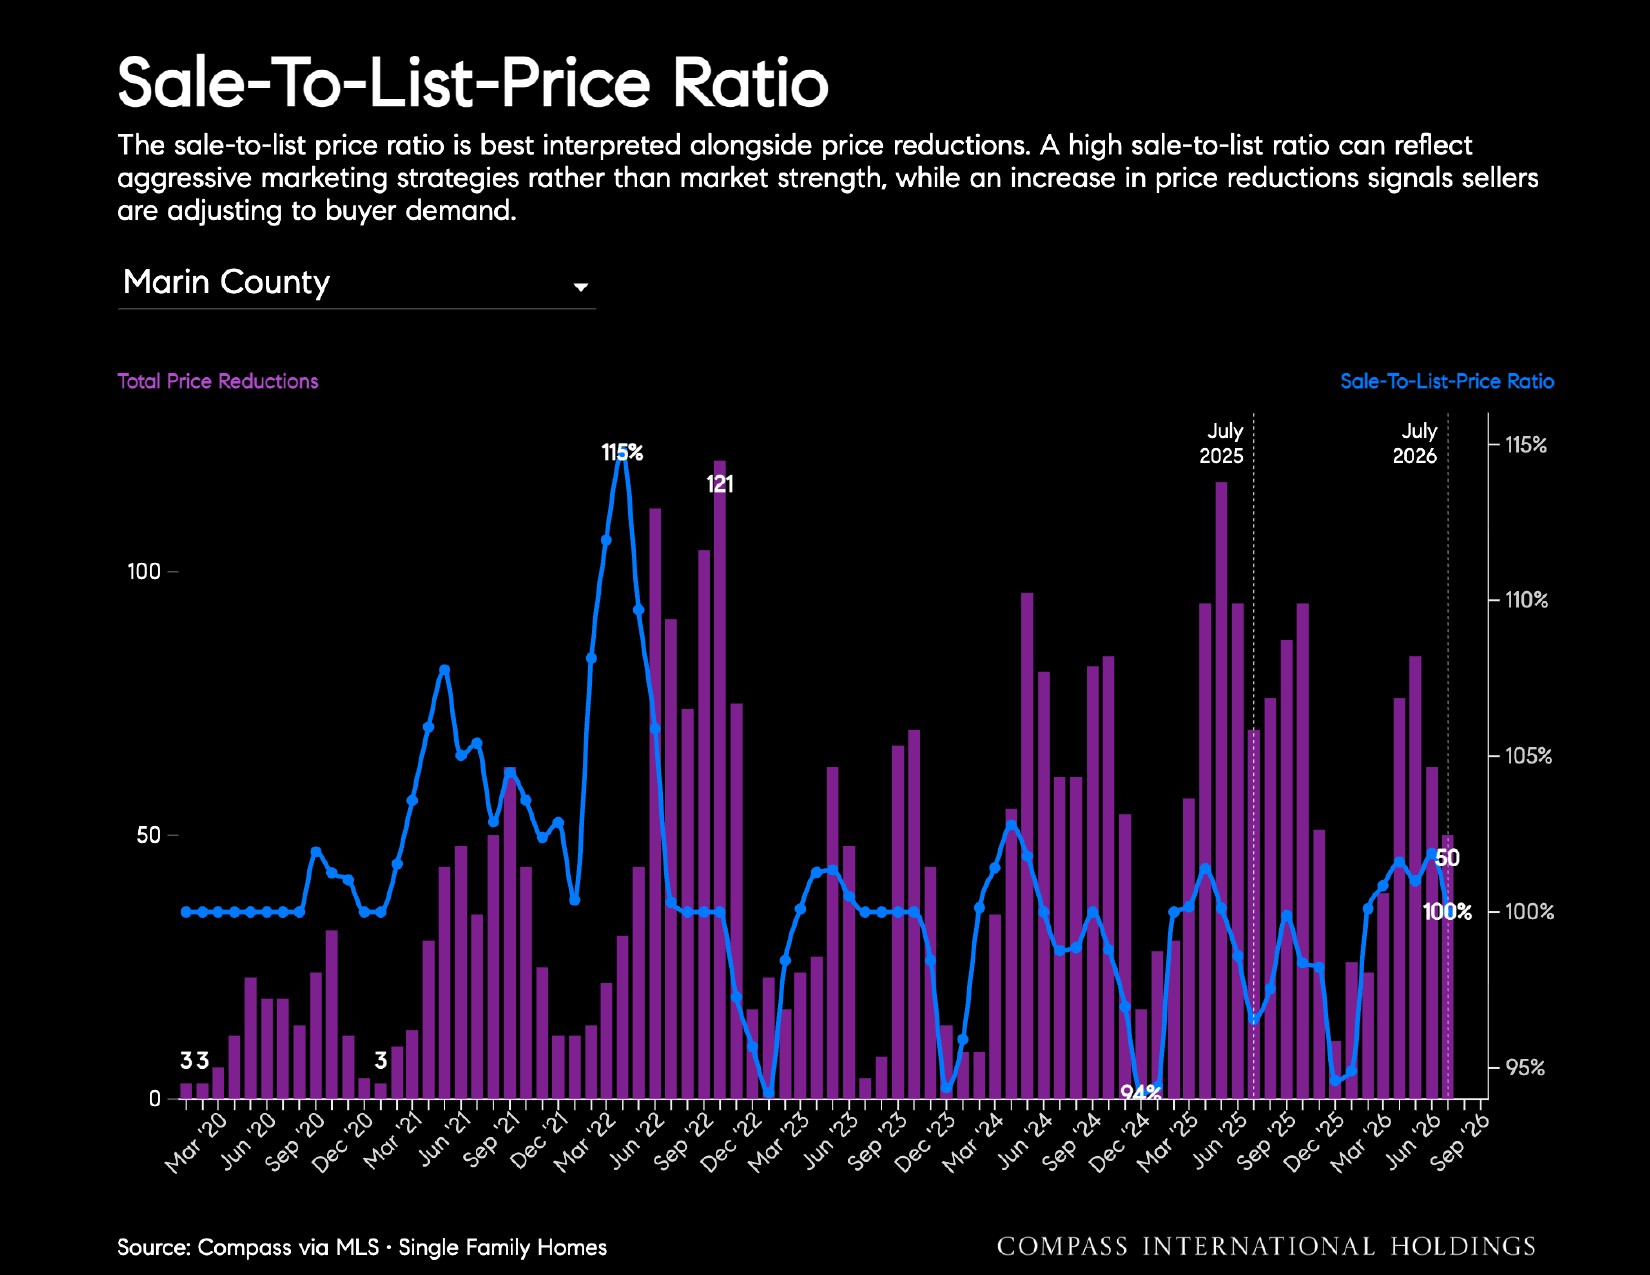
  • Sale-to-list price ratio: 100%, up from 97% last July.
  • 50 price reductions, down 29% YoY.
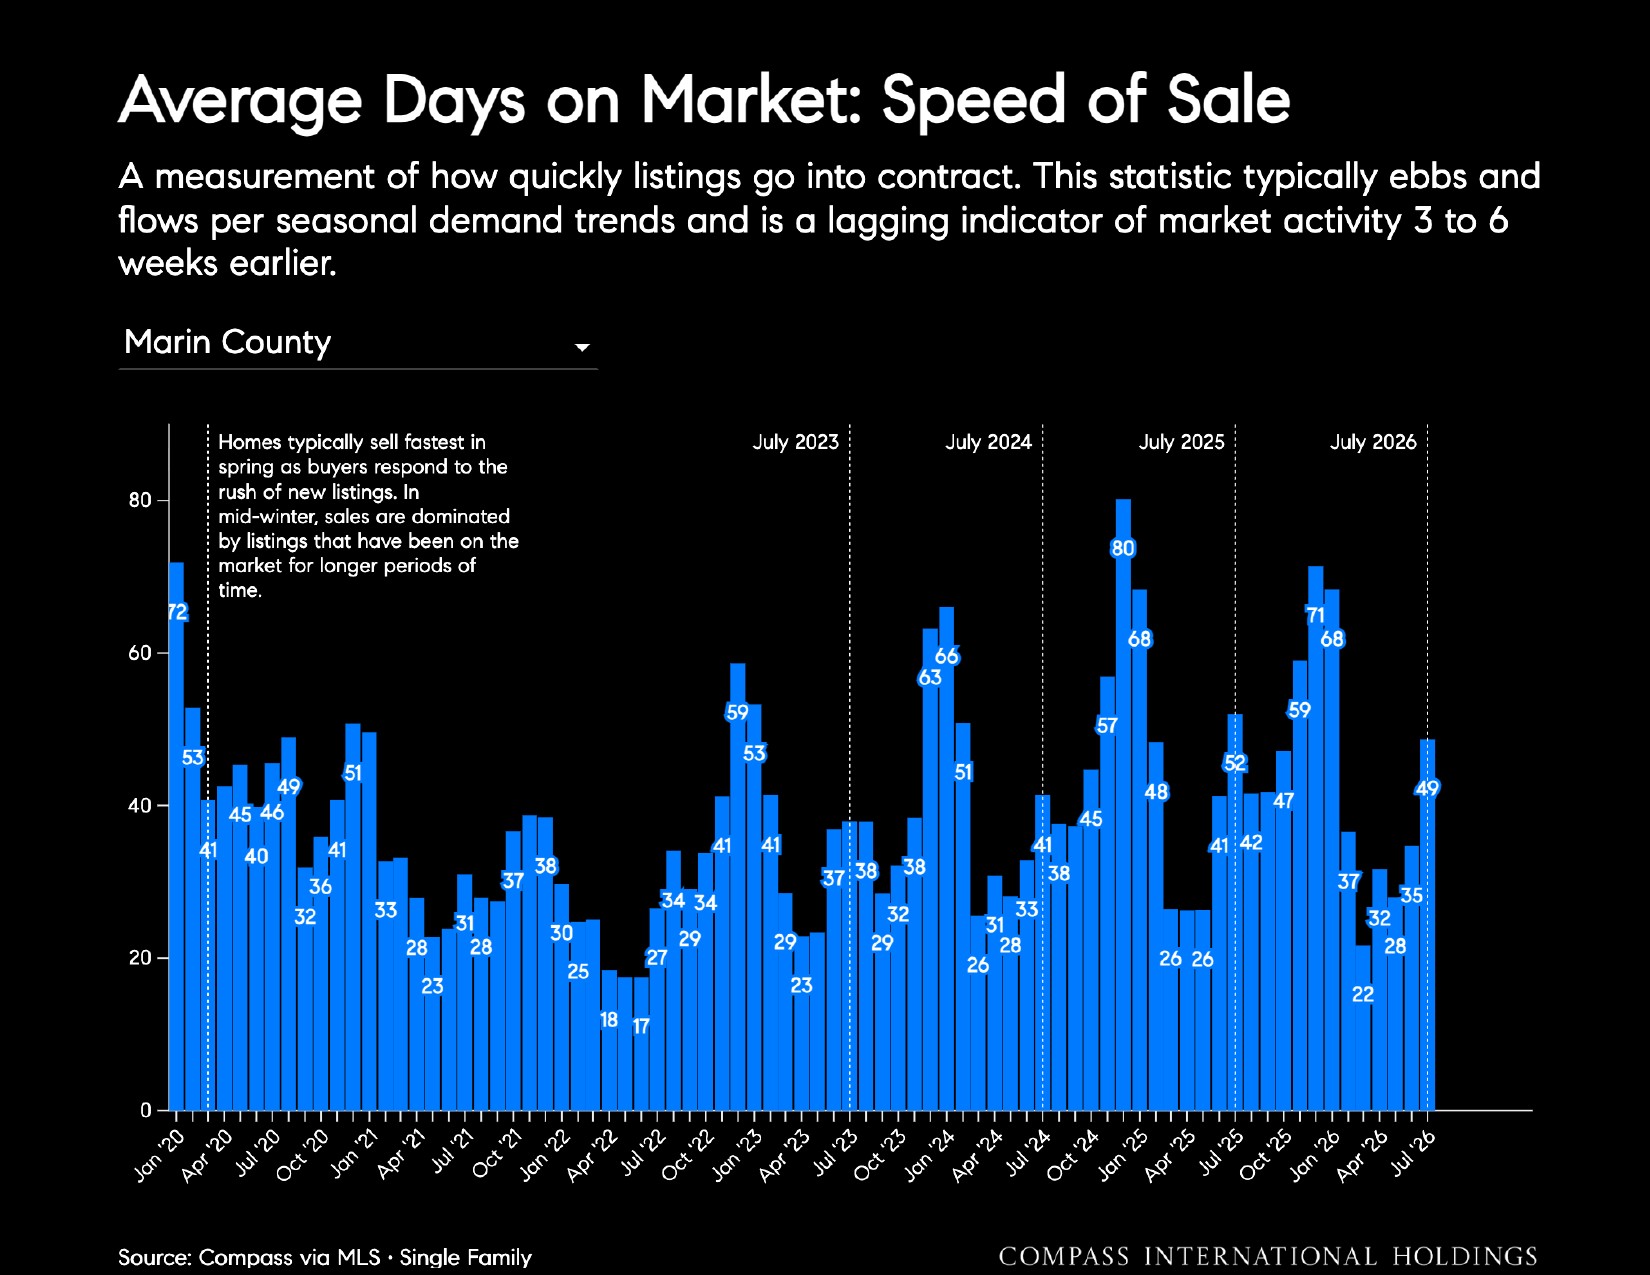
  • Average days on market: 49 days, down 6% YoY.

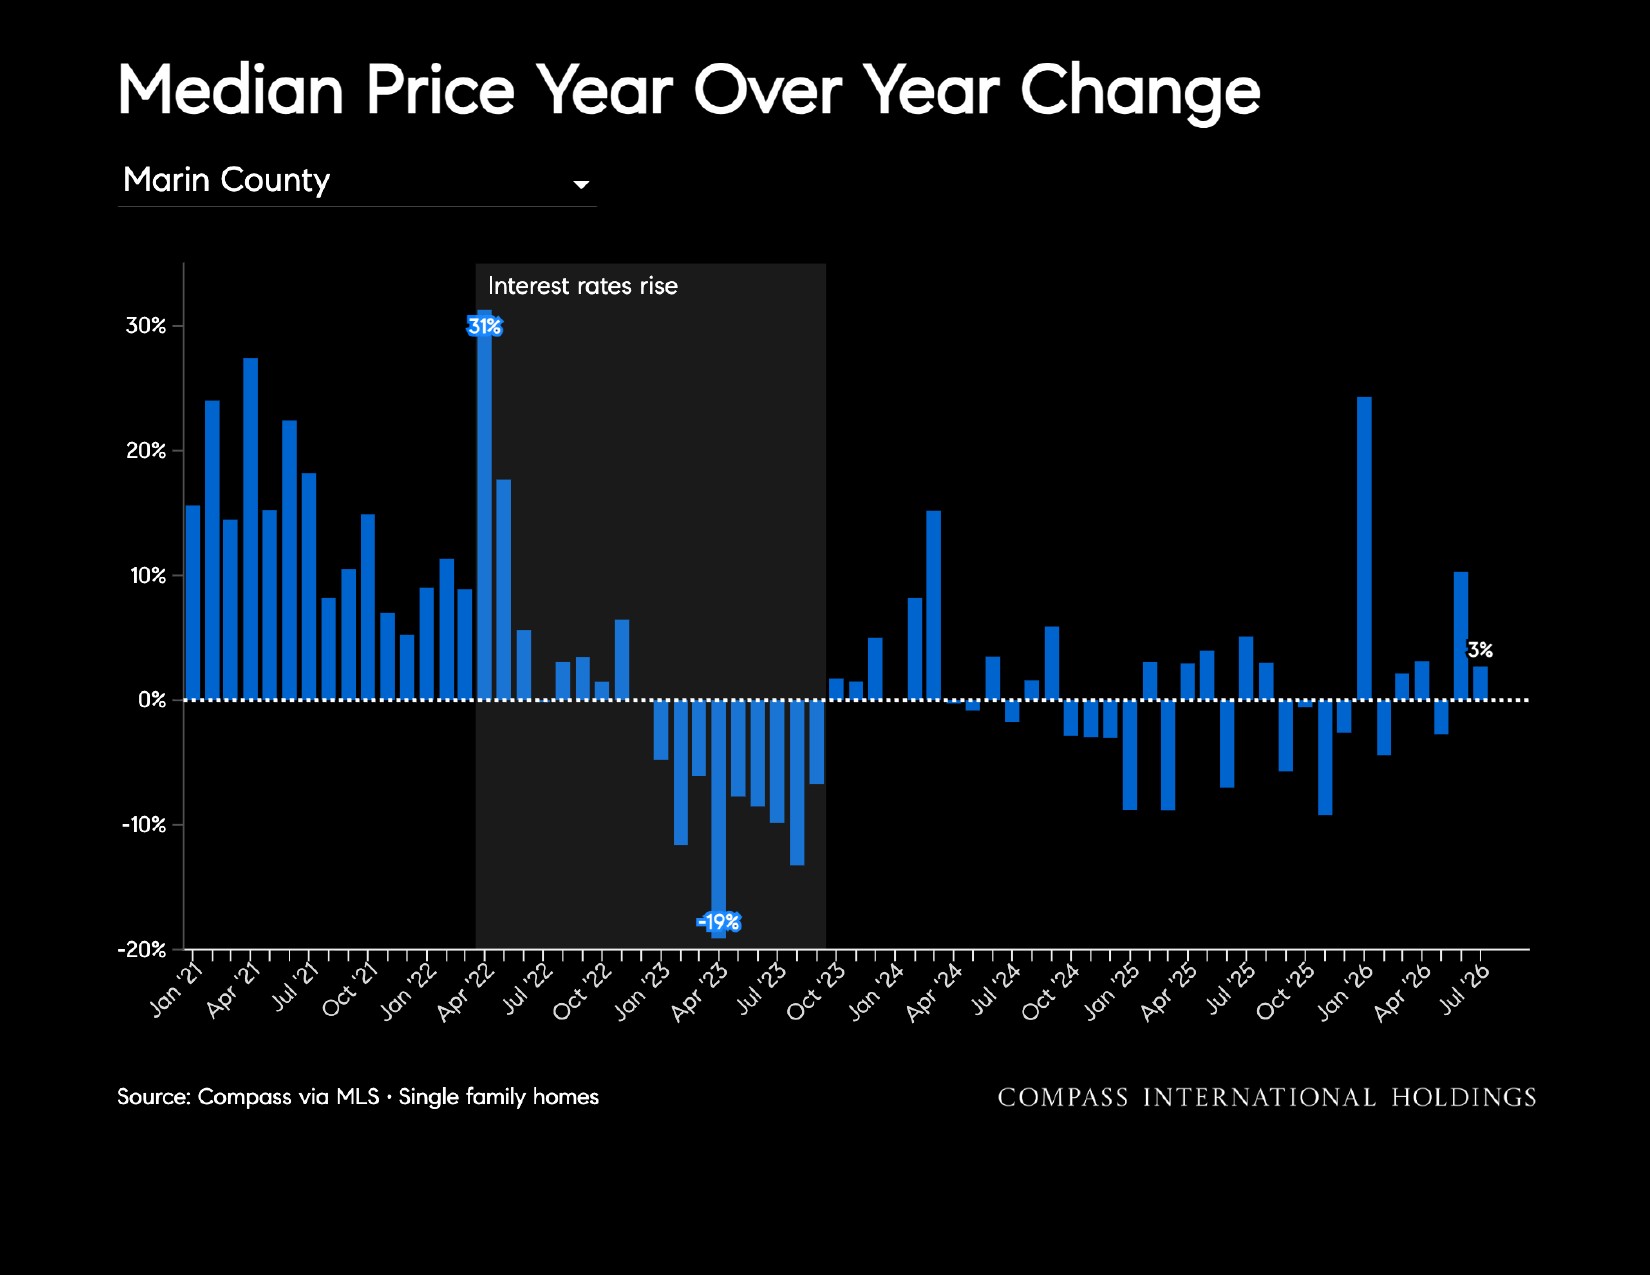
Median sale price was $1.72M in July 2026, up 3% YoY from $1.67M. Year-over-year appreciation moderated from 11% in June to 3% in July.

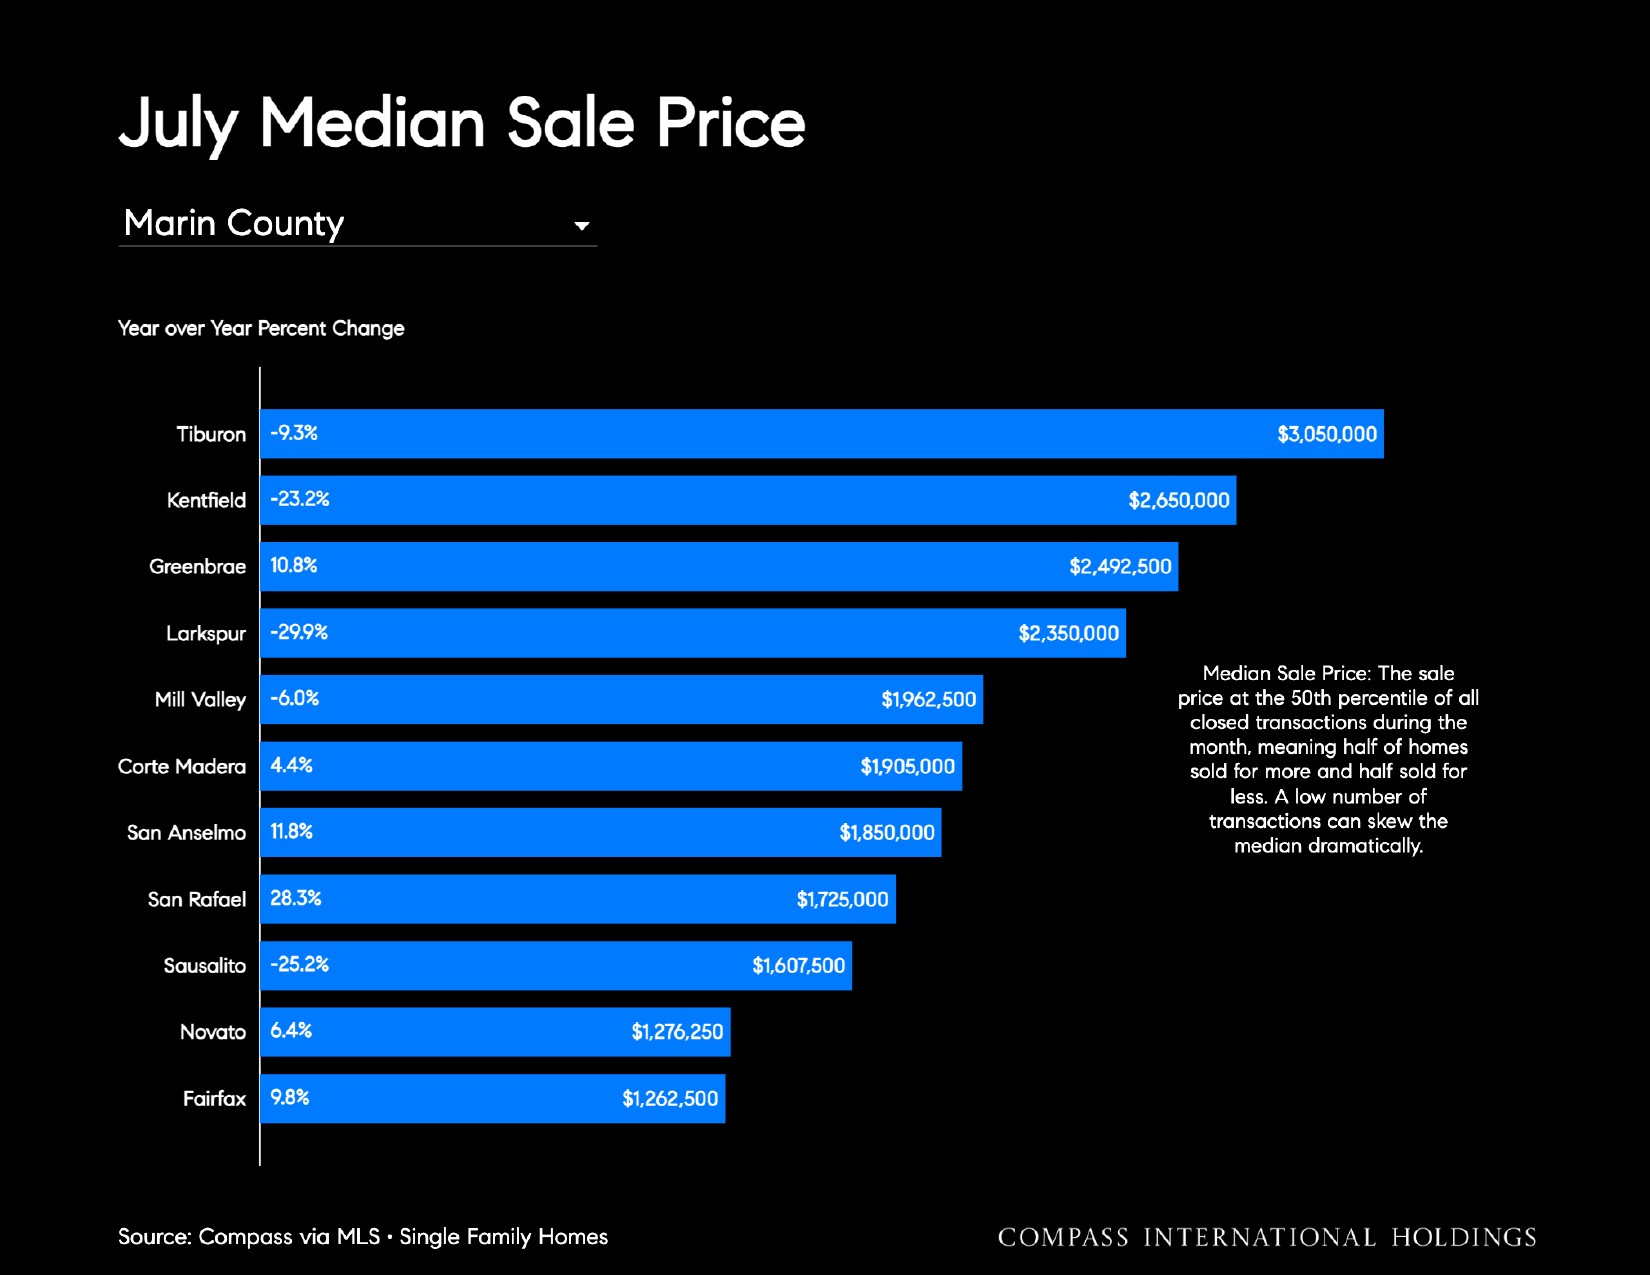
Tiburon had the highest median sale price at $3.05M, down 9% YoY. San Rafael recorded the largest increase at 28%, while Larkspur recorded the largest decline at 30%.

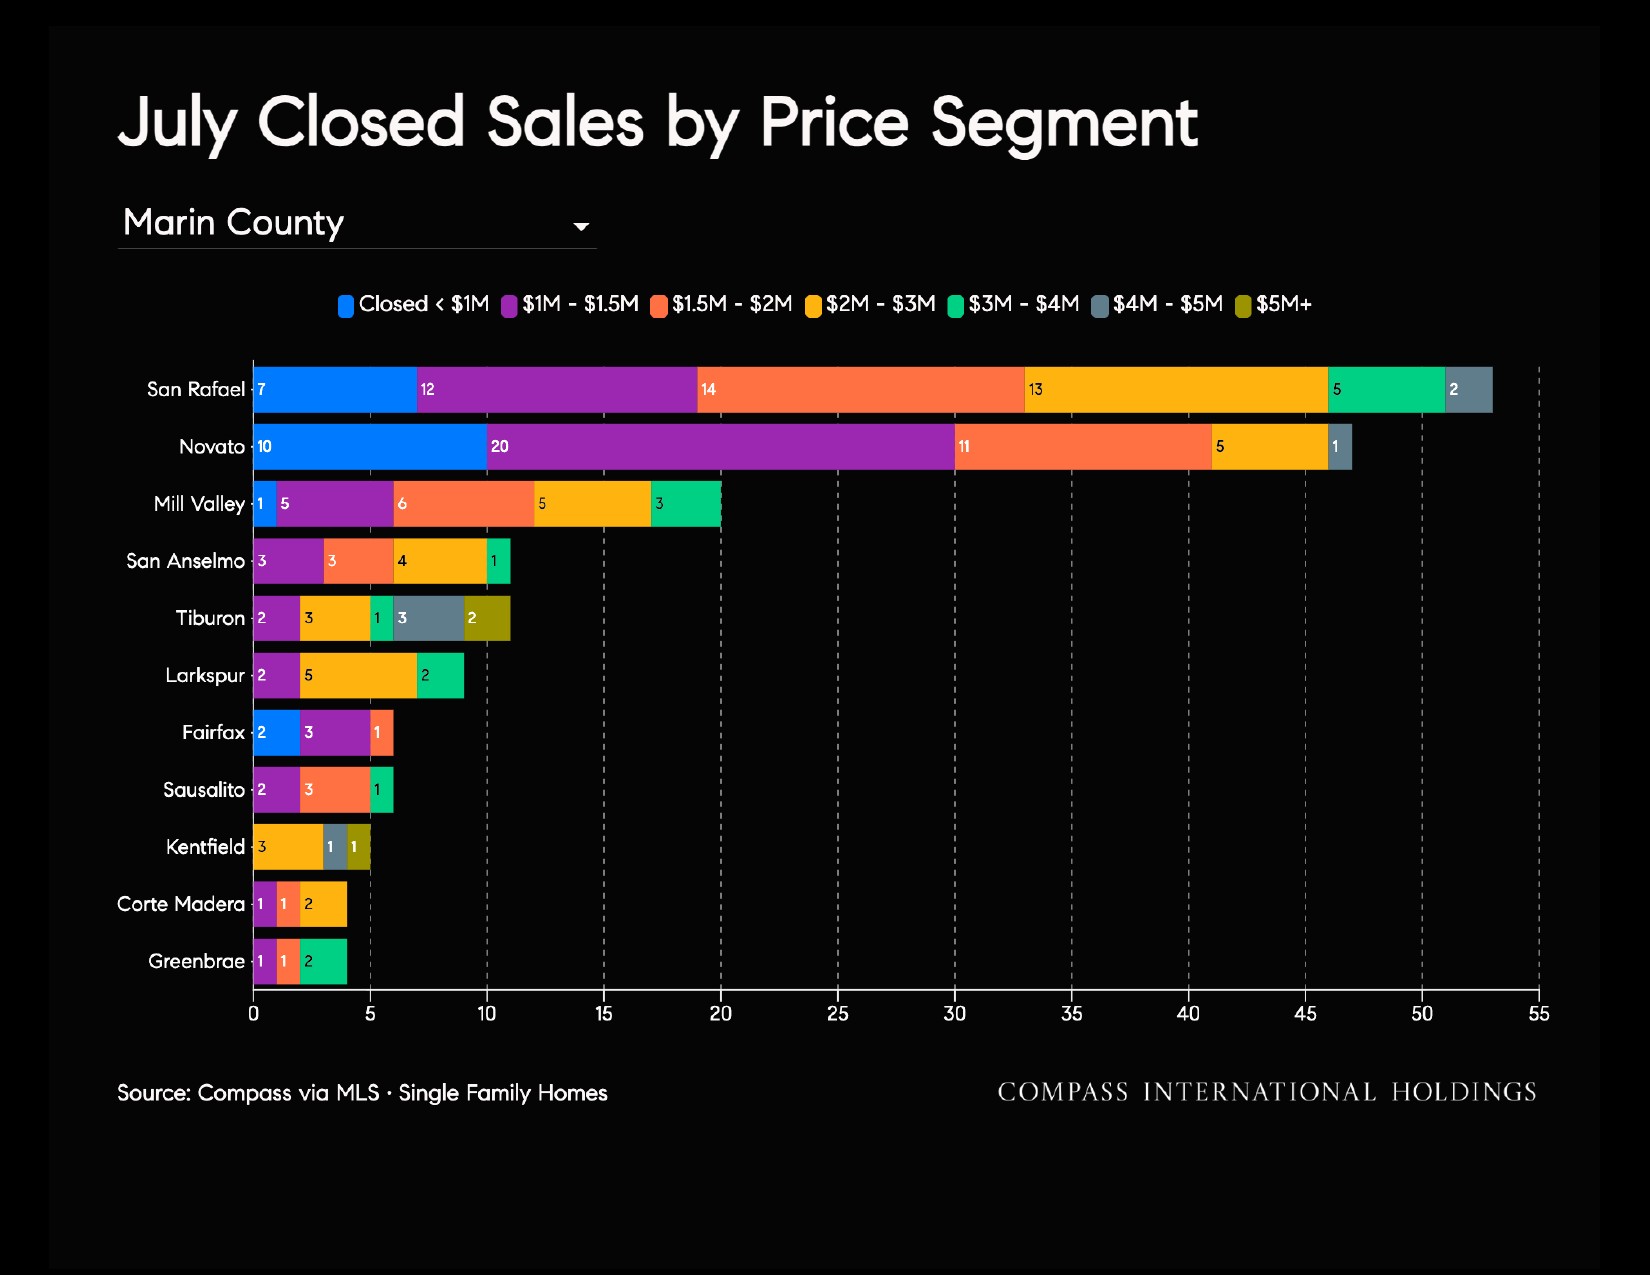
The largest concentration of closed sales was between $1M and $2M. San Rafael recorded the most closed sales overall, while Stinson Beach had 3 sales, all above $5M.

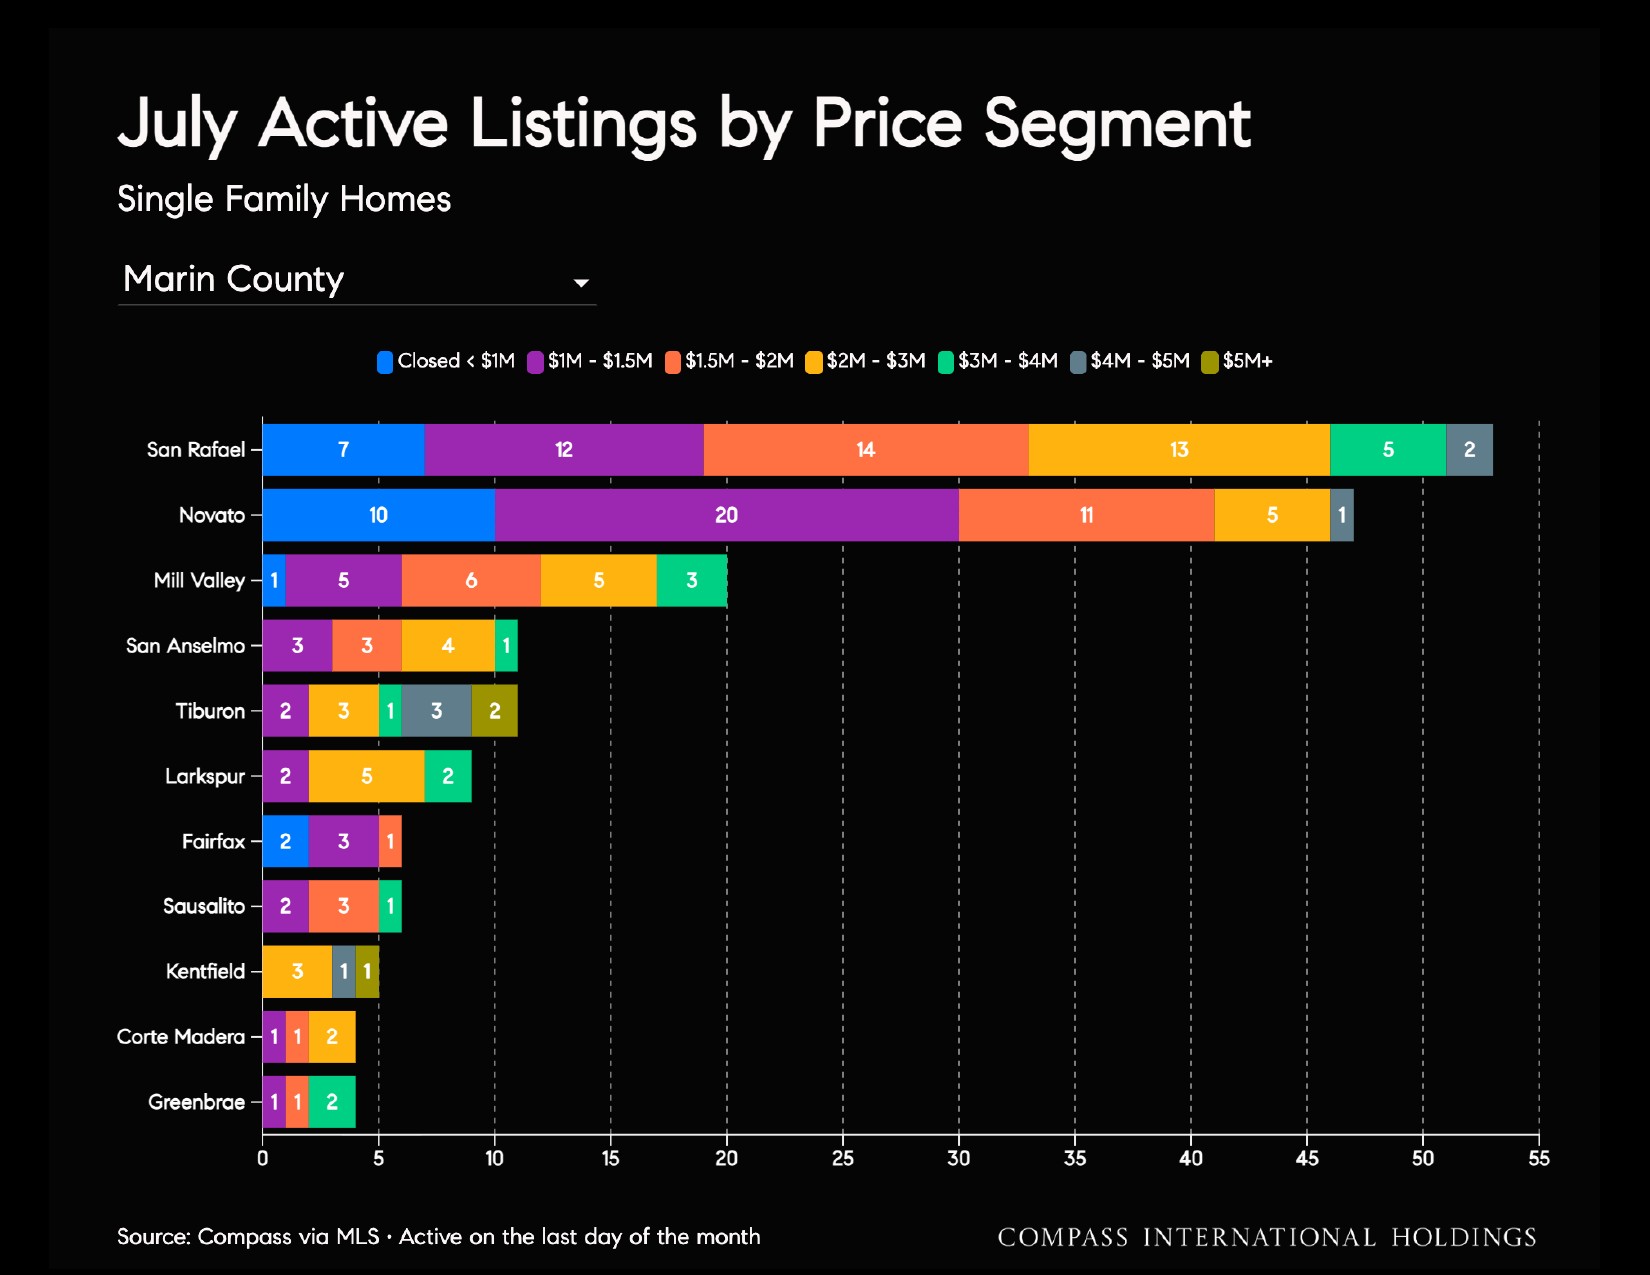
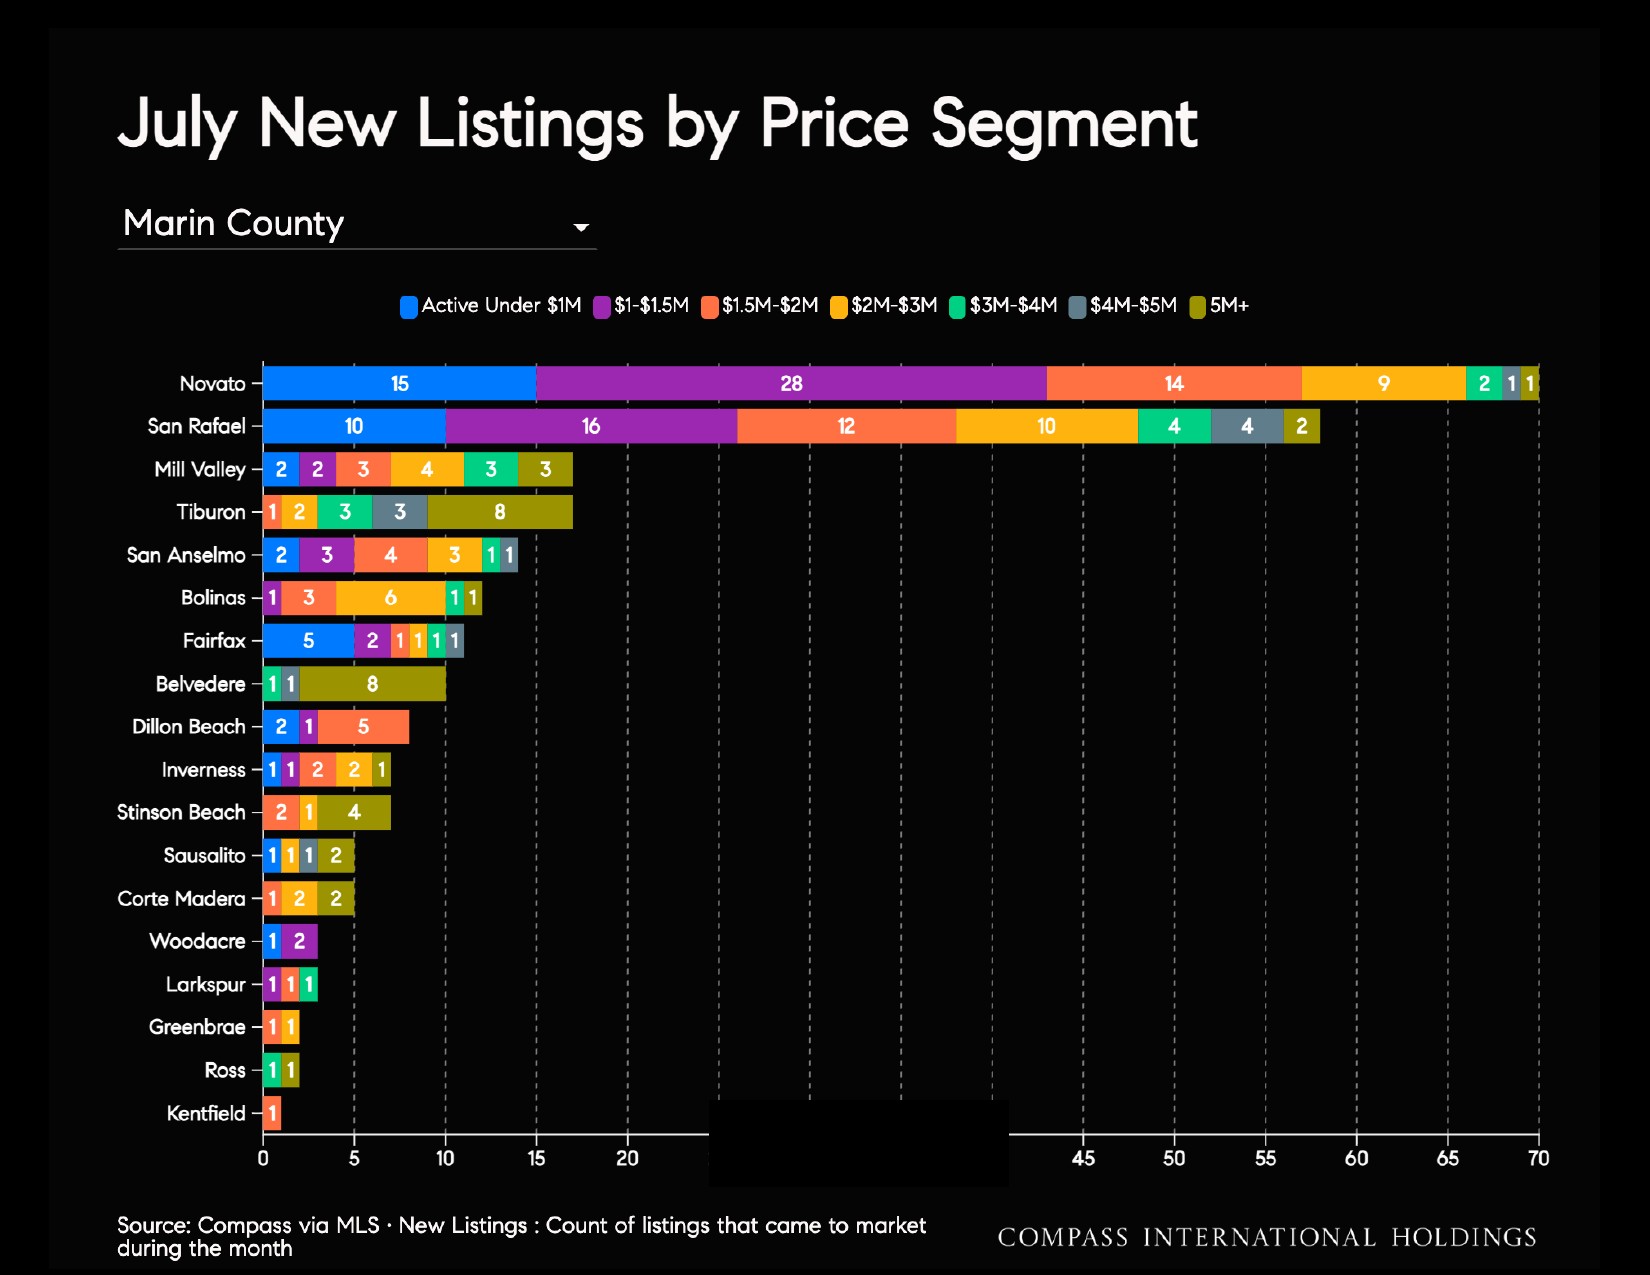
There were 402 active listings, down 22% YoY. Novato and San Rafael had the largest number of listings under SM, while Tiburon and Belvedere each had 8 listings above $5M.

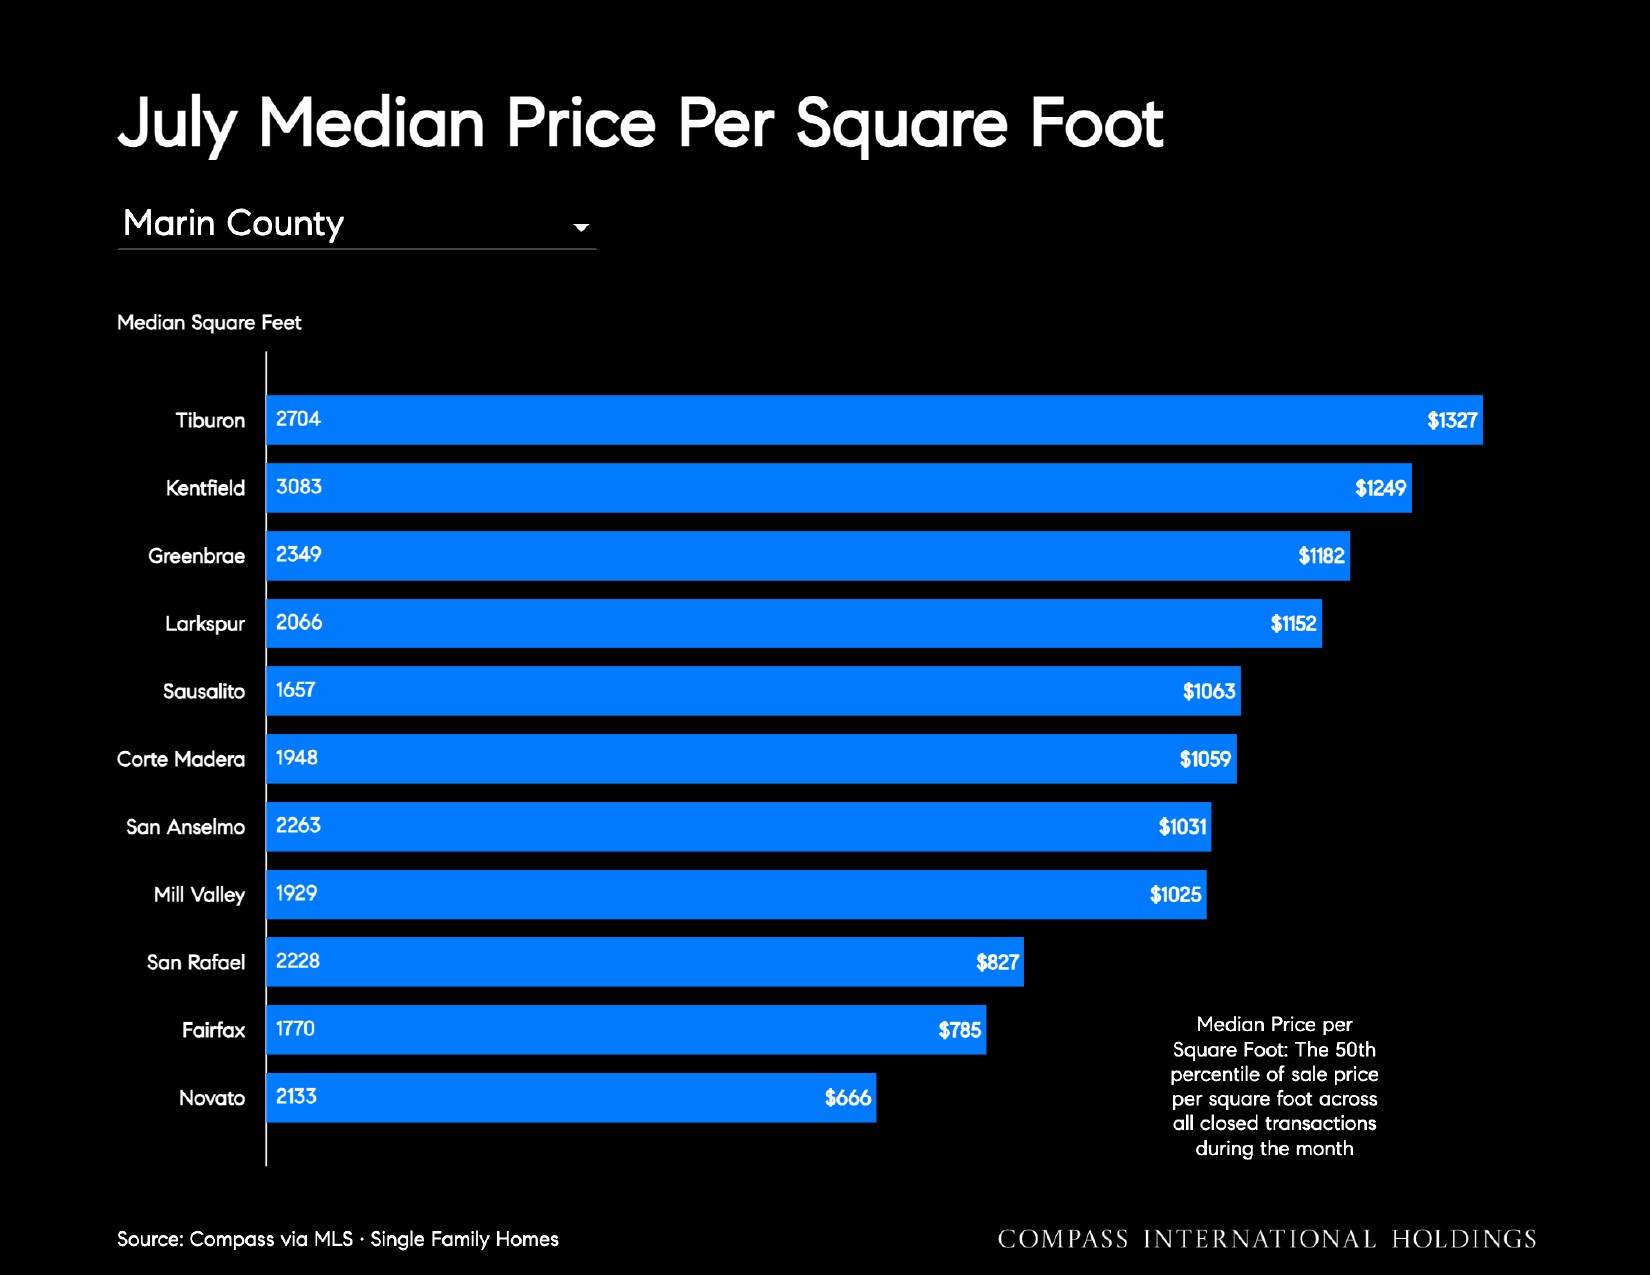
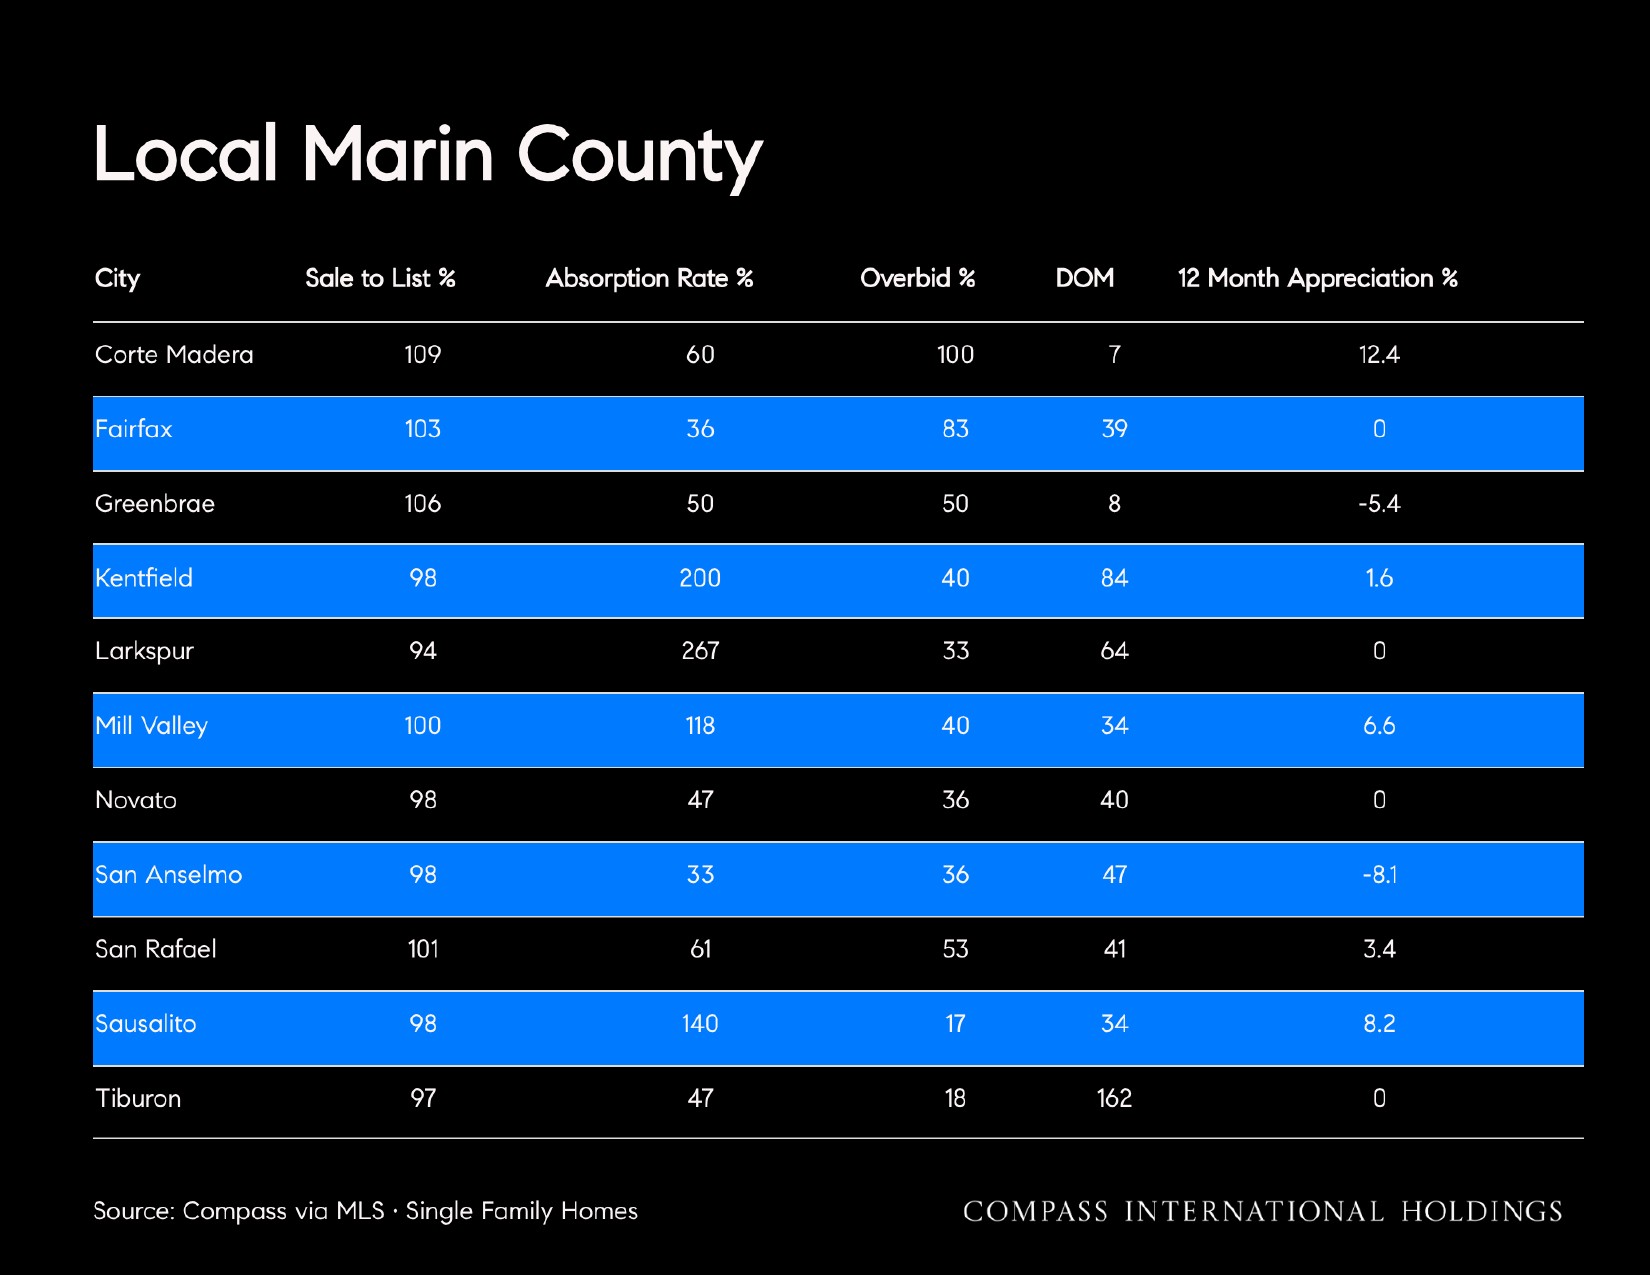
Median price per square foot was $855, up 3% YoY. Kentfield had the highest at $1,249.

The sale-to-list price ratio was 100%, while price reductions totaled 50, down 29% YoY.

Average days on market was 49 days, down 6% YoY but up from 35 days in June 2026.
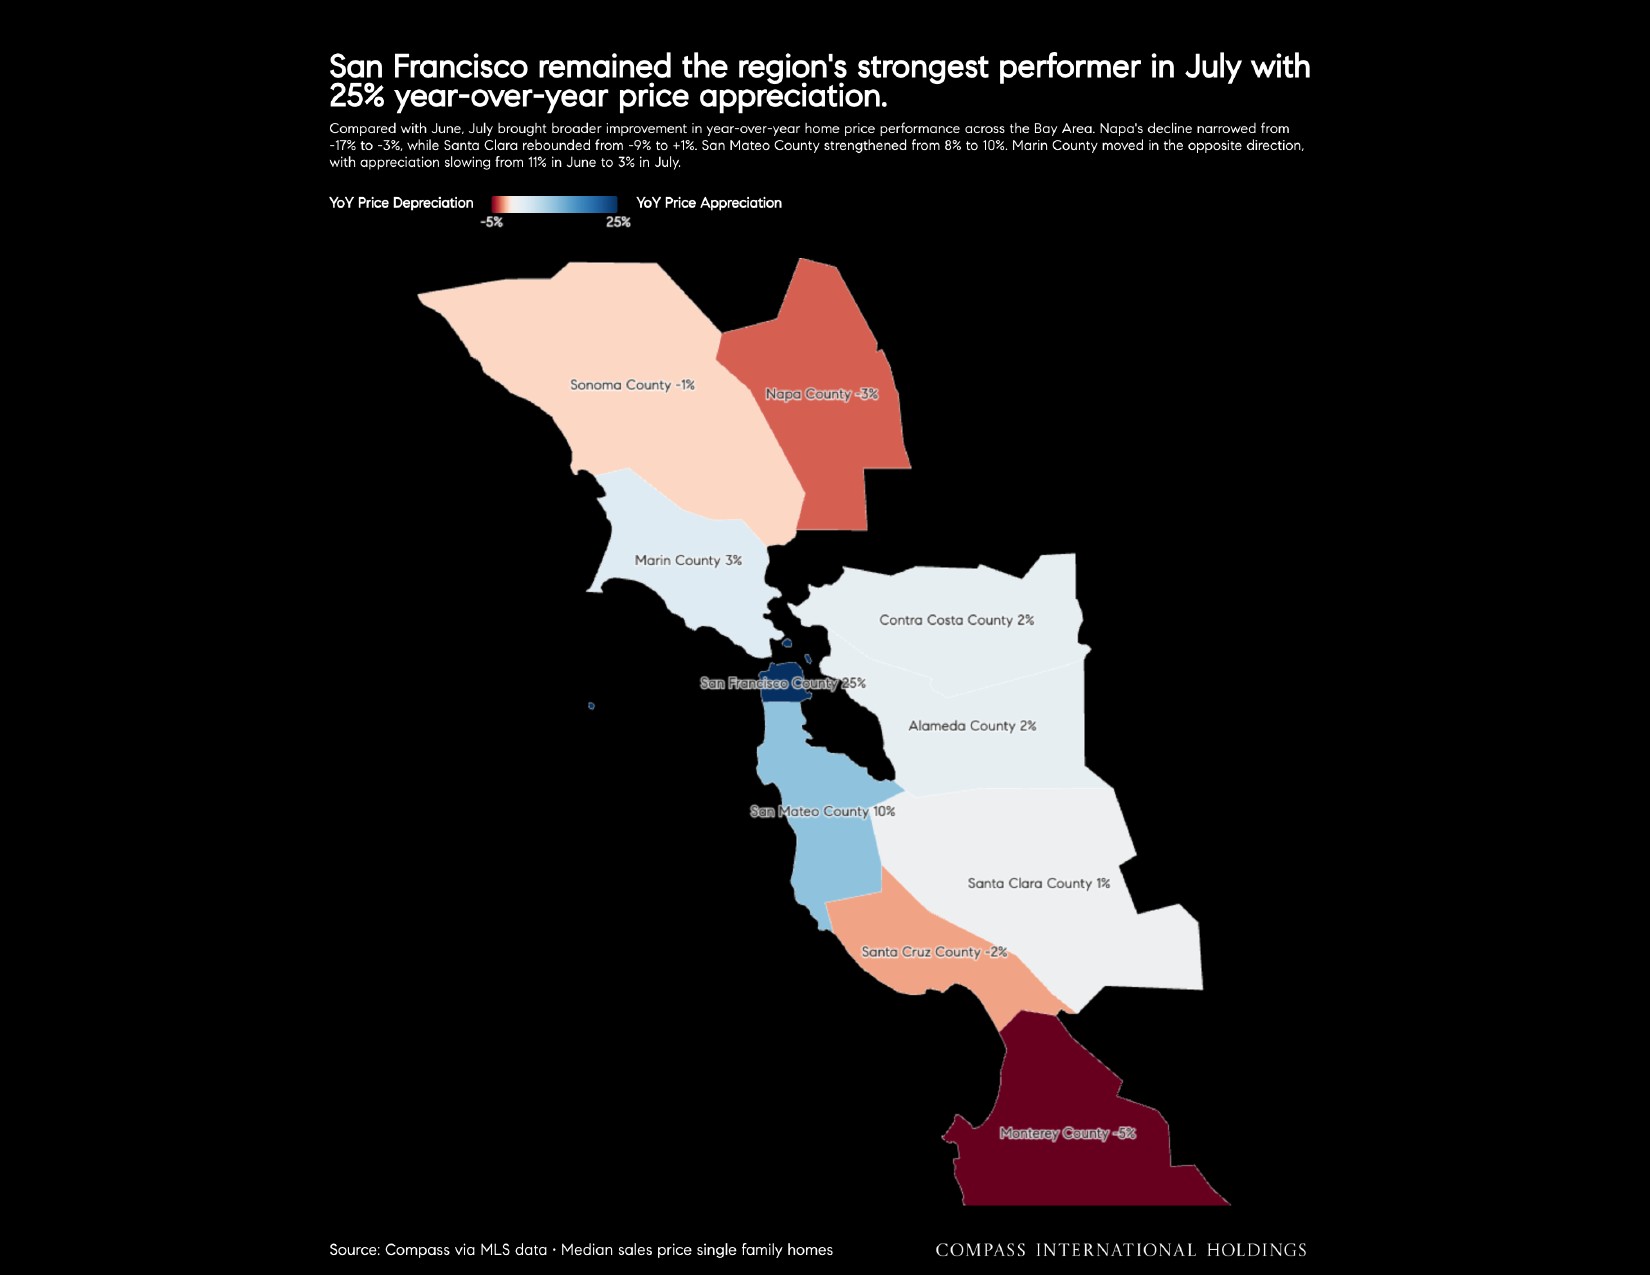
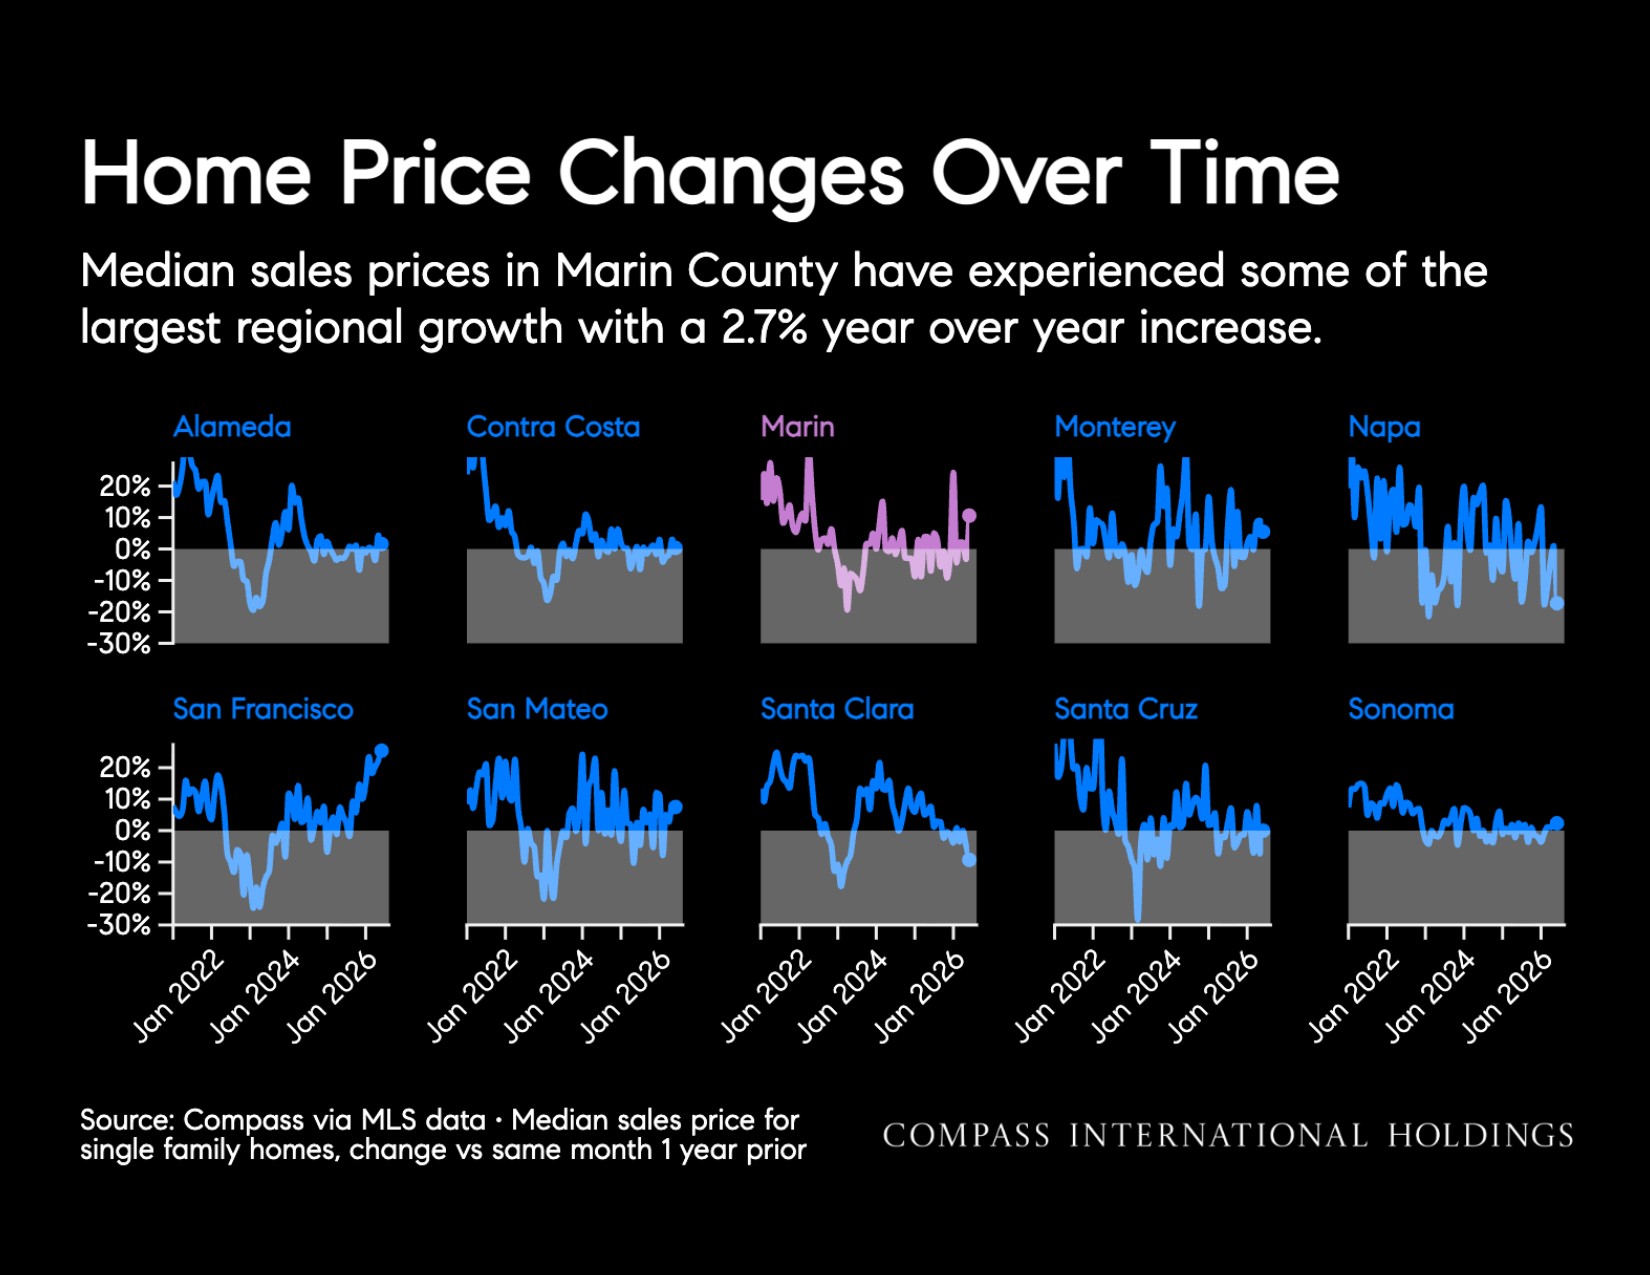
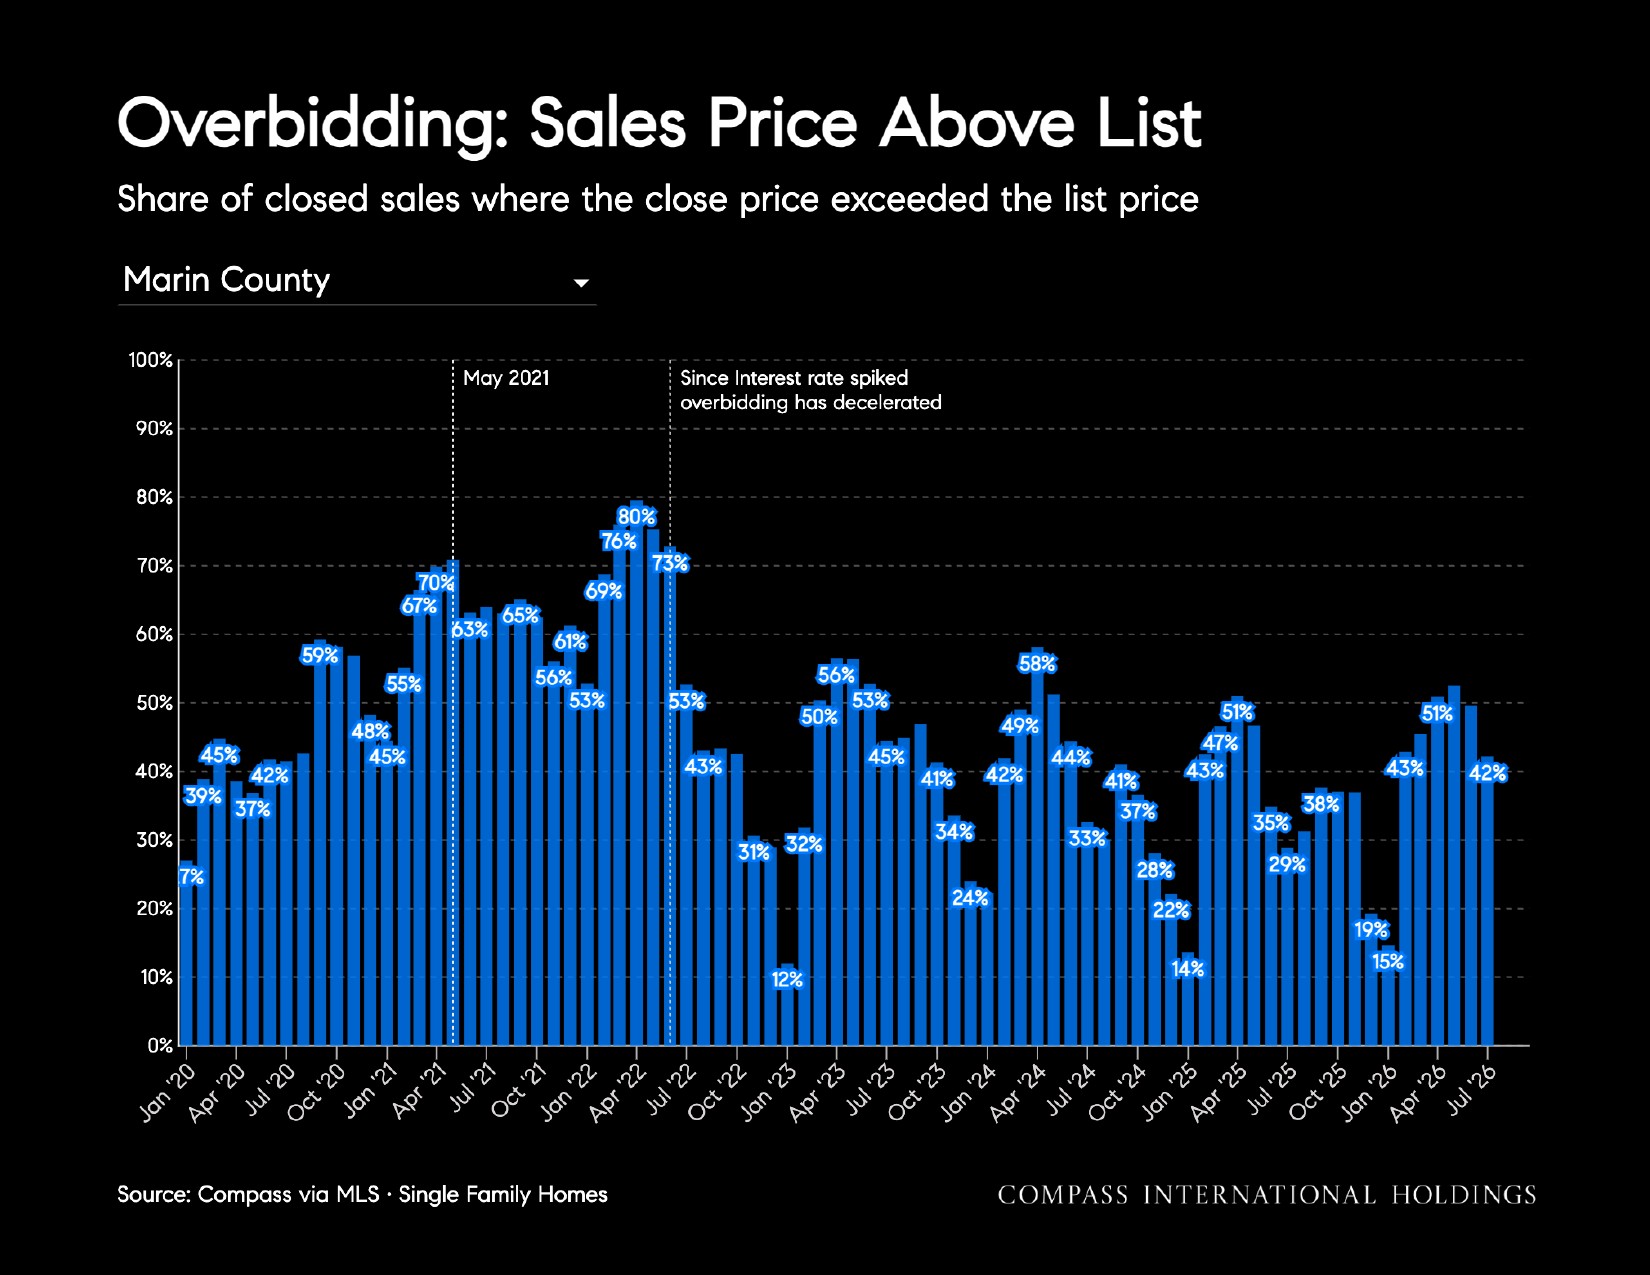
San Francisco remained the region's strongest performer in July with 25% year-over-year price appreciation.Home Price Changes Over Time Median sales prices in Marin County have experienced some of the largest regional growth with a 2.7% year over year increase.Median Price Year Over Year Change Marin CountyMedian Sale Price - Single Family Each line represents a different year, making it easy to compare seasonal trends. Marin CountyJuly Median Sale Price Marin CountyClosed Sales per Month Each line is a different year, making it easy to compare seasonal trends Marin CountyJuly Closed Sales by Price Segment Marin CountyActive & In Contract Listings Available inventory has consistently trailed 2025 levels throughout 2026. Marin CountyJuly Active Listings by Price Segment Single Family Homes Marin CountyPercentage of Inventory Pending Absorption Rate: listings in contract divided by active listings; measures how quickly inventory is being absorbed. Marin CountyJuly New Listings by Price Segment Marin CountyPrice Per Square Foot by Month Marin CountyJuly Median Price Per Square Foot Marin CountySale-To-List-Price Ratio The sale-to-list price ratio is best interpreted alongside price reductions. A high sale-to-list ratio can reflect aggressive marketing strategies rather than market strength, while an increase in price reductions signals sellers are adjusting to buyer demand. Marin CountyAverage Days on Market: Speed of Sale A measurement of how quickly listings go into contract. This statistic typically ebbs and flows per seasonal demand trends and is a lagging indicator of market activity 3 to 6 weeks earlier. Marin CountyOverbidding: Sales Price Above List Share of closed I sales where the close price exceeded the list price Marin CountyLocal Marin County City Sale to List % Absorption Rate % Overbid % DOM 12 Month Appreciation %

Want to learn more about Bay Area market trends?

Let’s connect! With relationships and networks across the city, there are a variety of ways I can help you make informed real estate decisions. Call, email, or text – I’m here to help.


Contact