
February 17, 2023
Marin: Feb 2023 Market Stats
By Compass
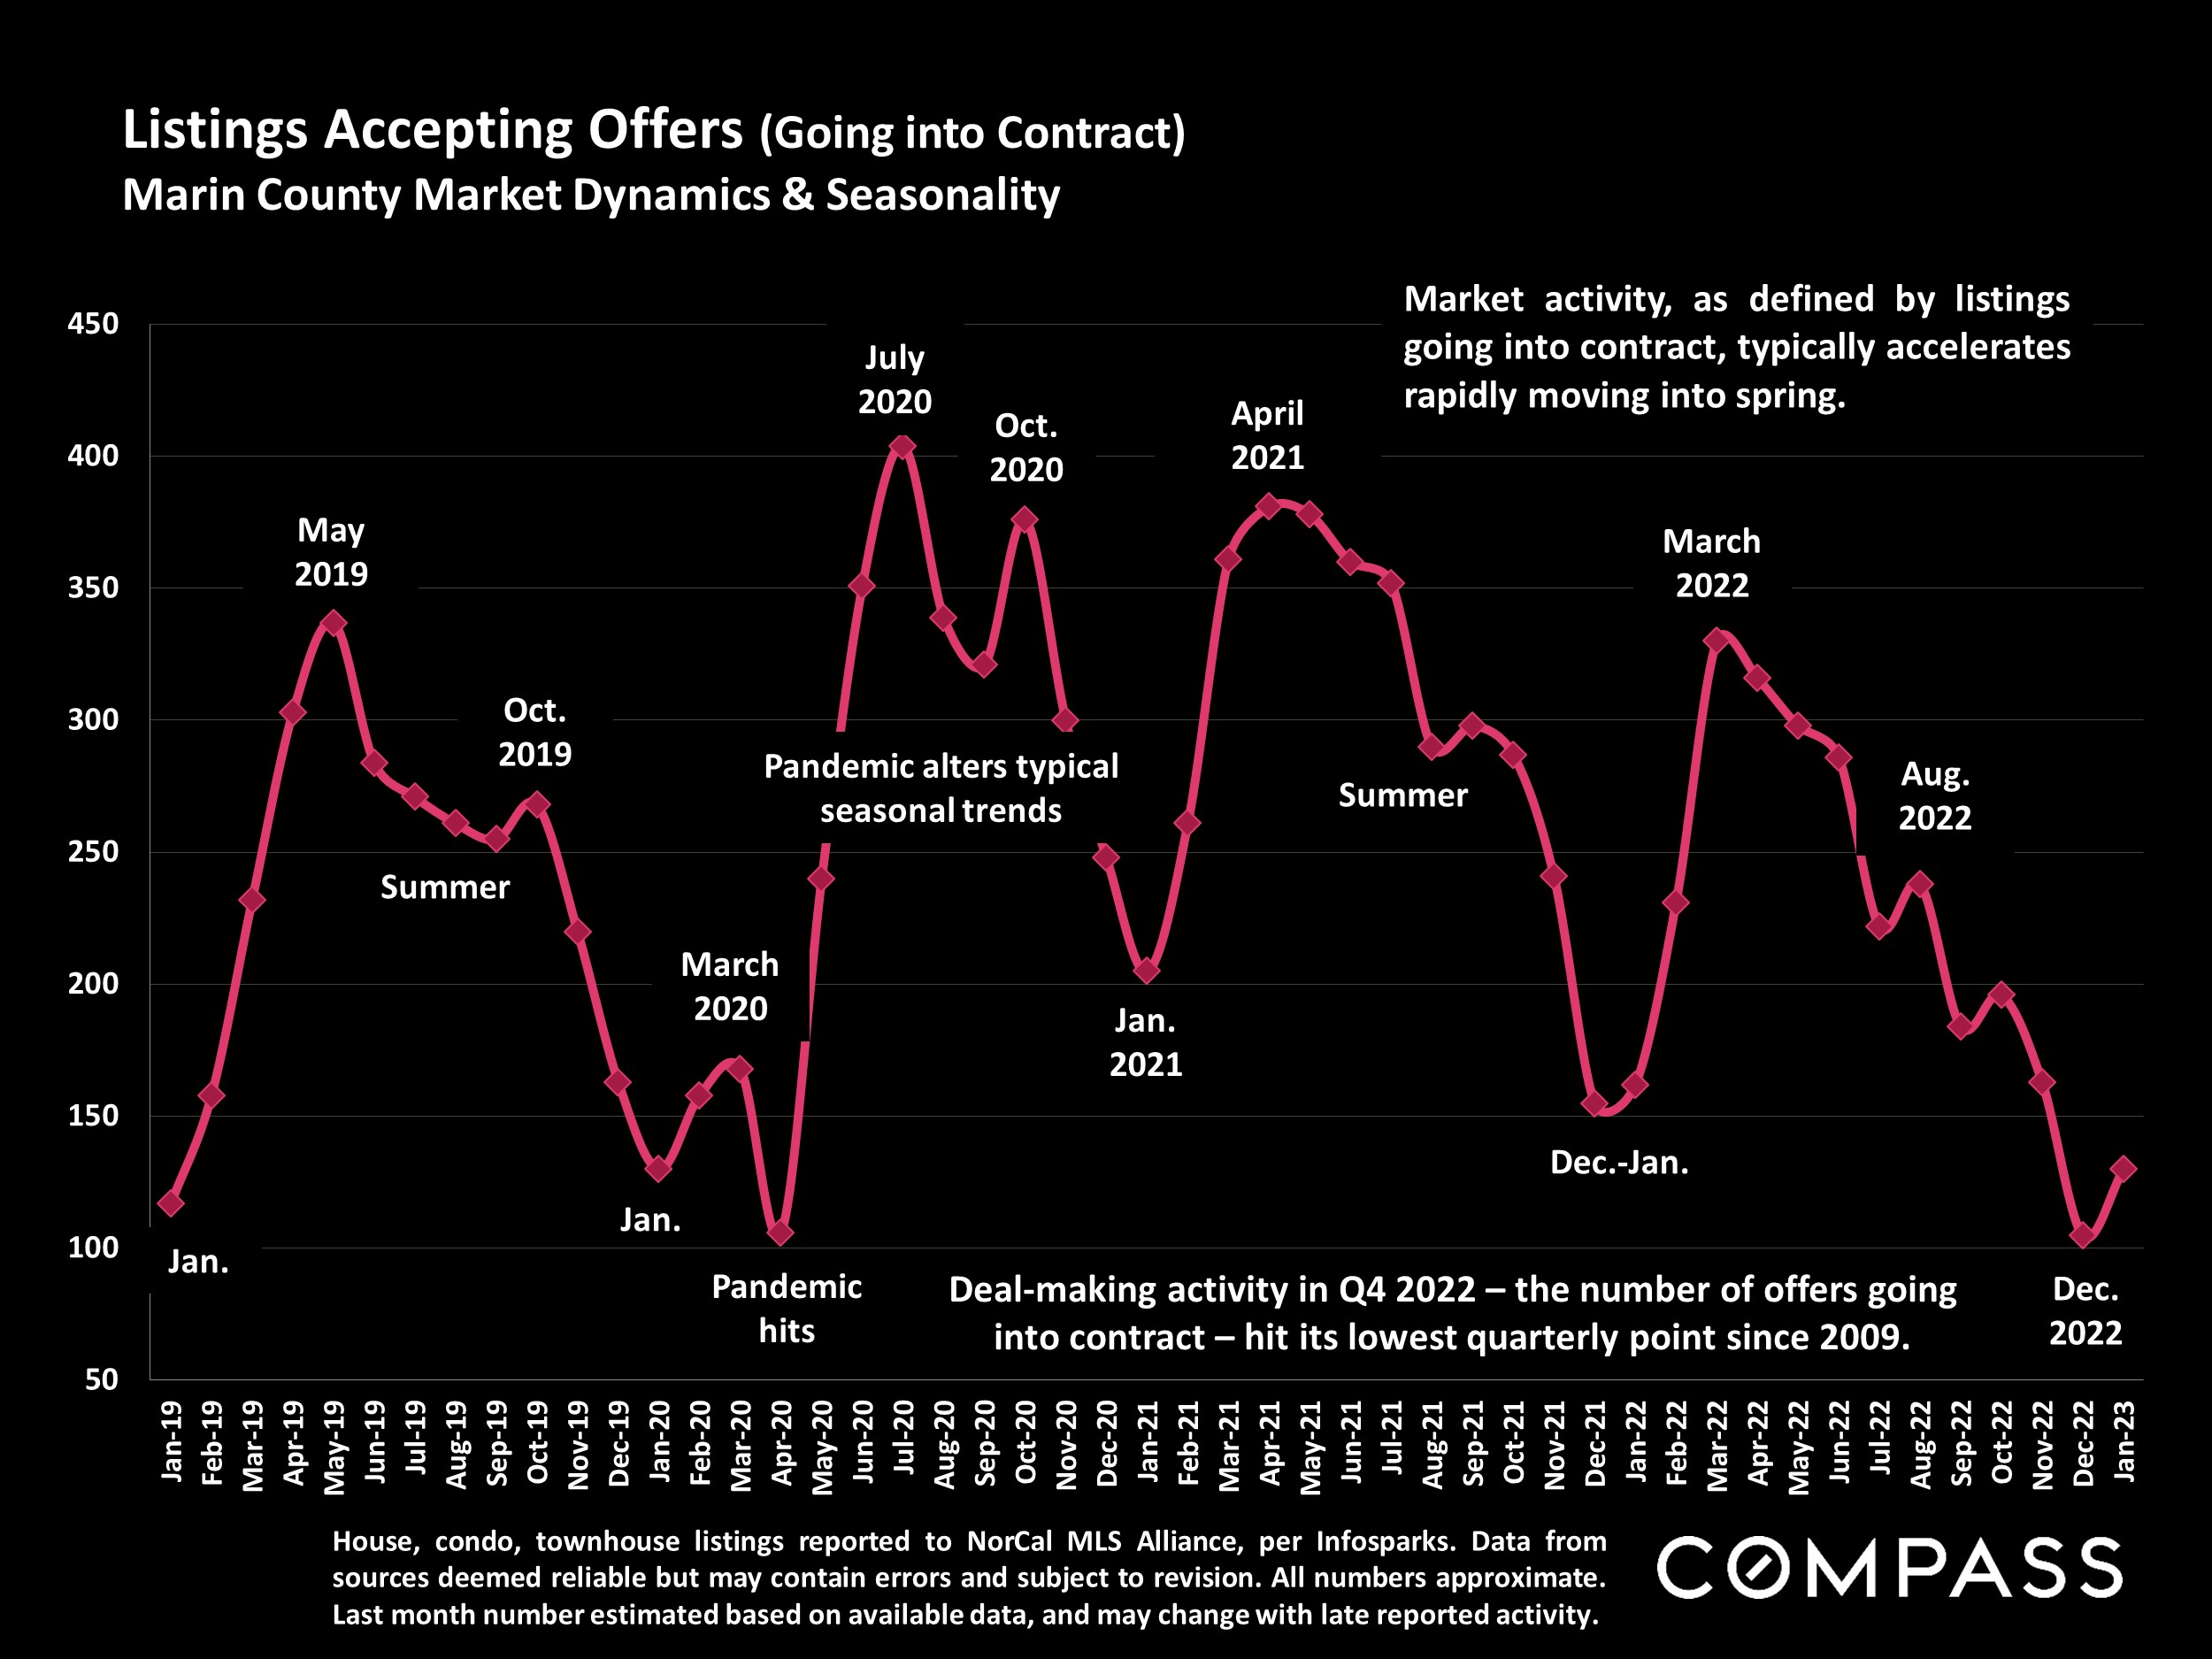
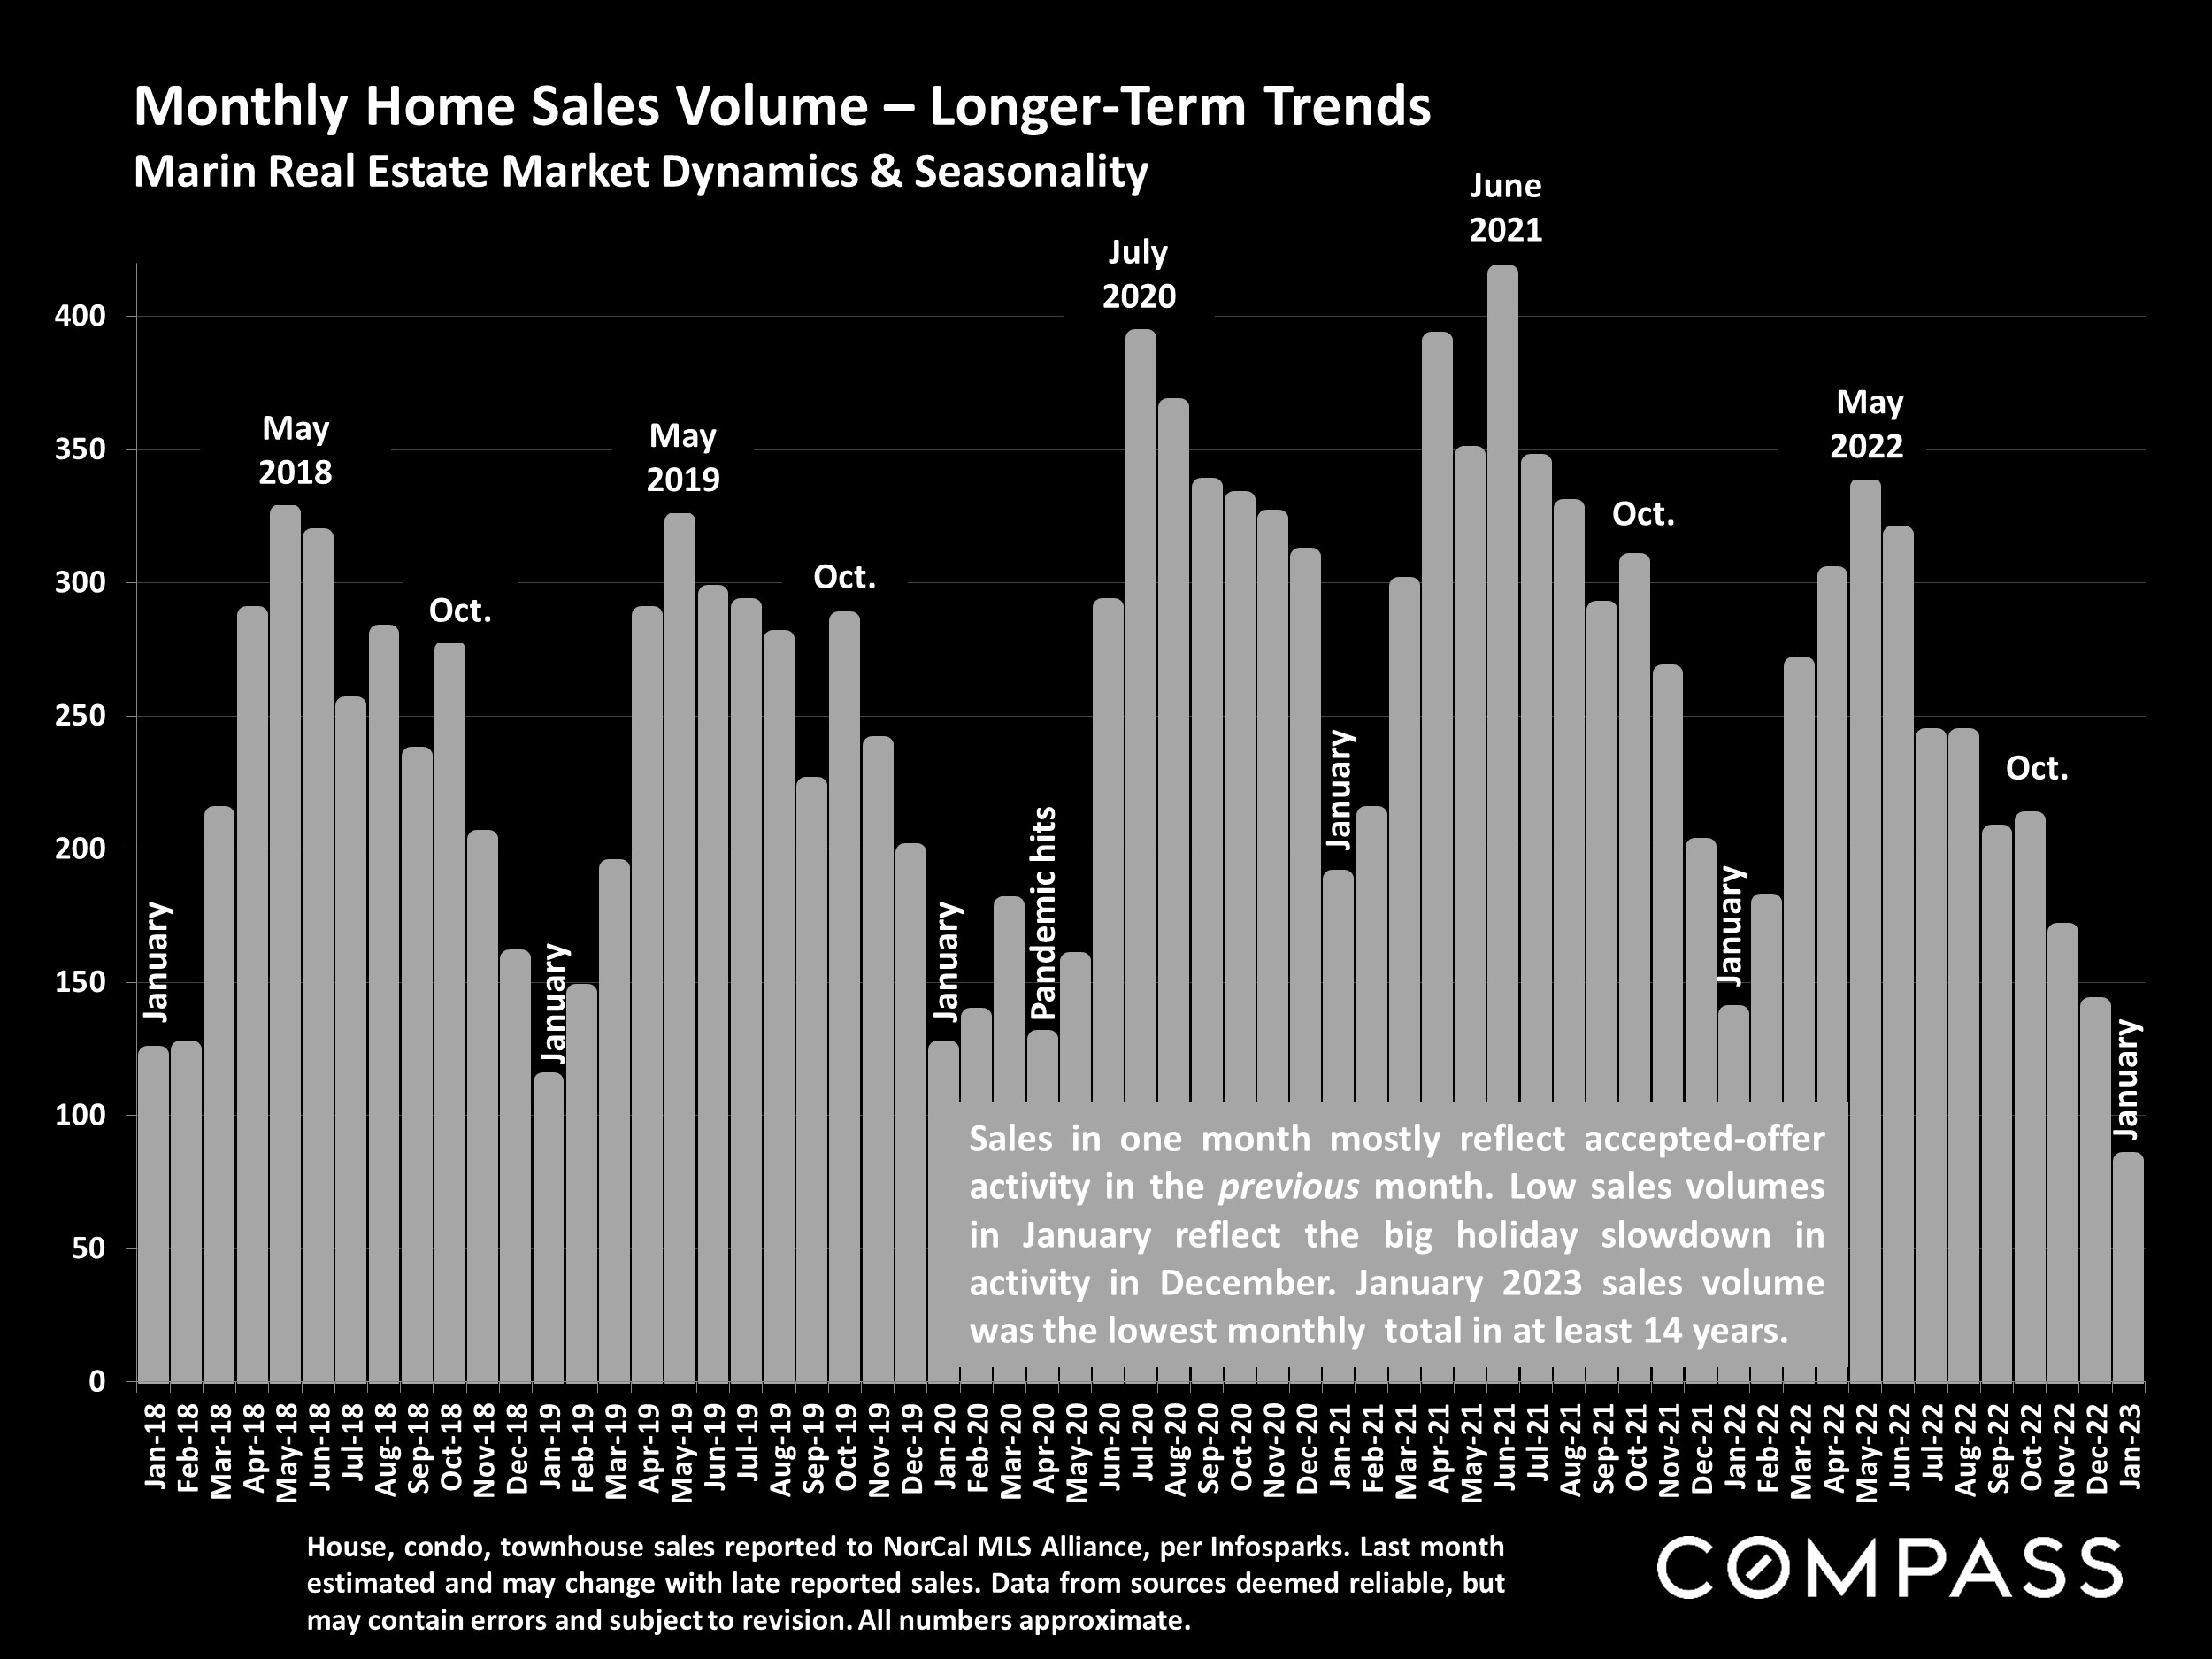
Historically December is the month that sees the year’s lowest level of deal-making activity – i.e. listings accepting offers (going into contract) – which leads to January usually posting the lowest monthly number of closed sales. (Sales typically close 3 to 6 weeks after going into contract.) In the 11-county, greater Bay Area, accepted-offer activity in December 2022 and closed sales volume in January 2023 generally hit their lowest monthly points in 14 to 15 years. (SF hit lower points in listings going into contract in January 2019 and, after the pandemic hit, in April 2020.)
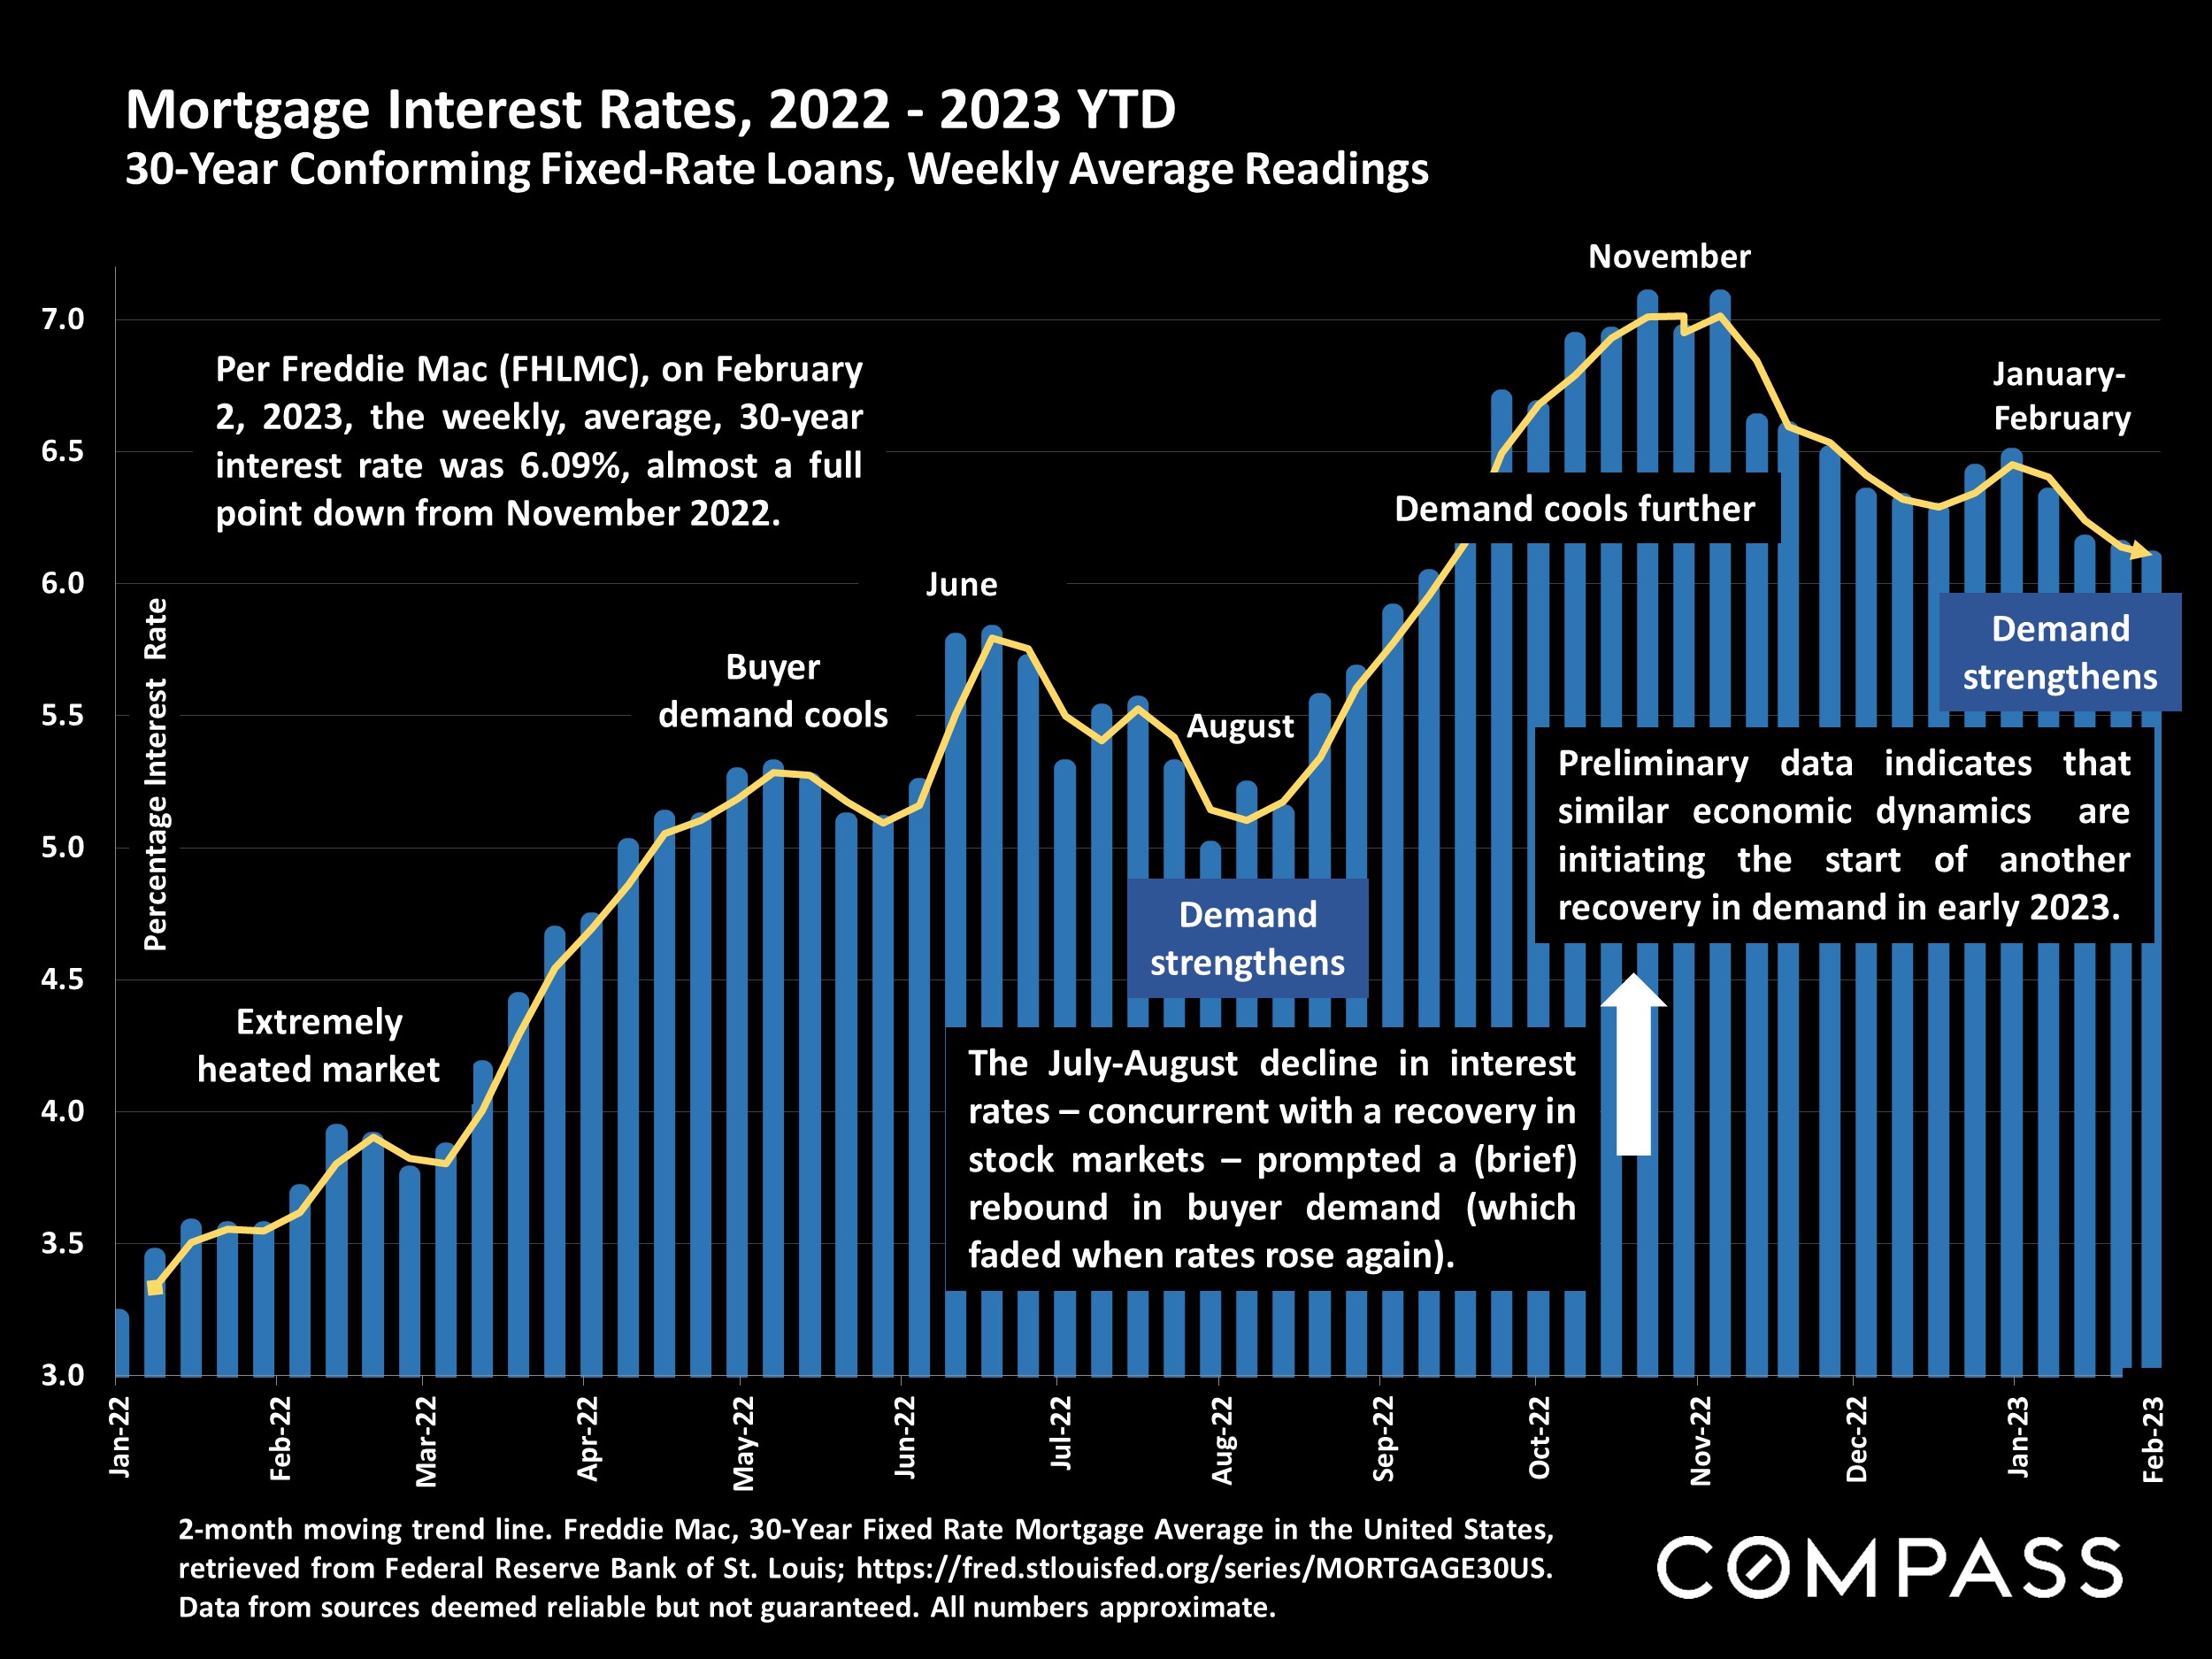
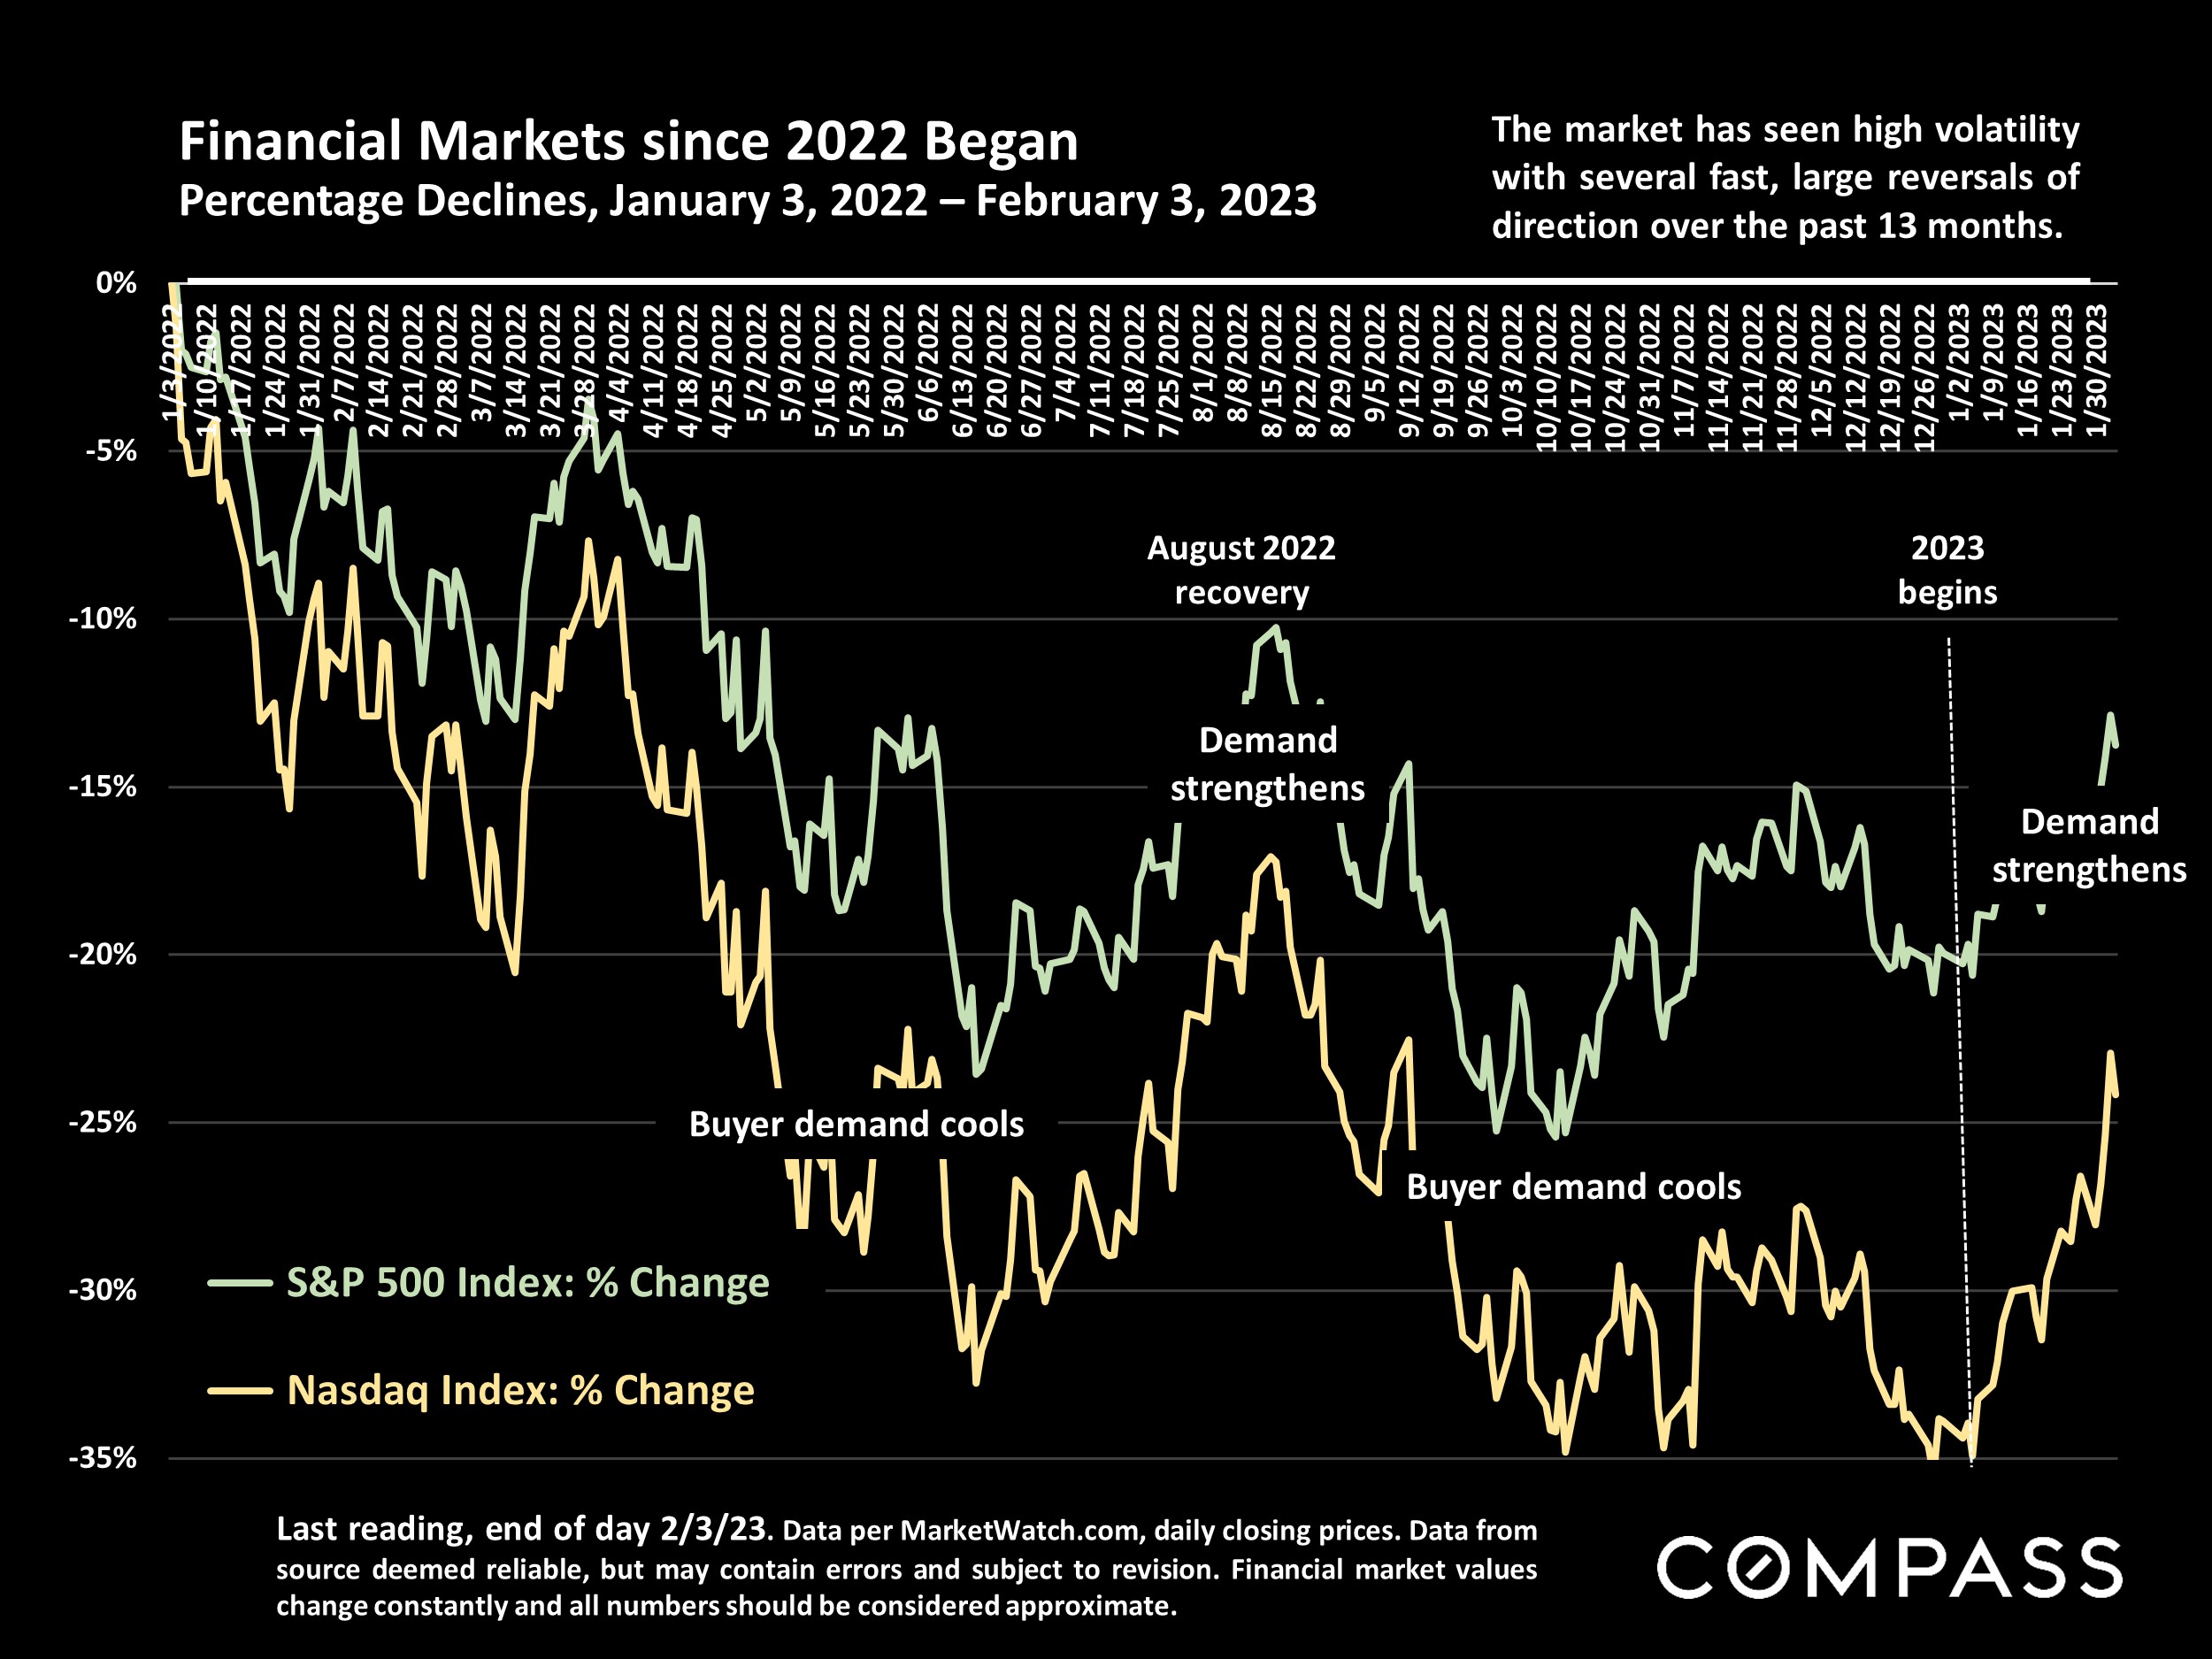
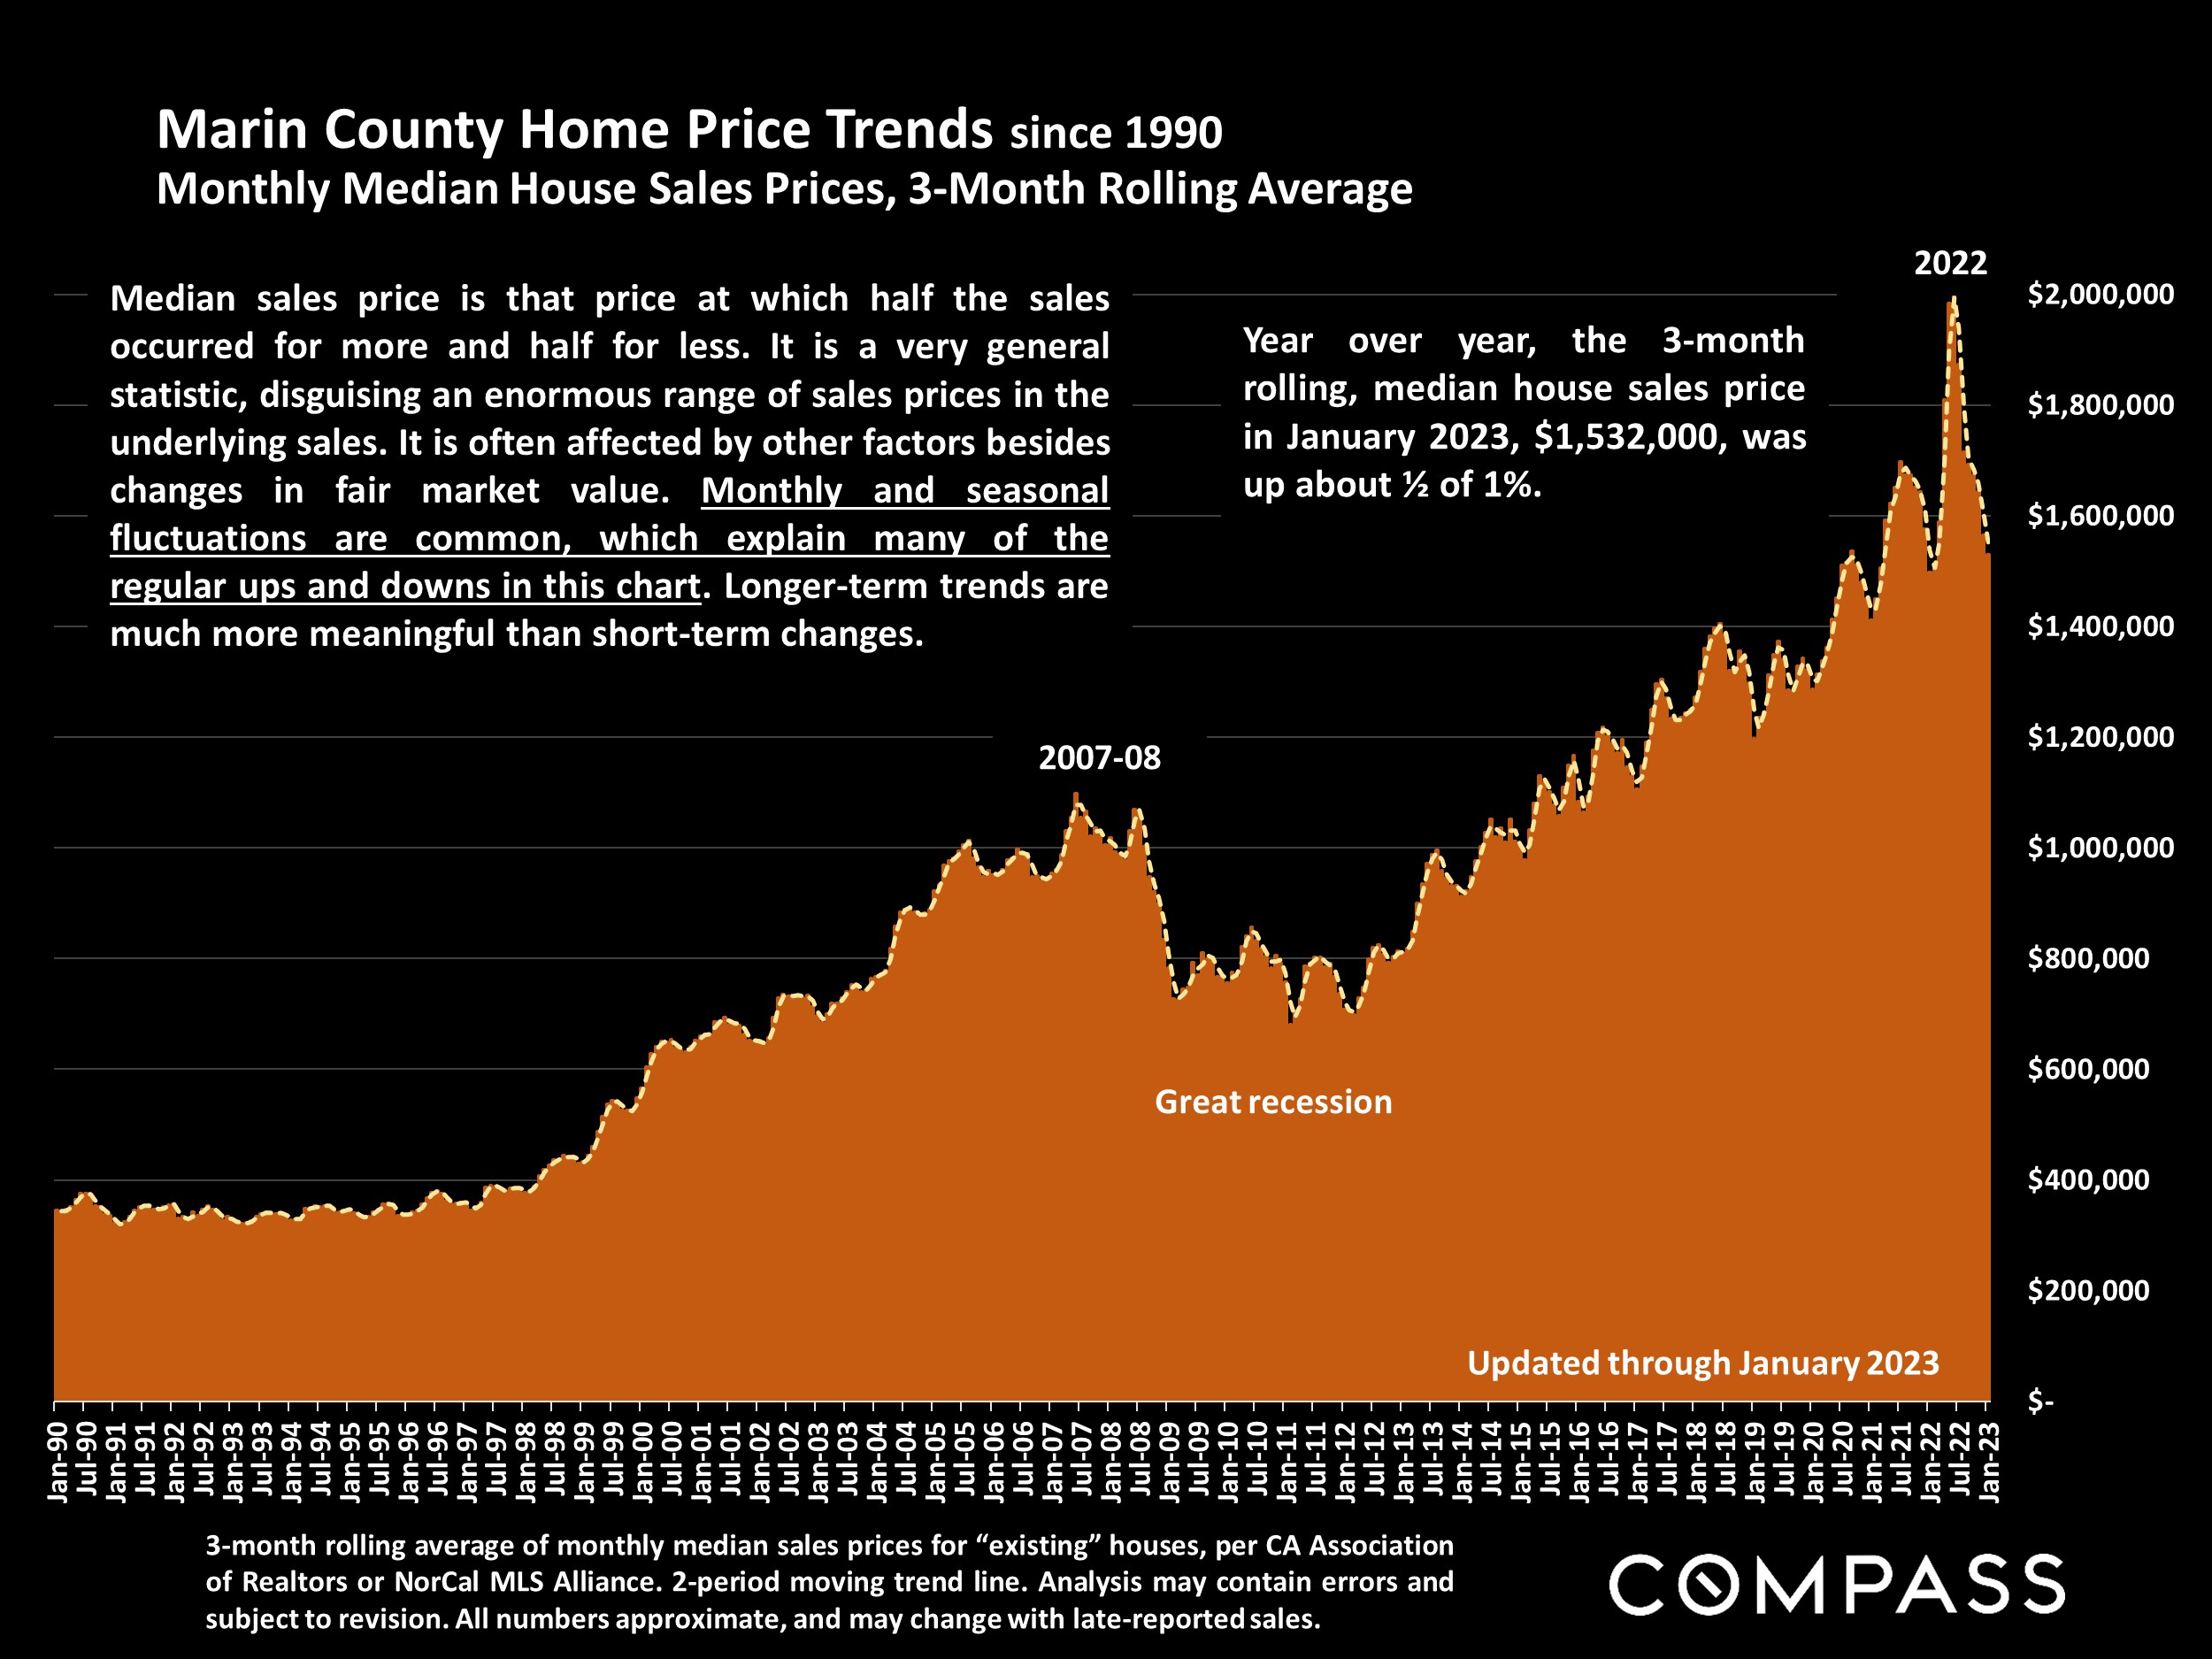
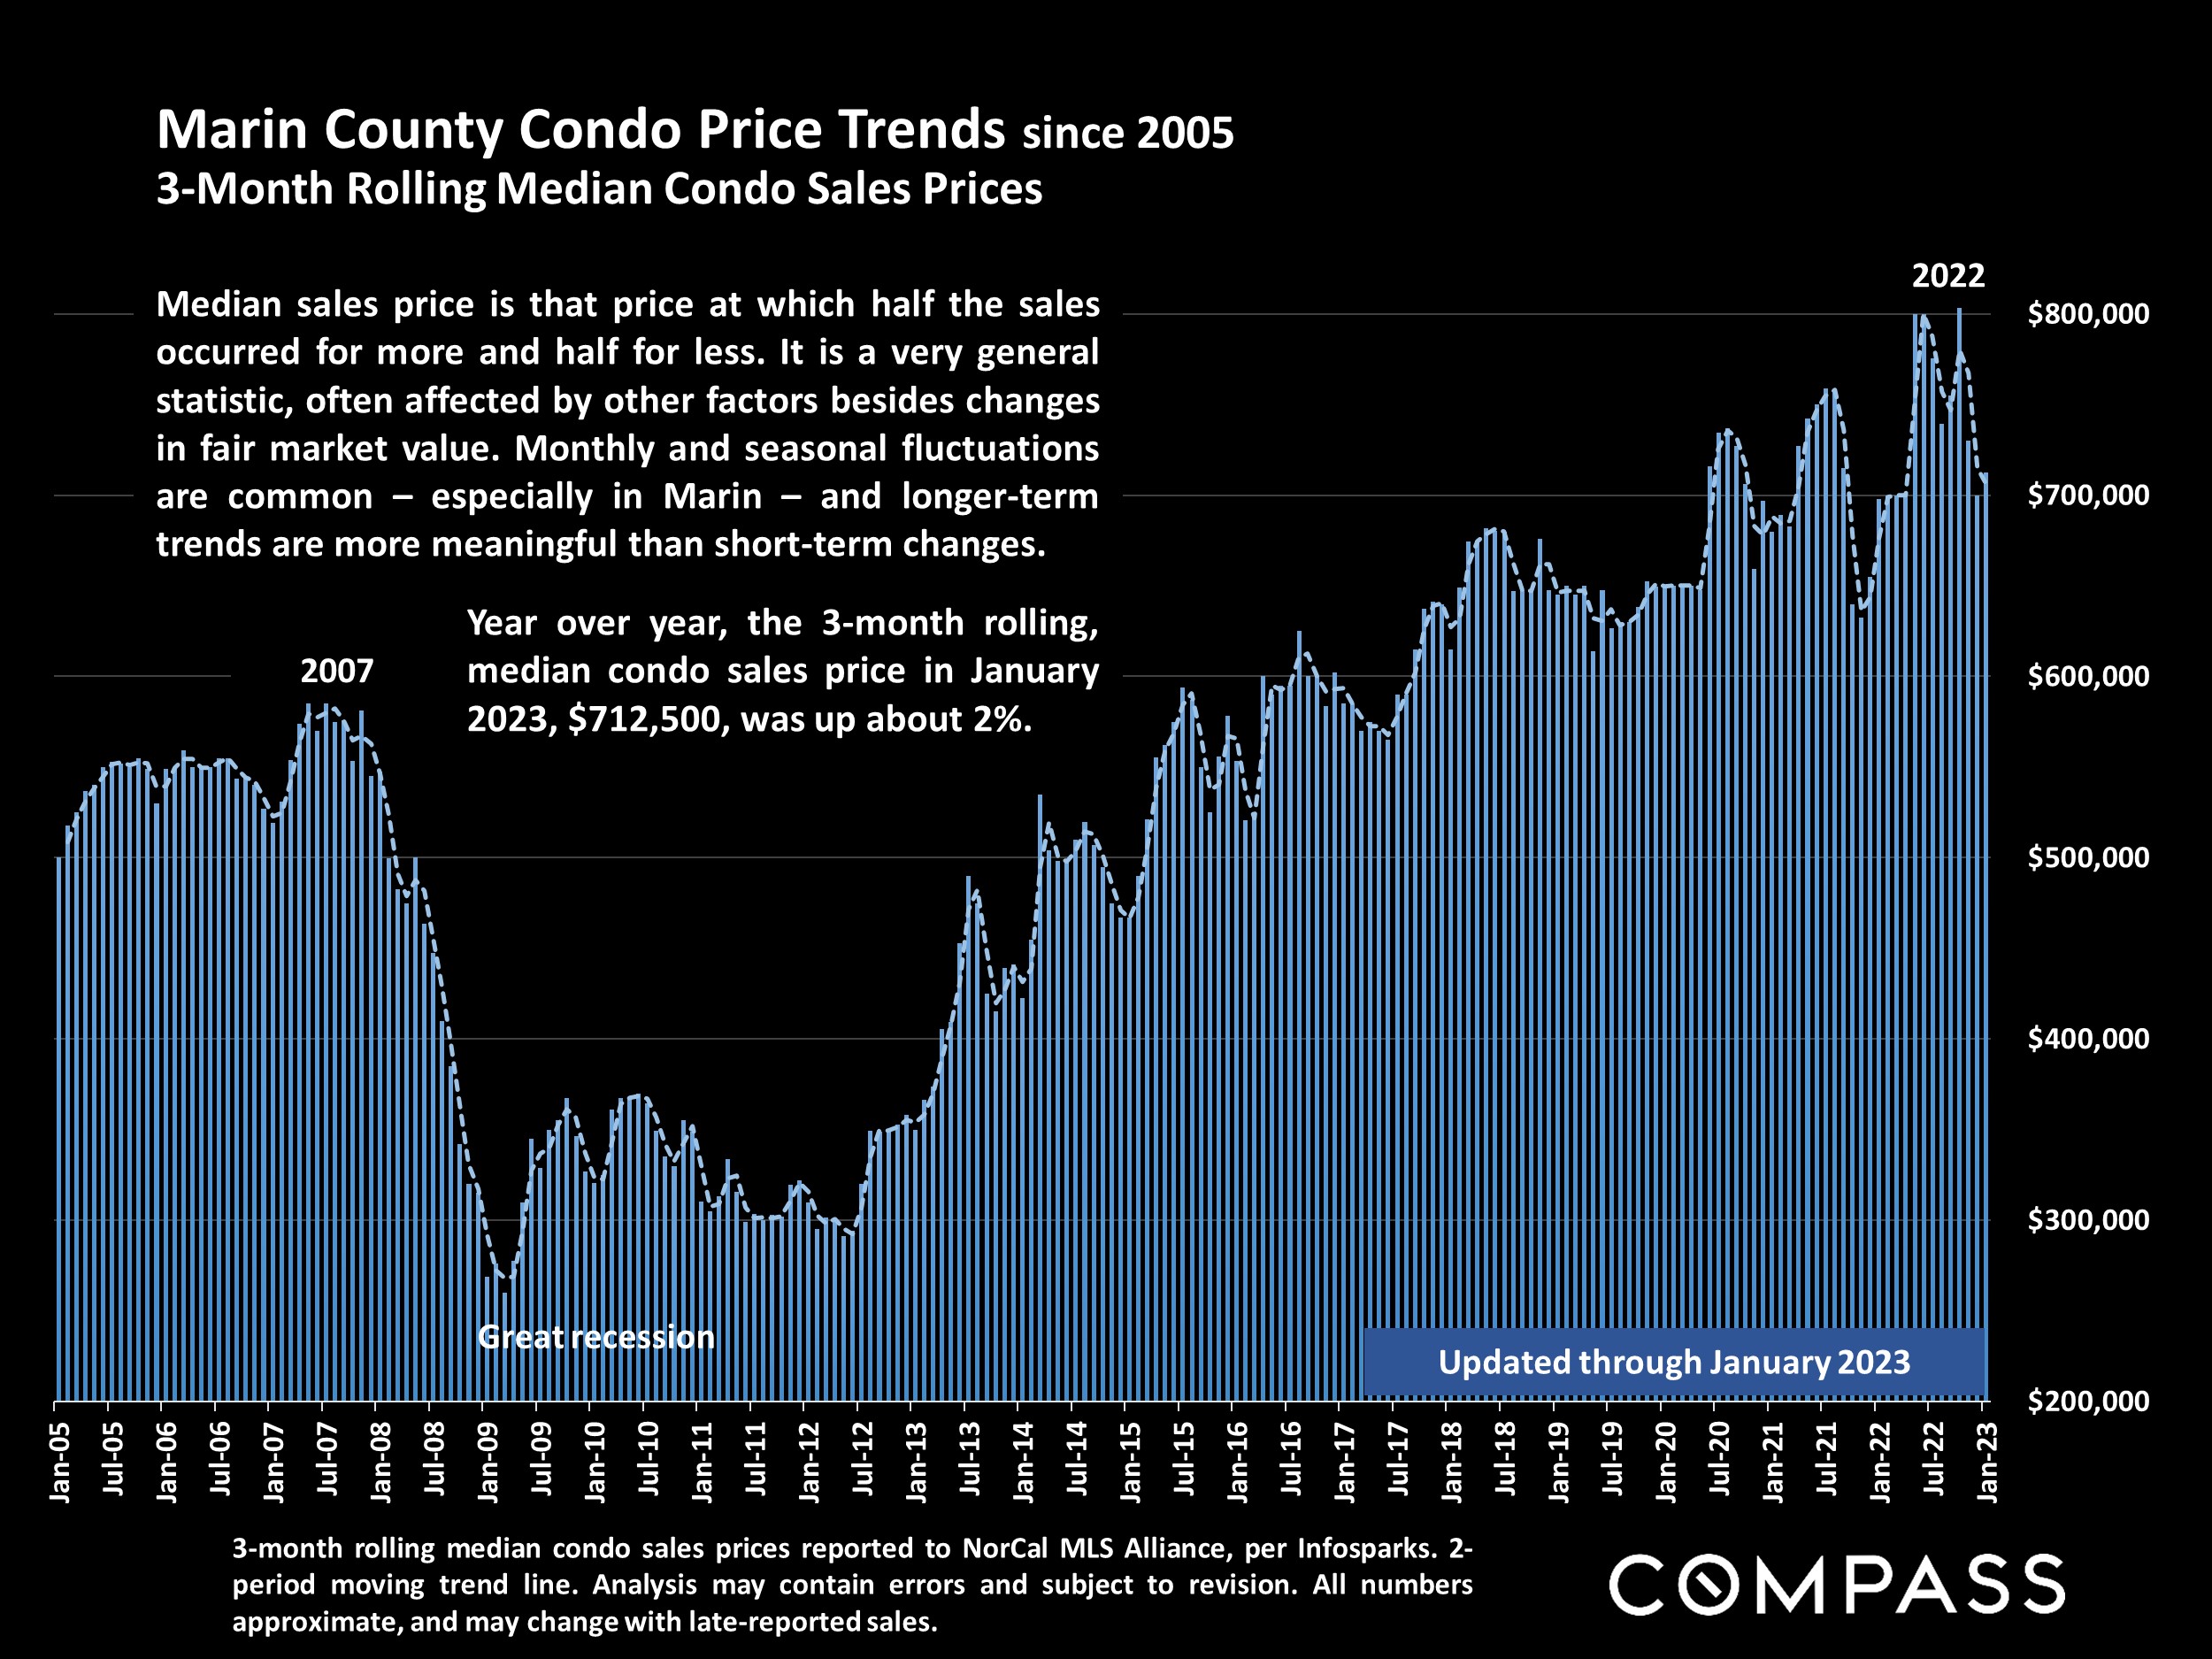
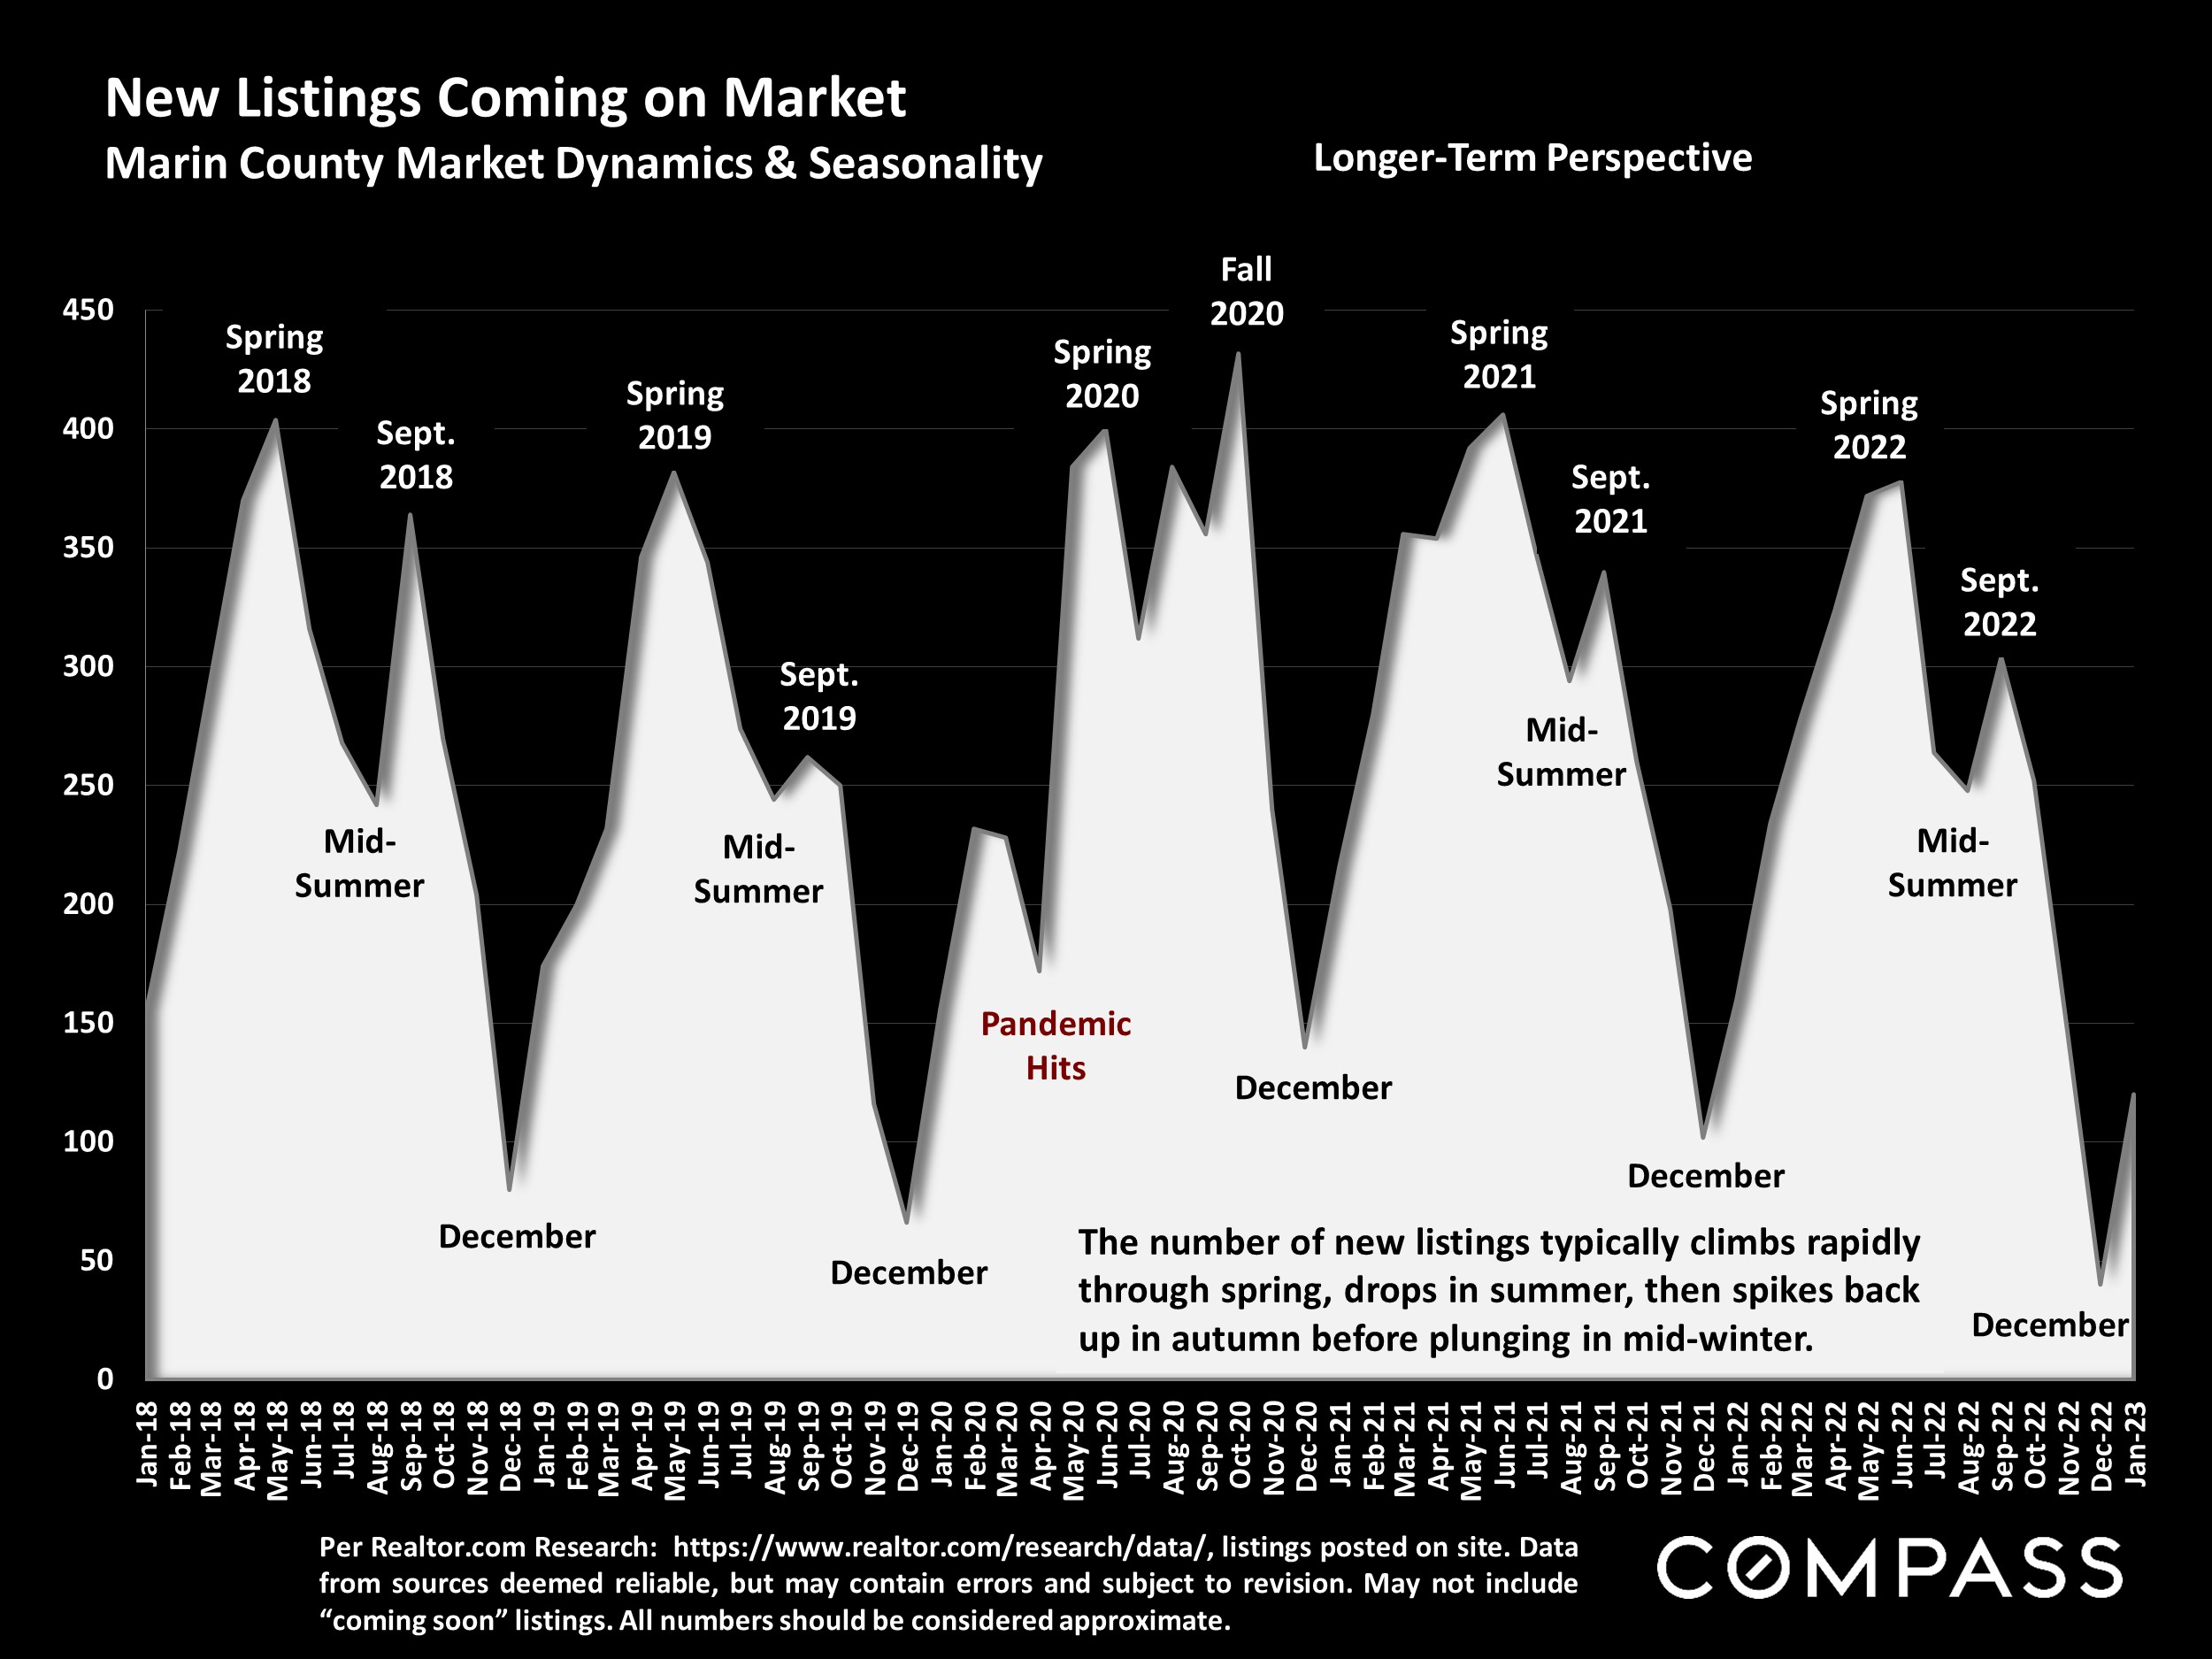
Typically, after the long holiday slowdown, the market just begins to wake up in mid-January before accelerating into the busiest spring market. That being said, inflation has dropped substantially since June and interest rates since November, home prices are well down from last spring, stock markets are up 8% (S&P) to 15% (Nasdaq) YTD as of 2/3/23 (albeit with continuing volatility), and despite escalating layoffs in high tech, early indications in 2023 point to rebounding buyer demand. Open house traffic has jumped, more buyers are requesting listing disclosure packages, and there have been increasing reports of multiple offers and (often unexpected) overbidding of the asking price. Based on this preliminary data (much of it still anecdotal*), buyer demand severely repressed by economic conditions in the 2nd half of 2022 has begun to bounce back.
A similar rebound began in mid-late summer 2022 for similar reasons – a significant drop in mortgage rates and a large rise in stock markets – which quickly faded when positive economic developments reversed. Market activity then slowed further through the rest of 2022. There are currently considerable hopes for a more lasting economic recovery in 2023.
Want to learn more about Bay Area market trends?
Let’s connect! With relationships and networks across the city, there are a variety of ways I can help you make informed real estate decisions. Call, email, or text – I’m here to help.
Contact