Feature image for Marin: February 2025 Market Stats

February 13, 2025

Marin: February 2025 Market Stats

By Compass

A New Year Begins

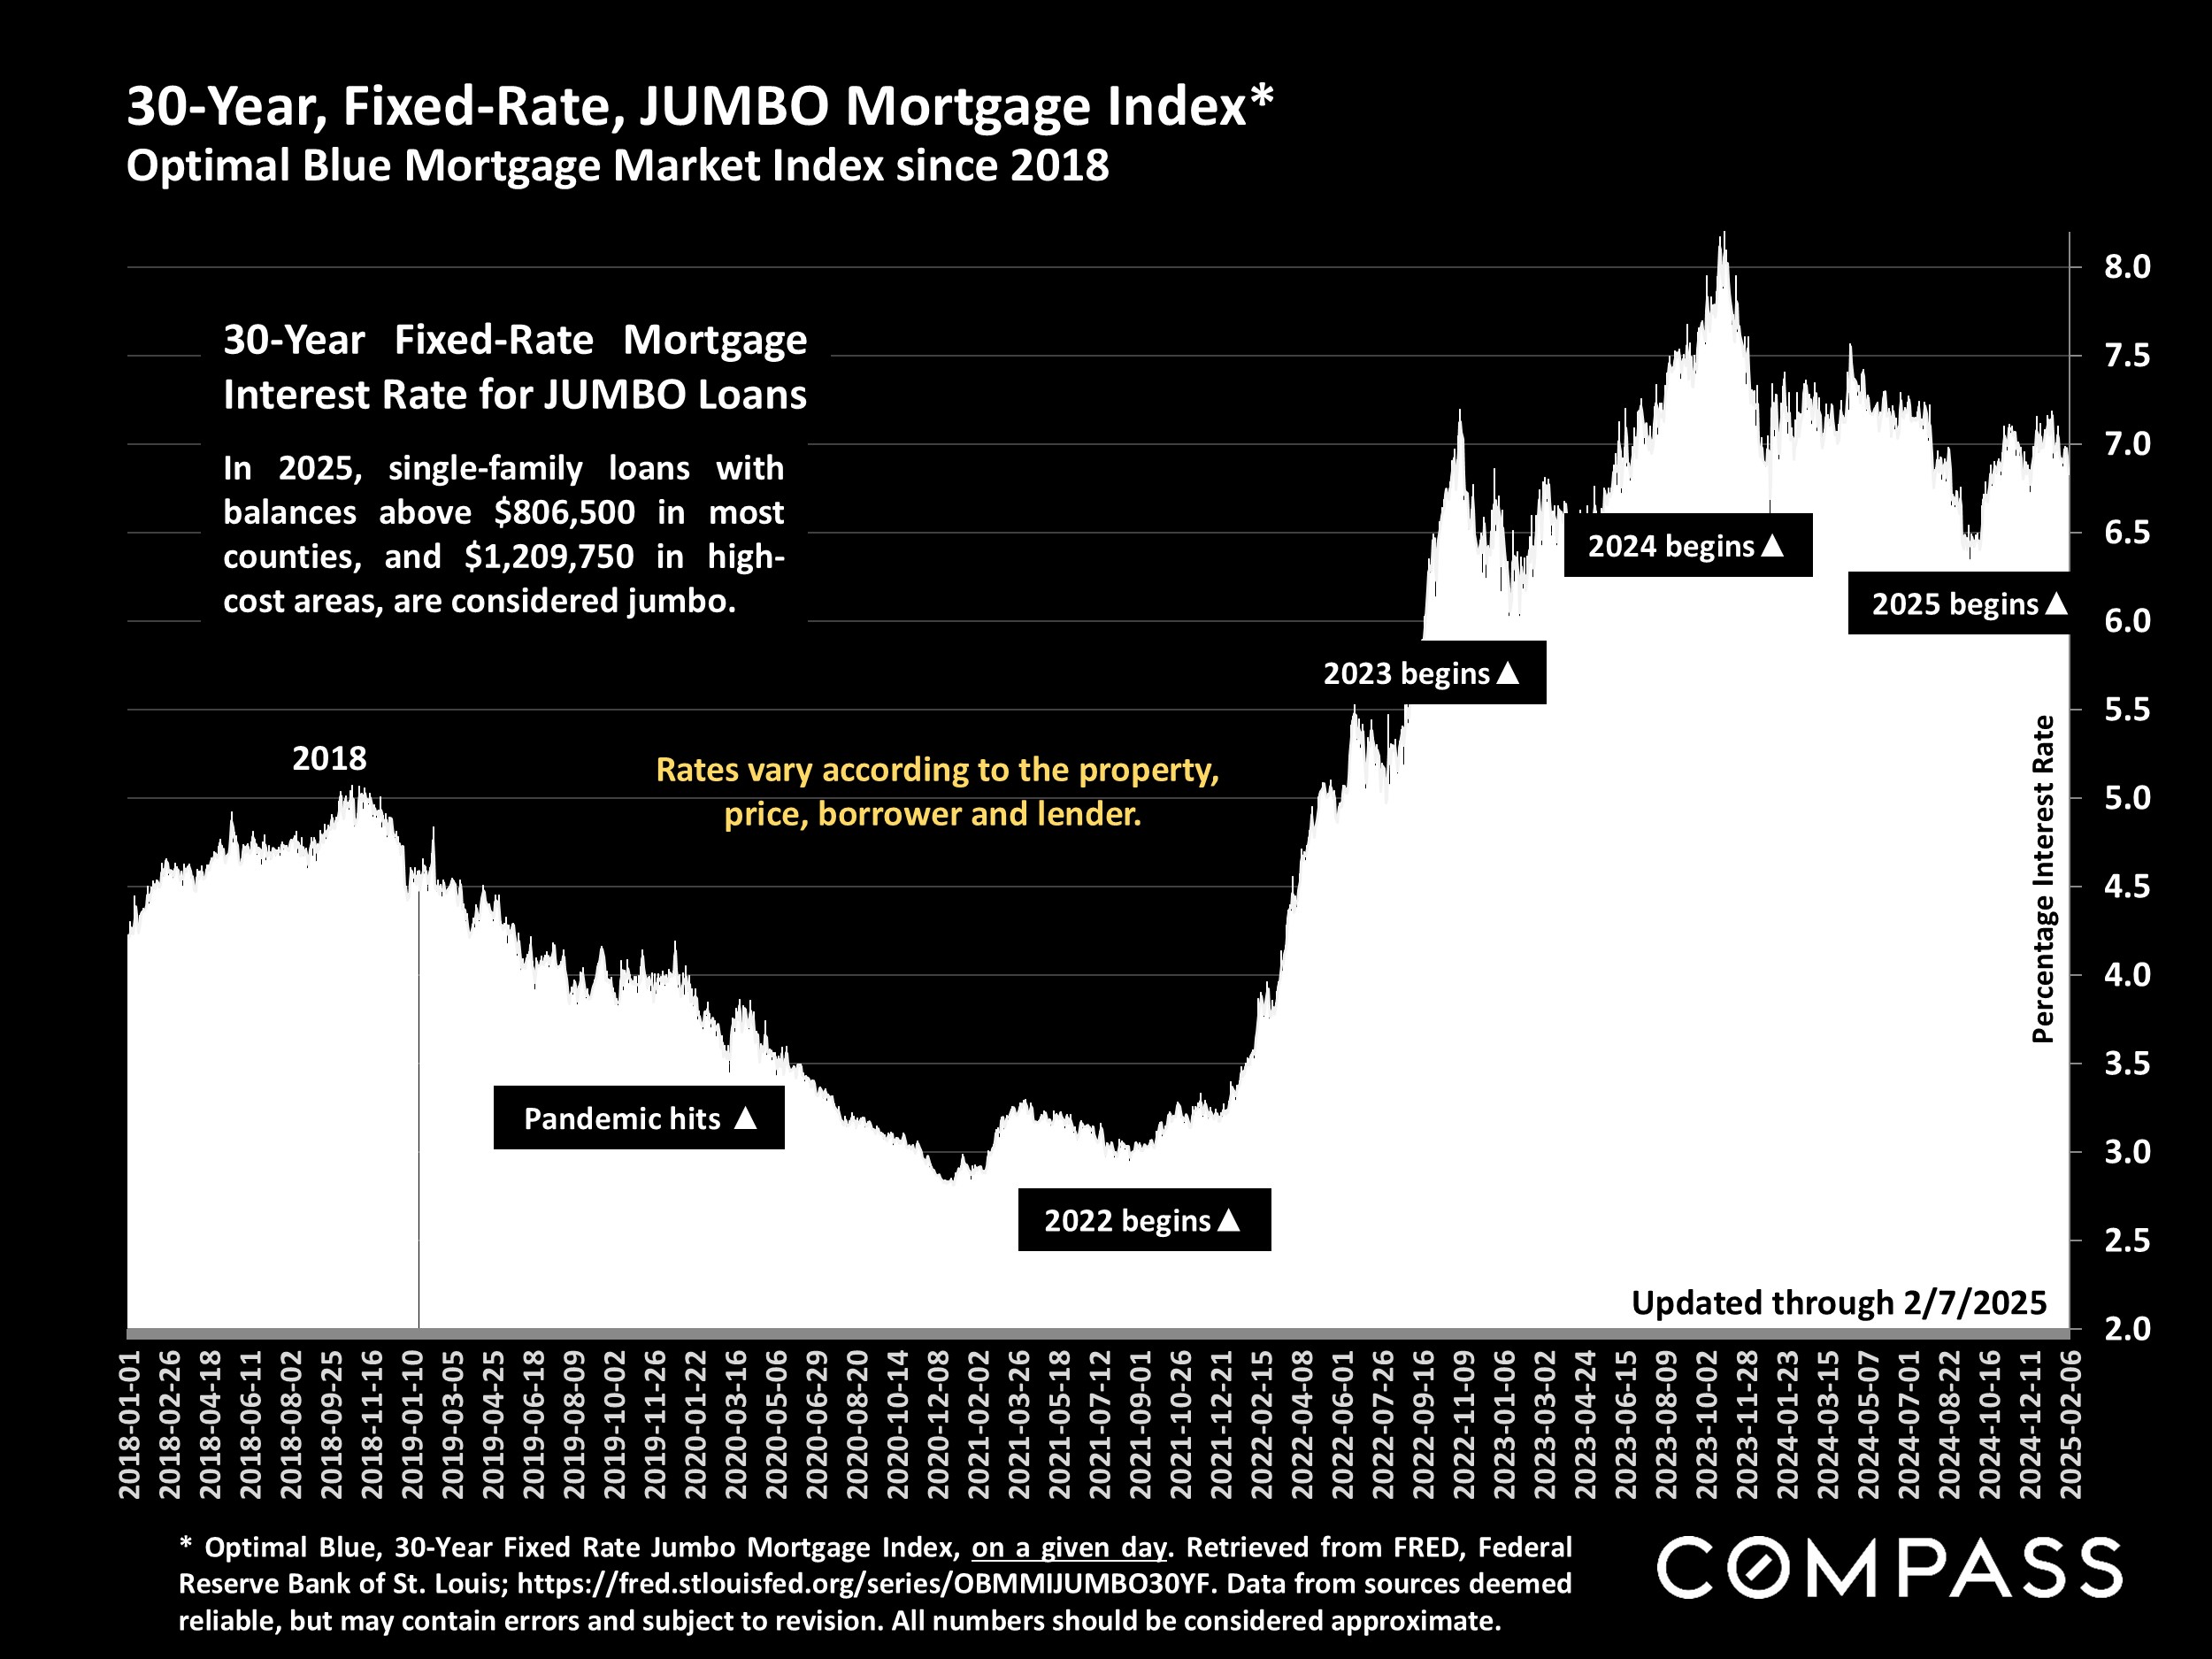
The Fed kept its benchmark rate unchanged; interest rates ticked down below 7%; stock markets remain high (though sometimes volatile); consumer confidence turned a bit unsure about the future. A terrible climate-related disaster rocked the state, with human and financial costs and consequences that will take years to quantify. And for better or worse - you can make your own evaluation - national and international politics have been thoroughly destabilized by new and constantly changing developments, with yet uncertain effects on society, the economy and housing markets.

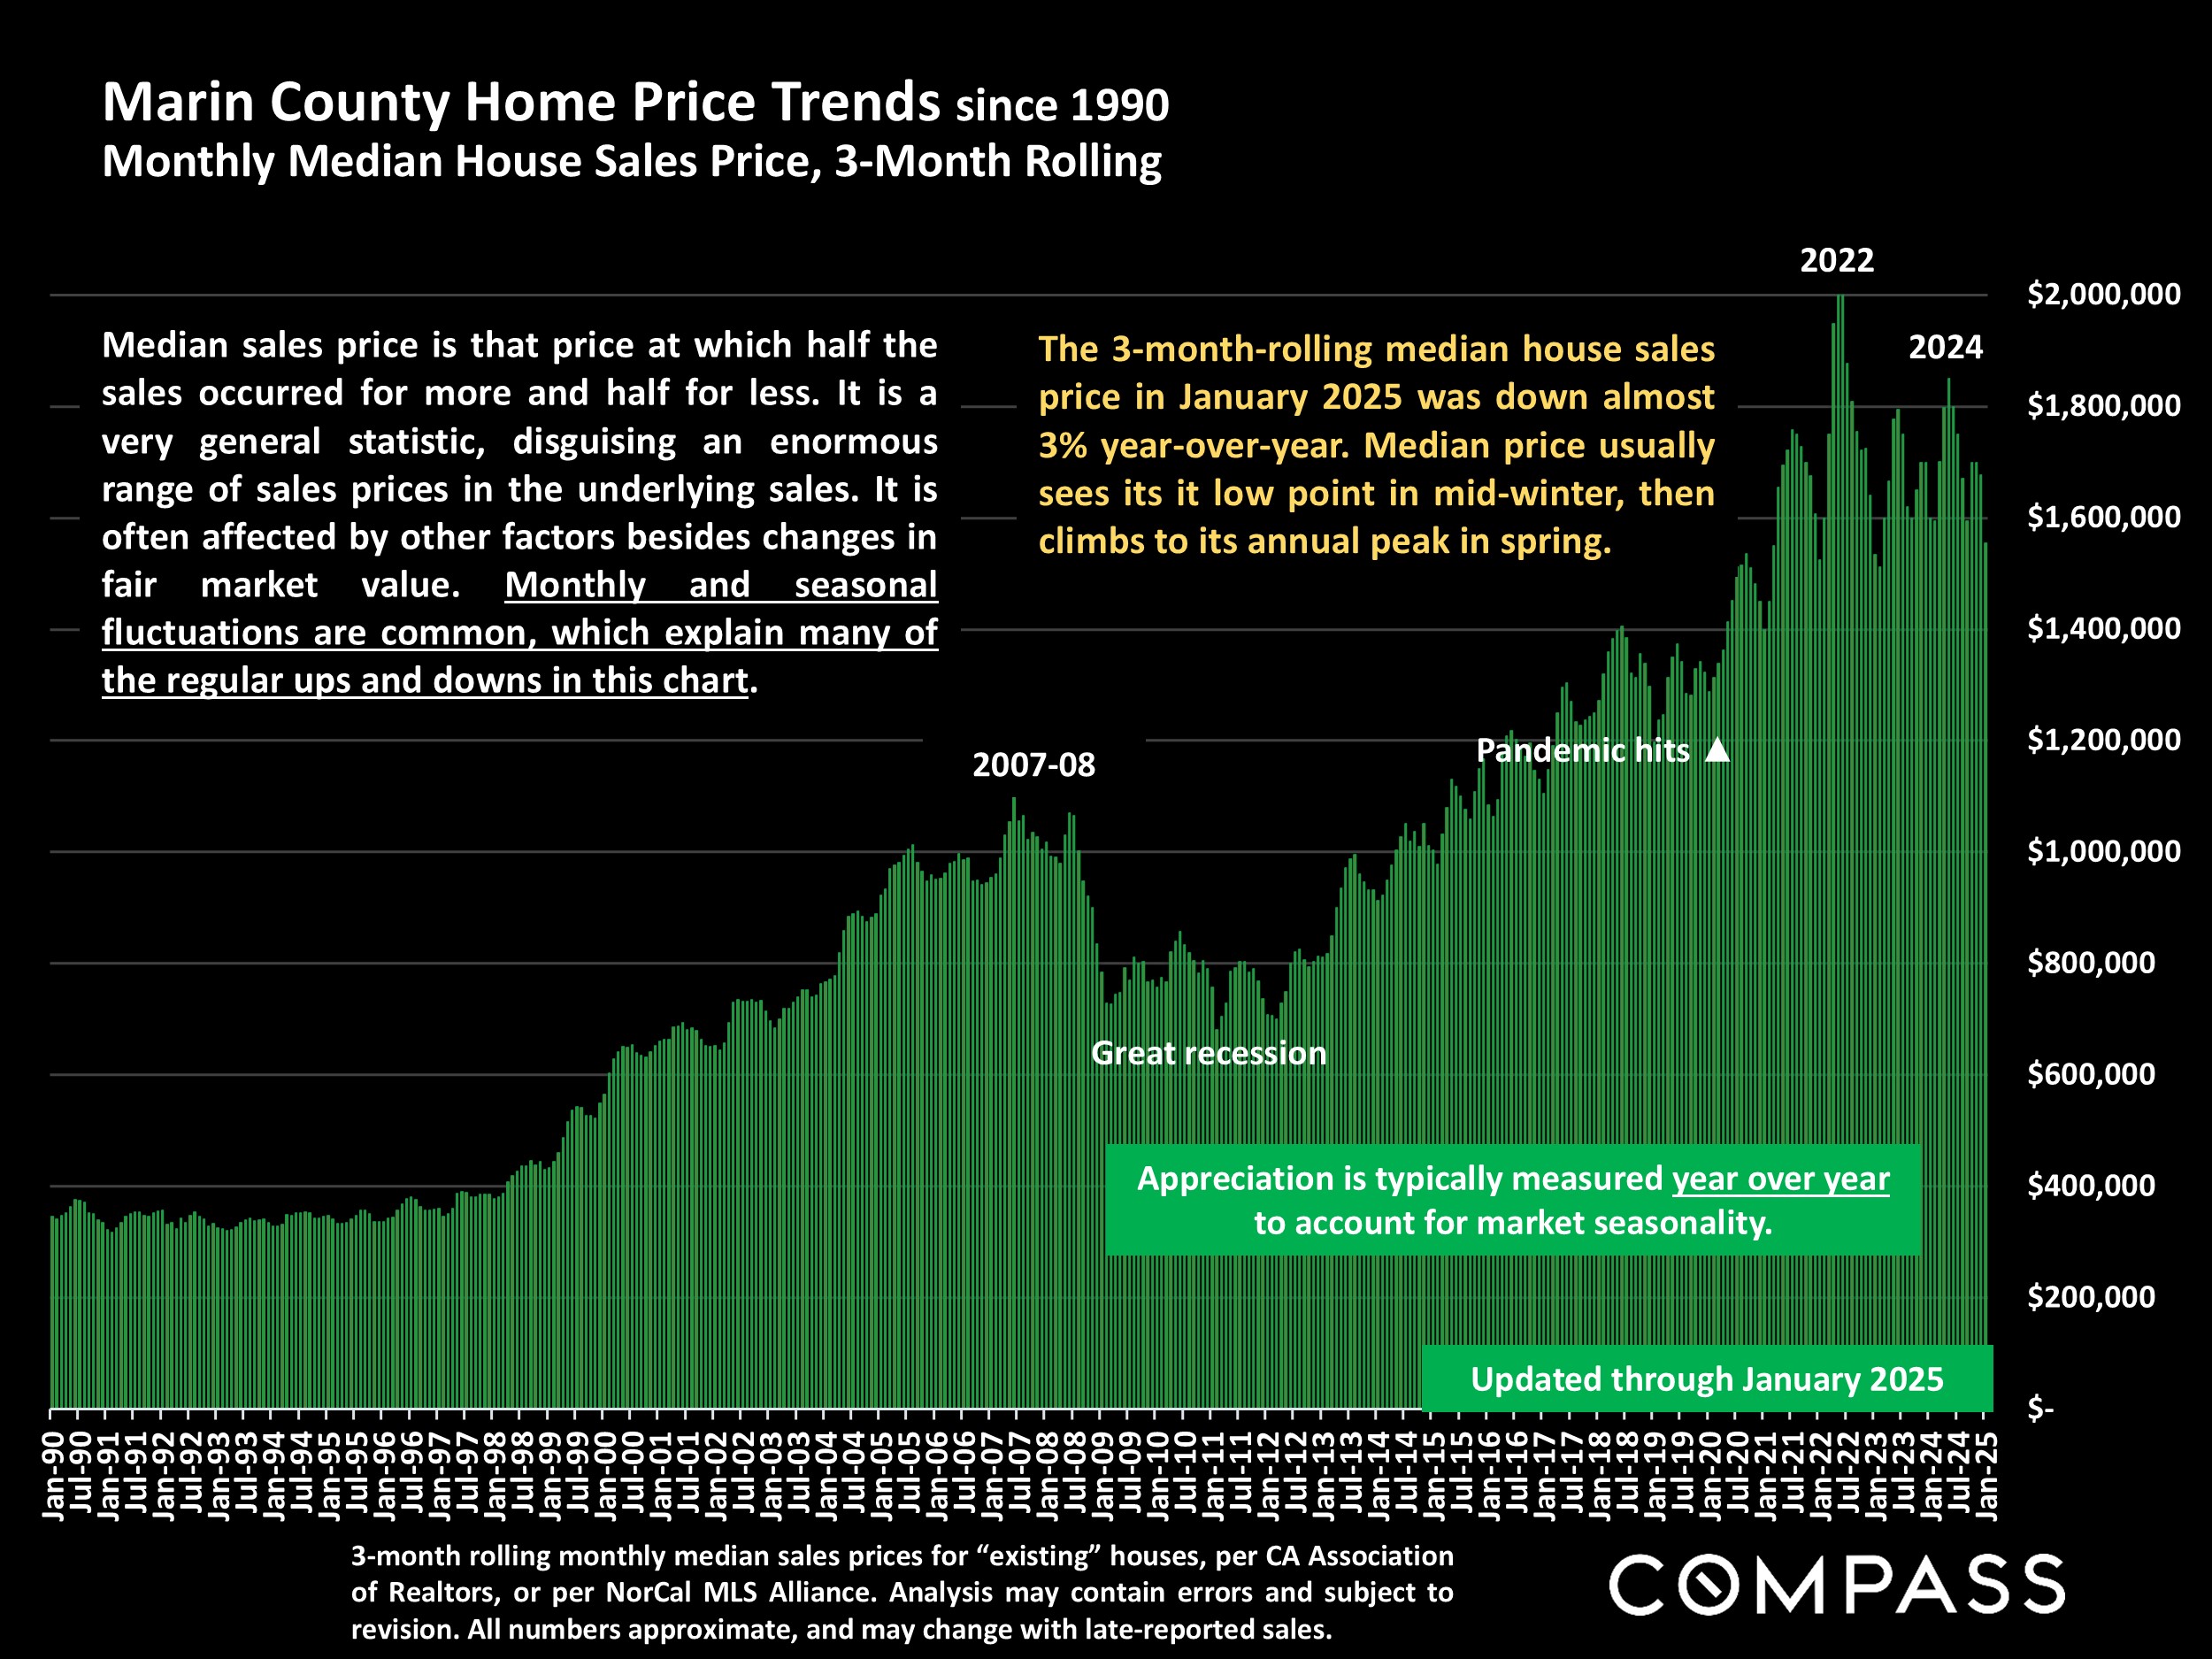
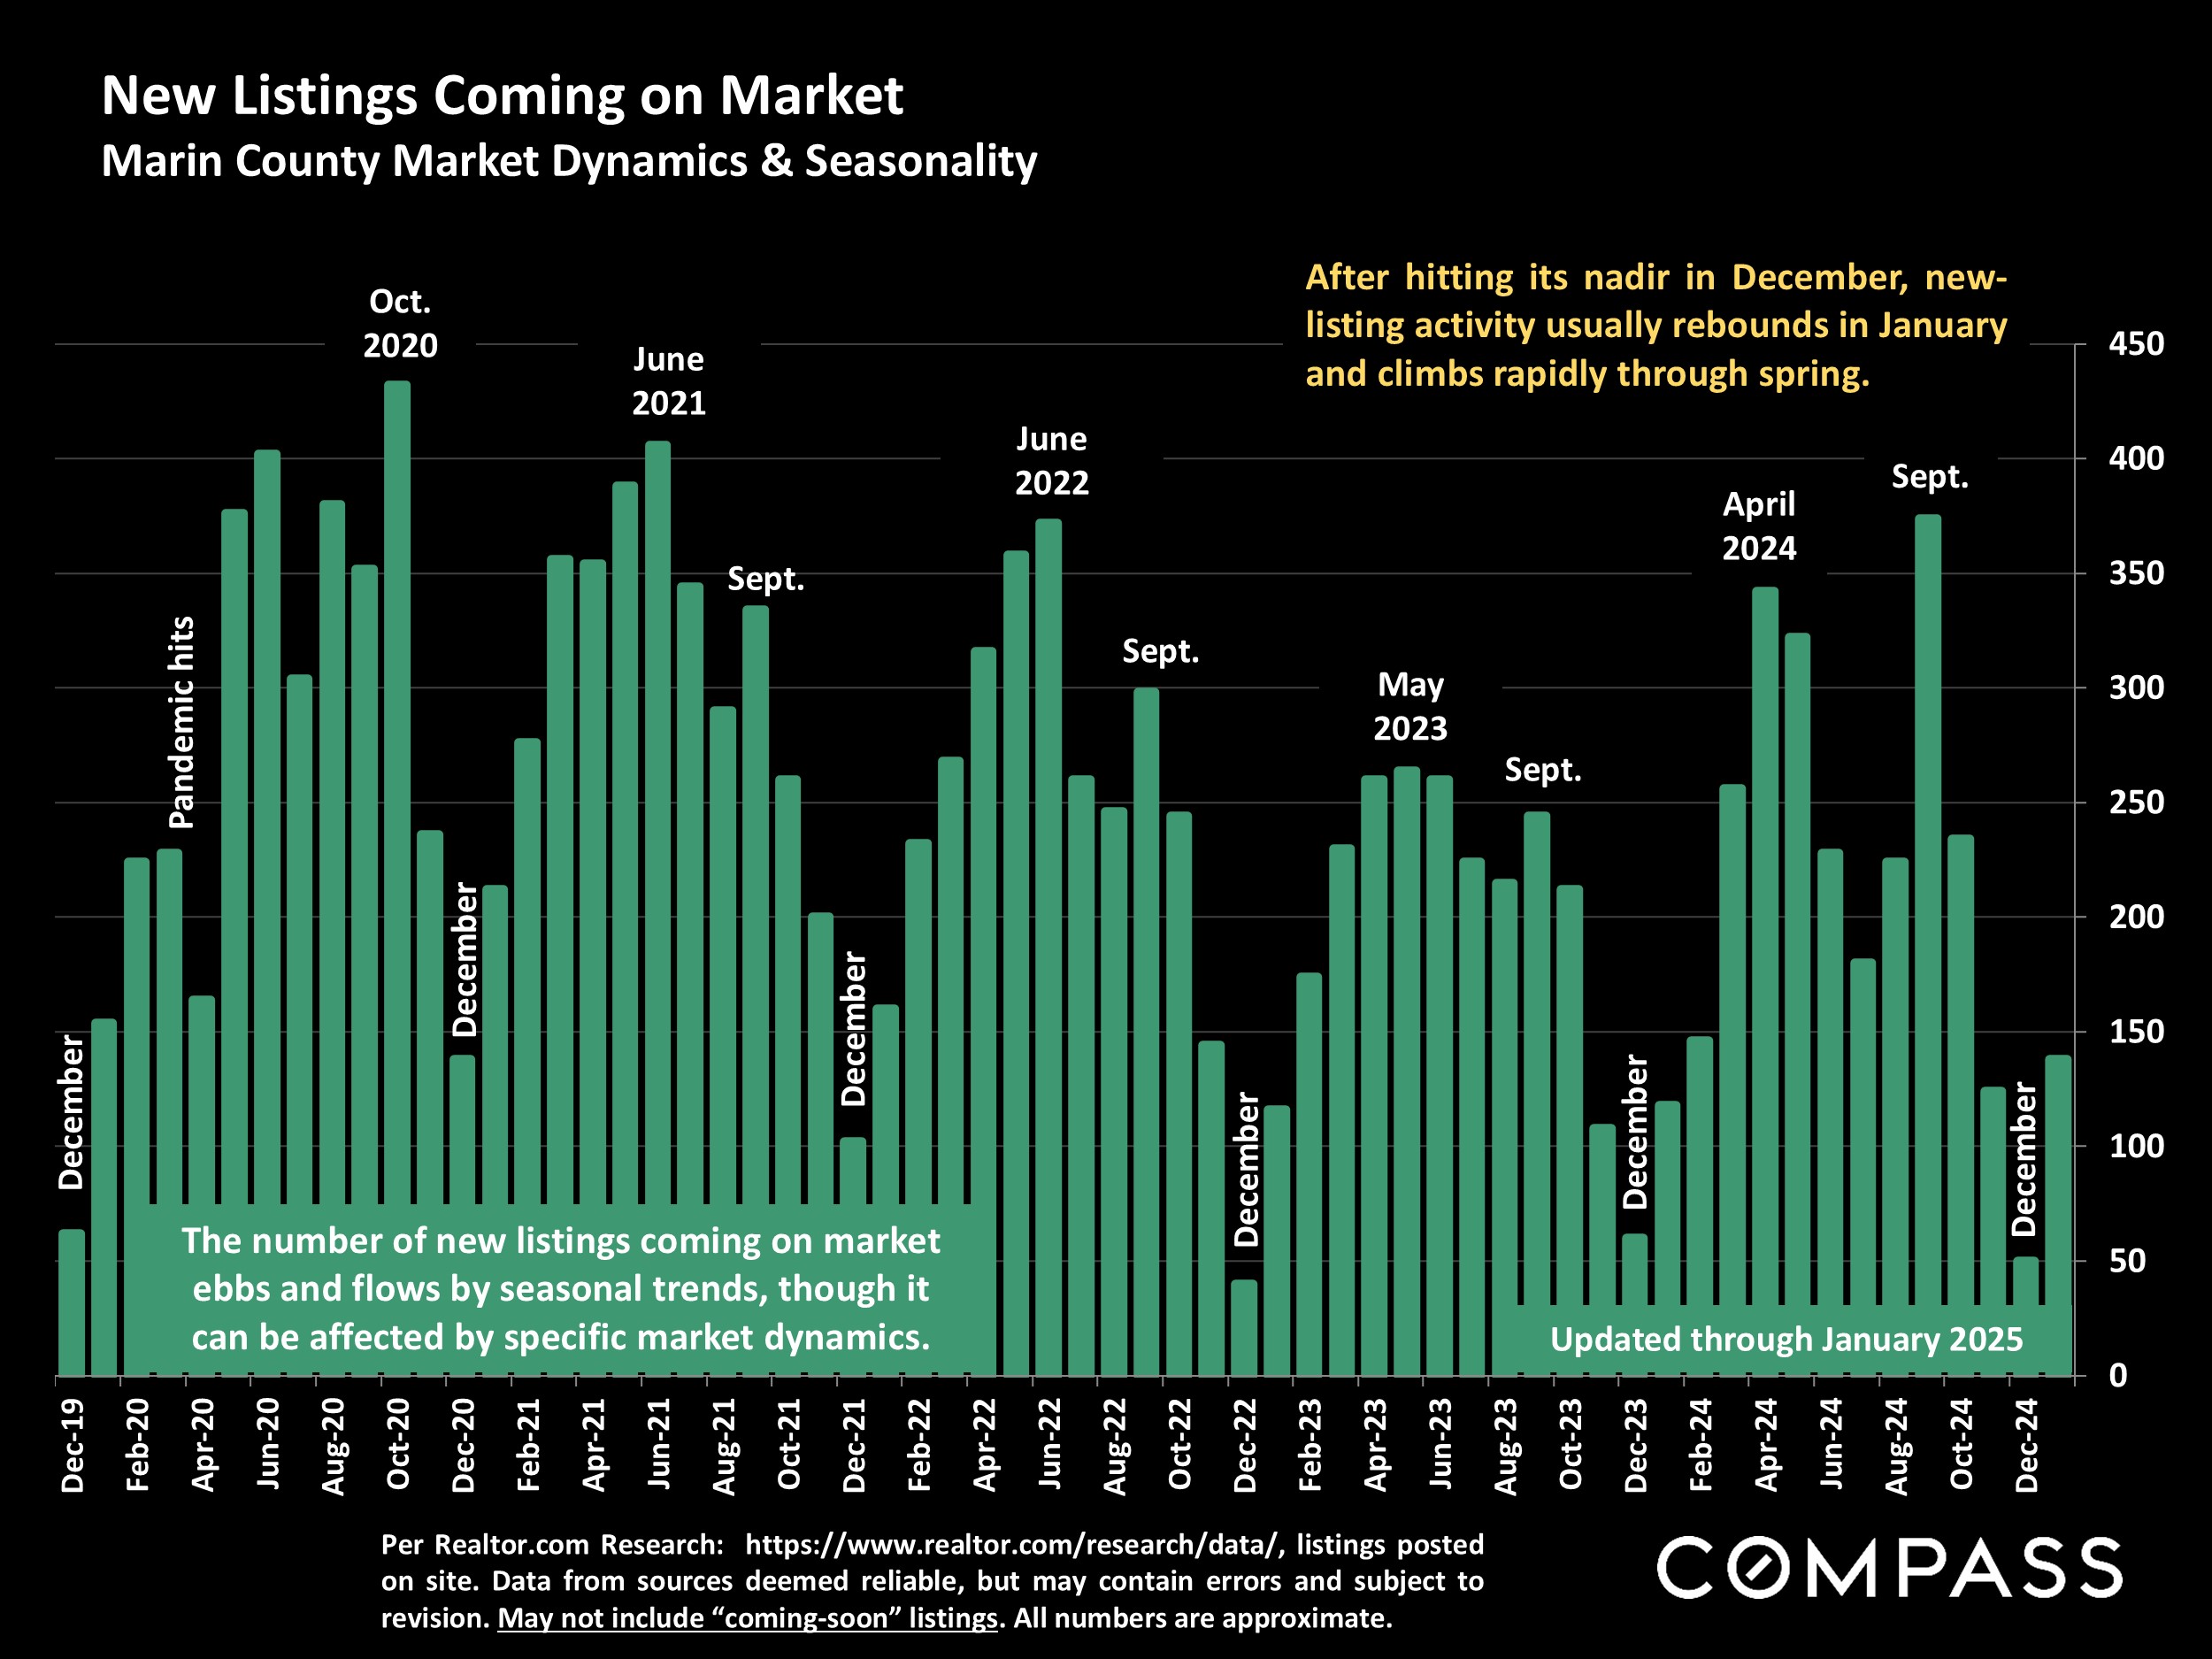
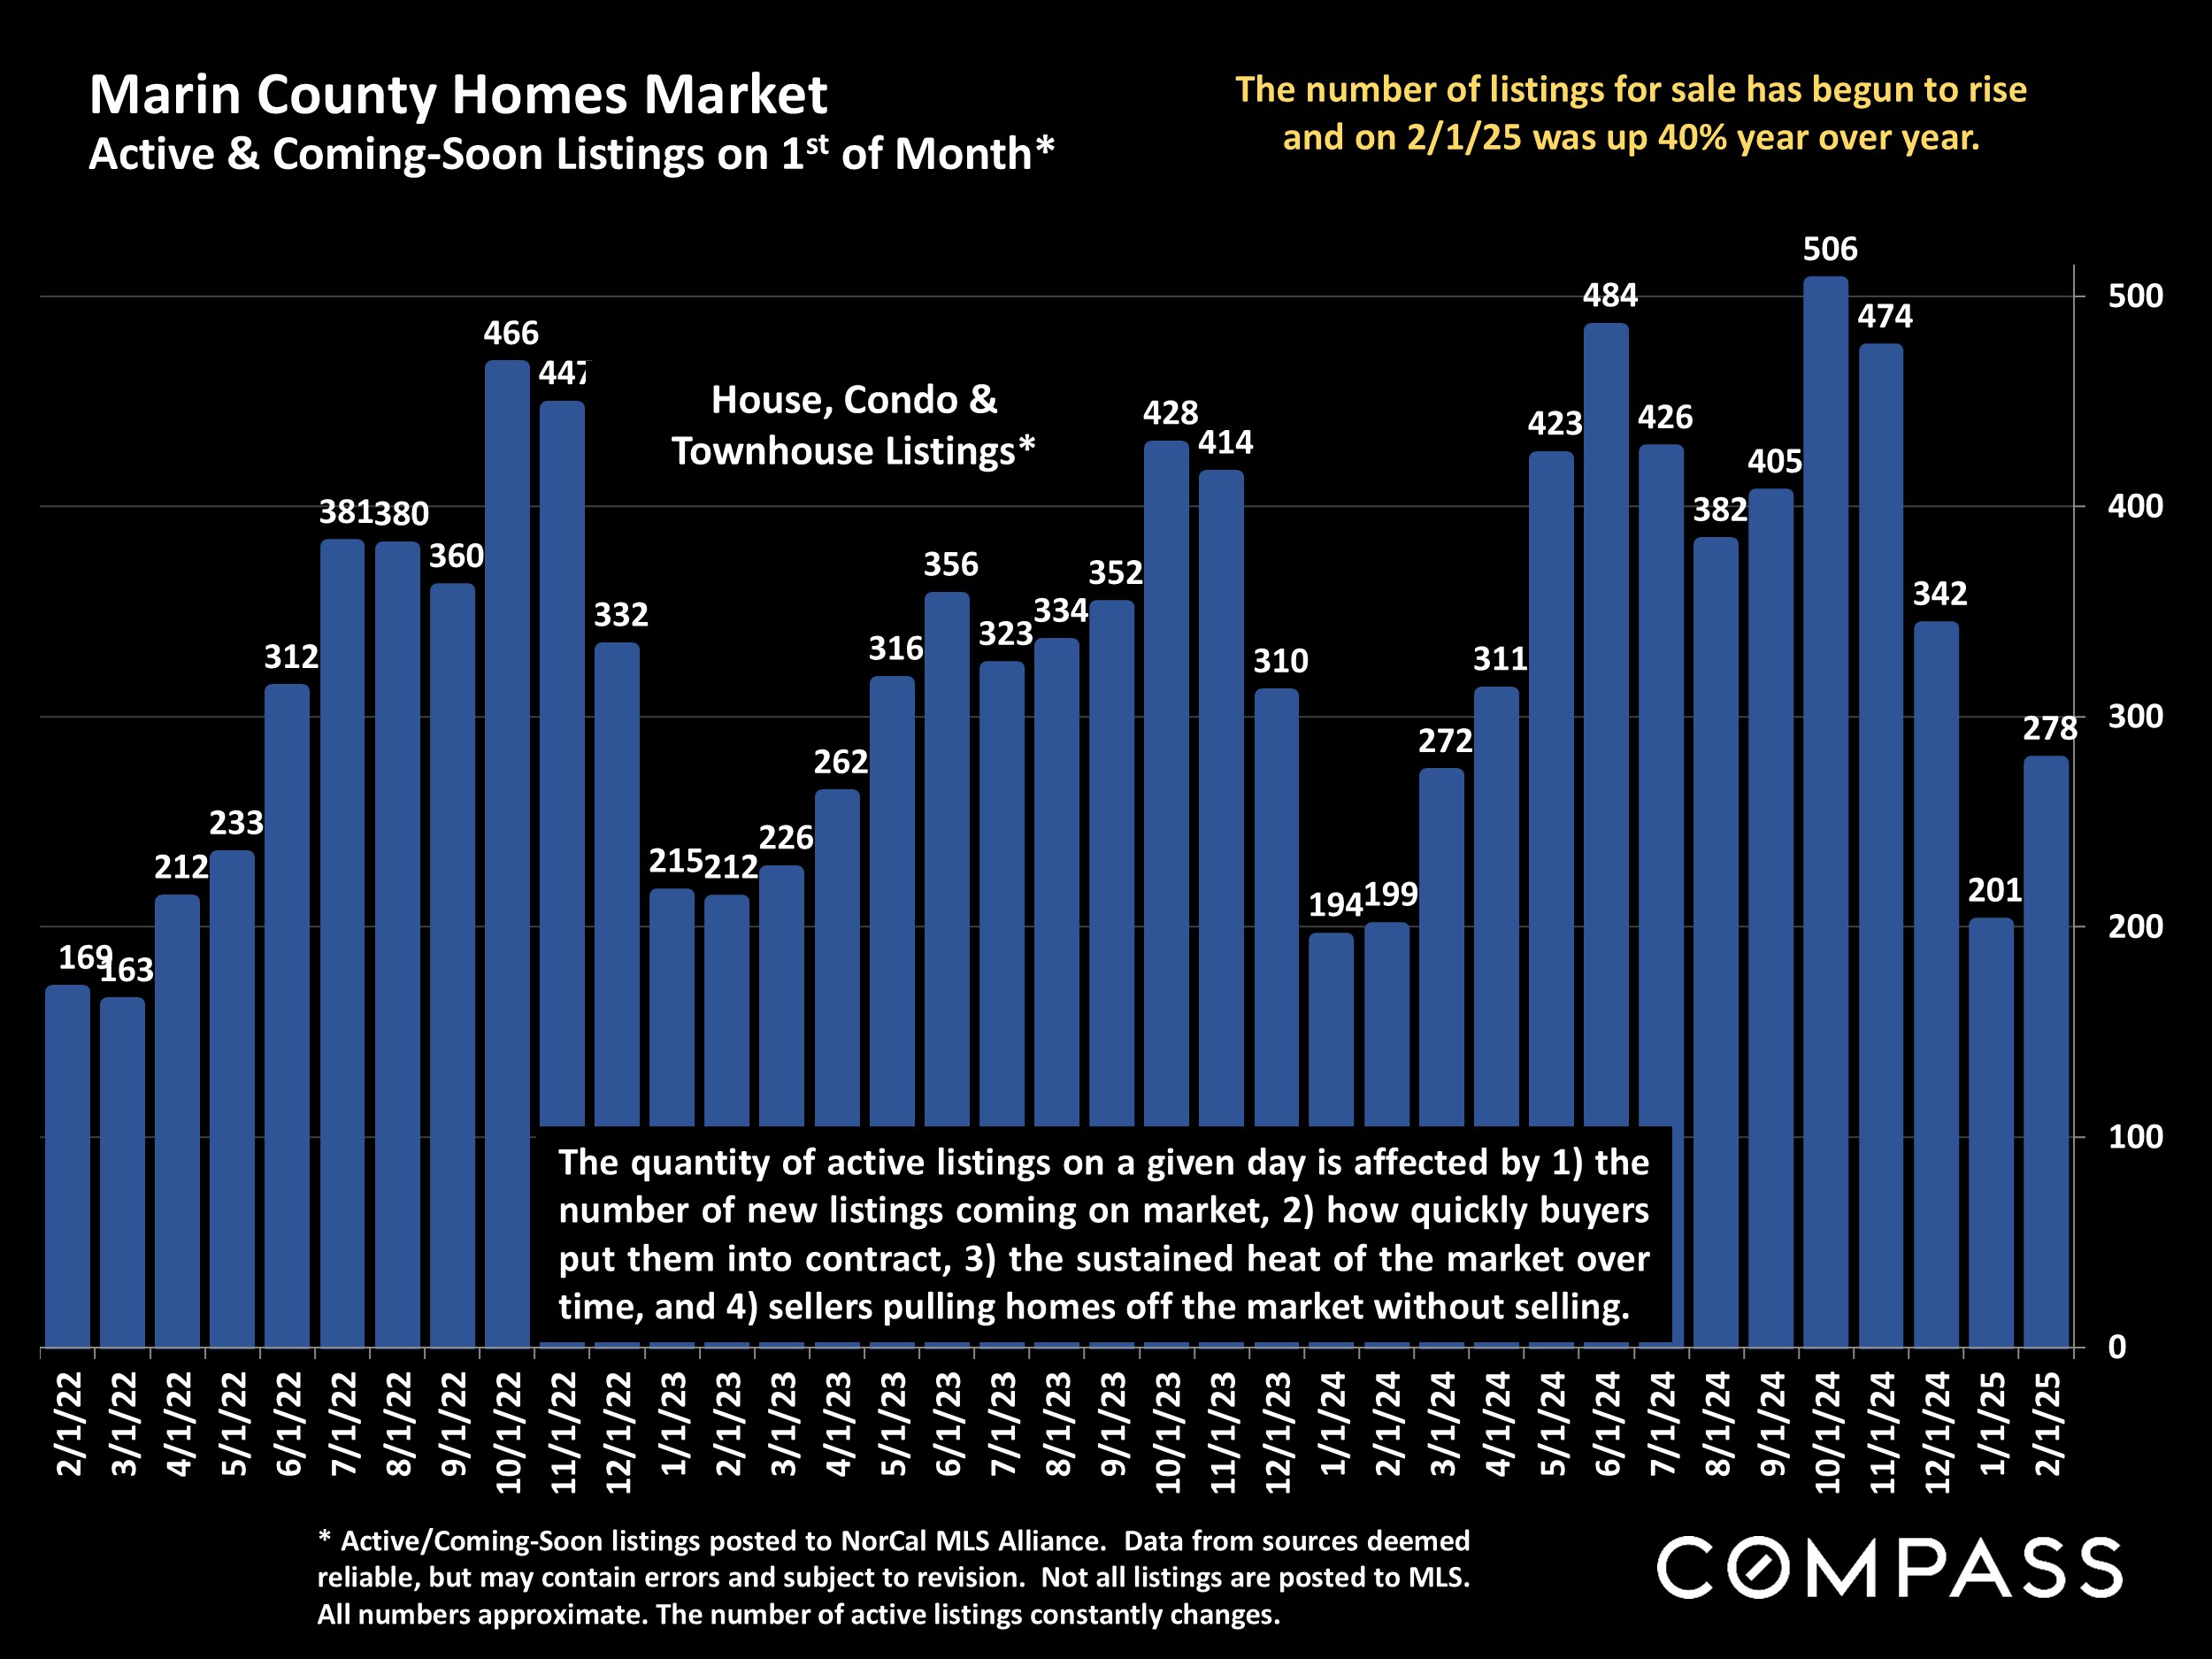
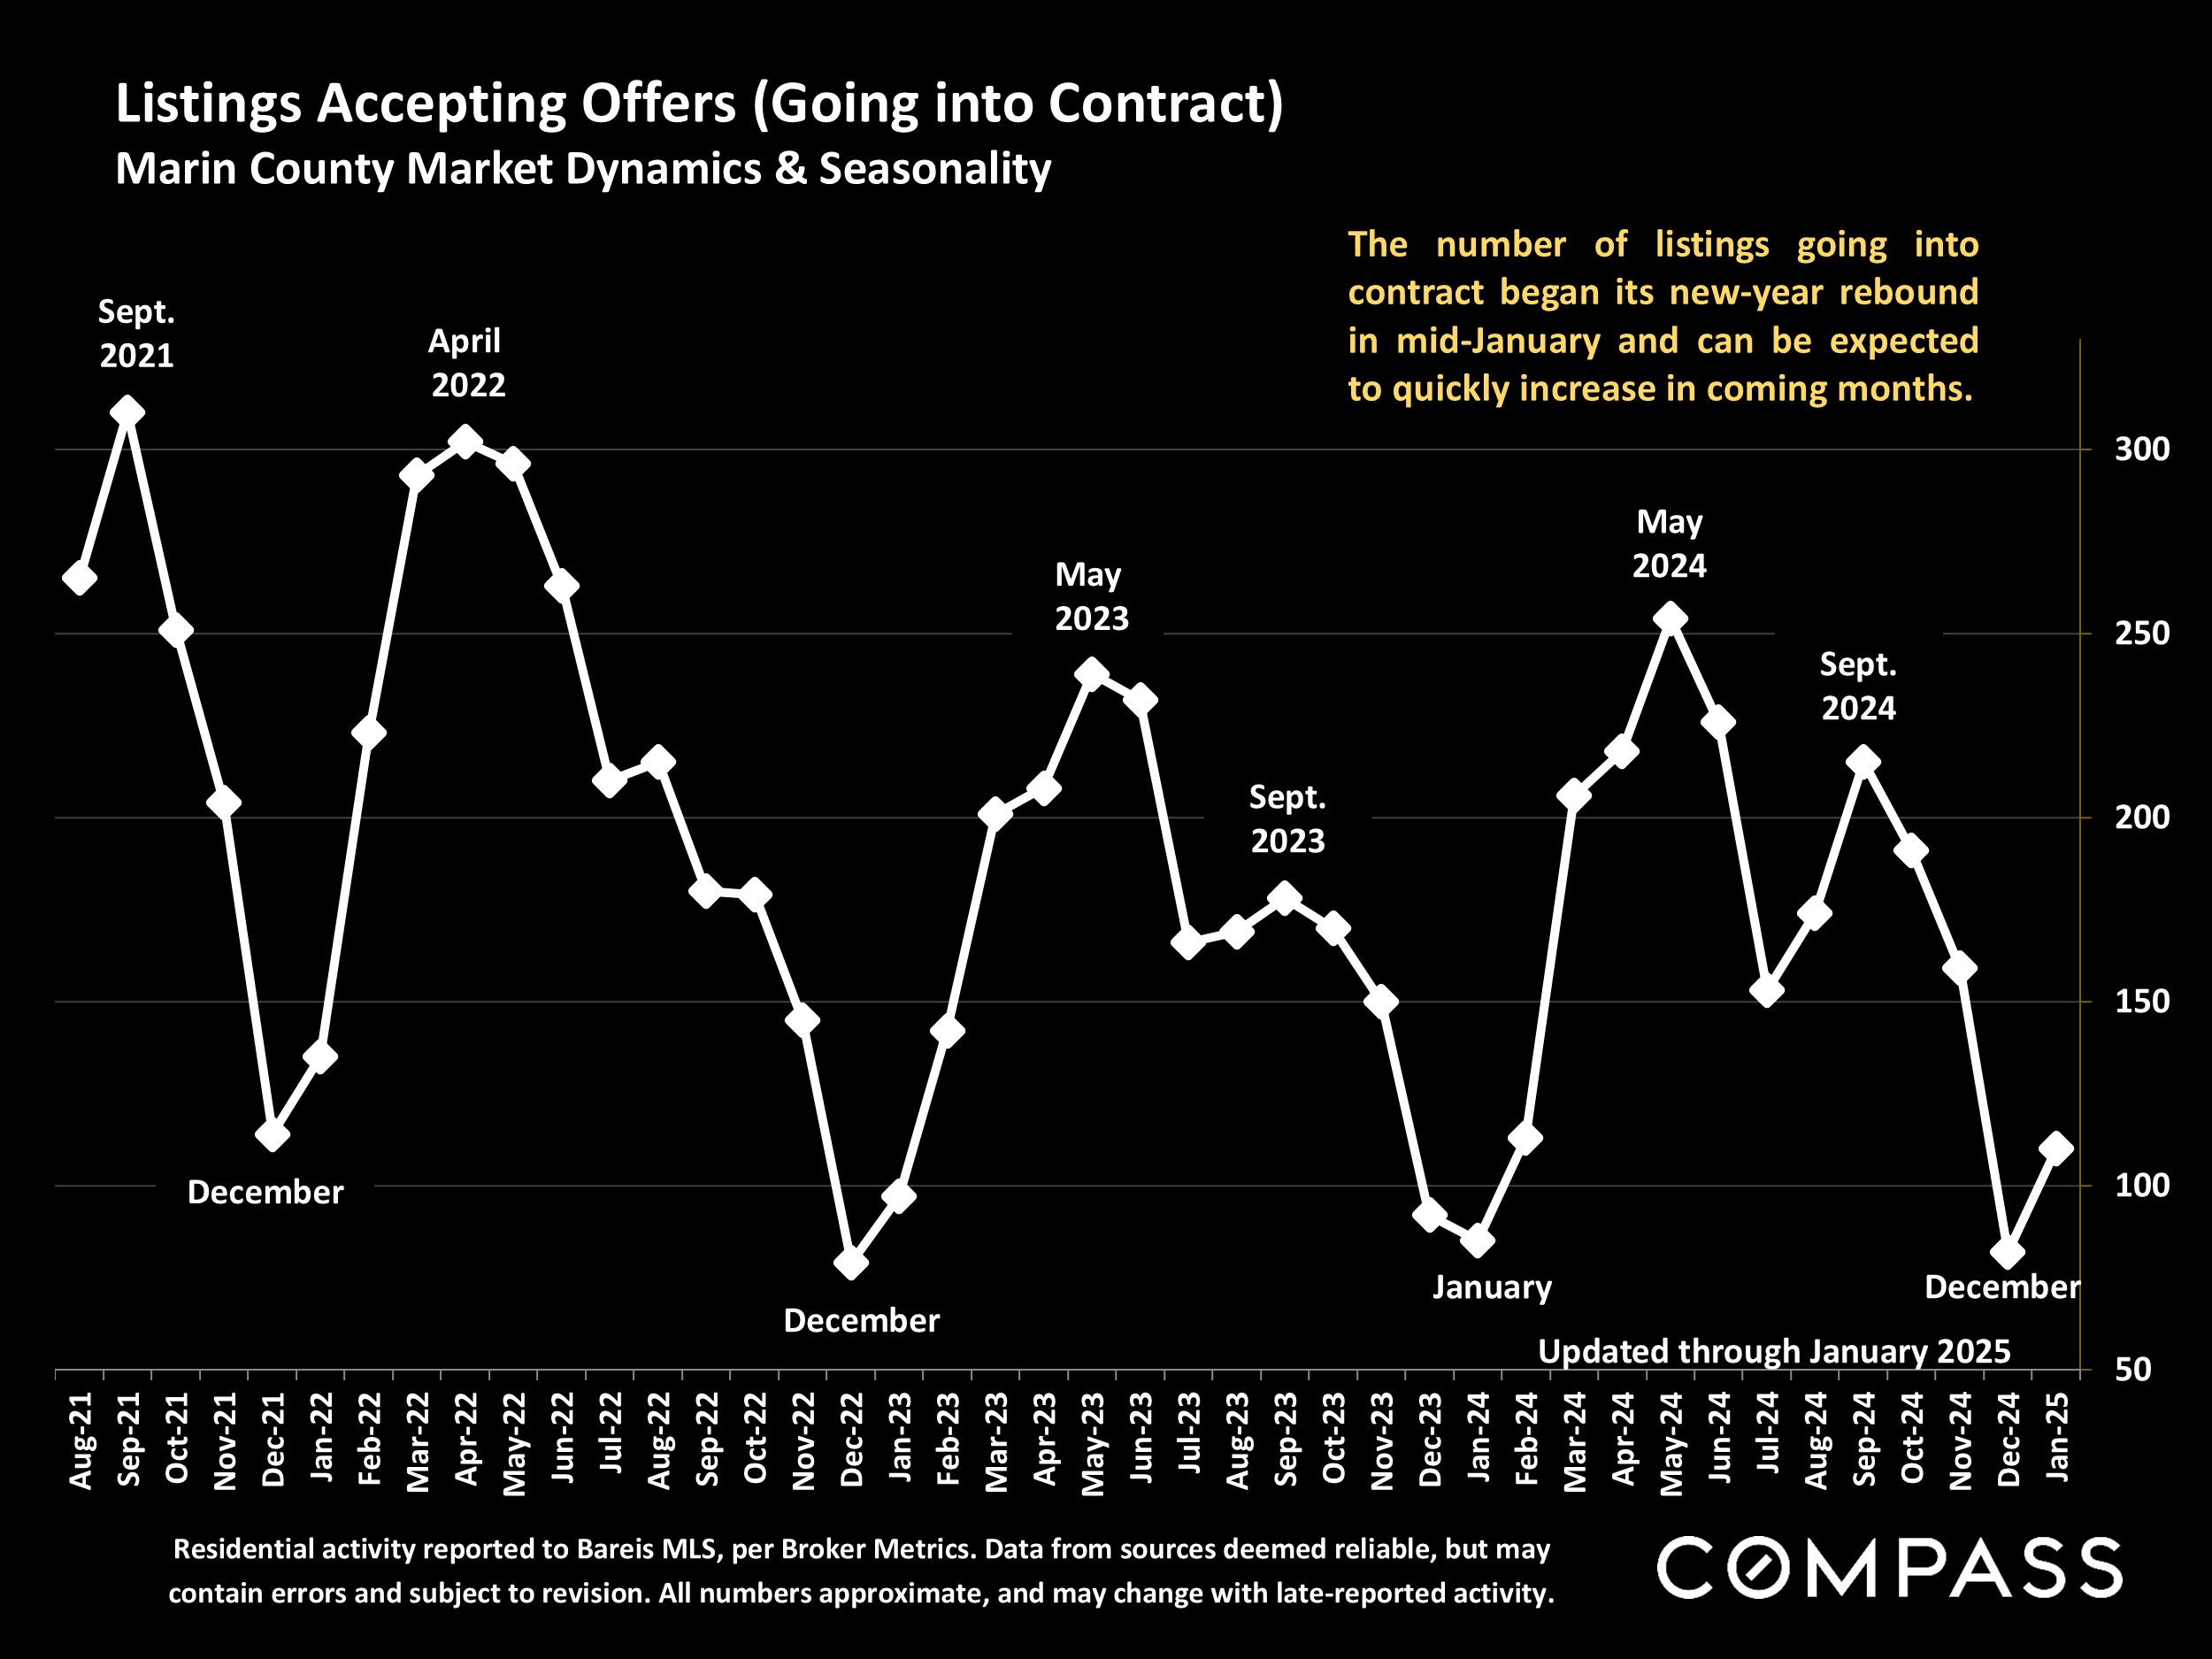
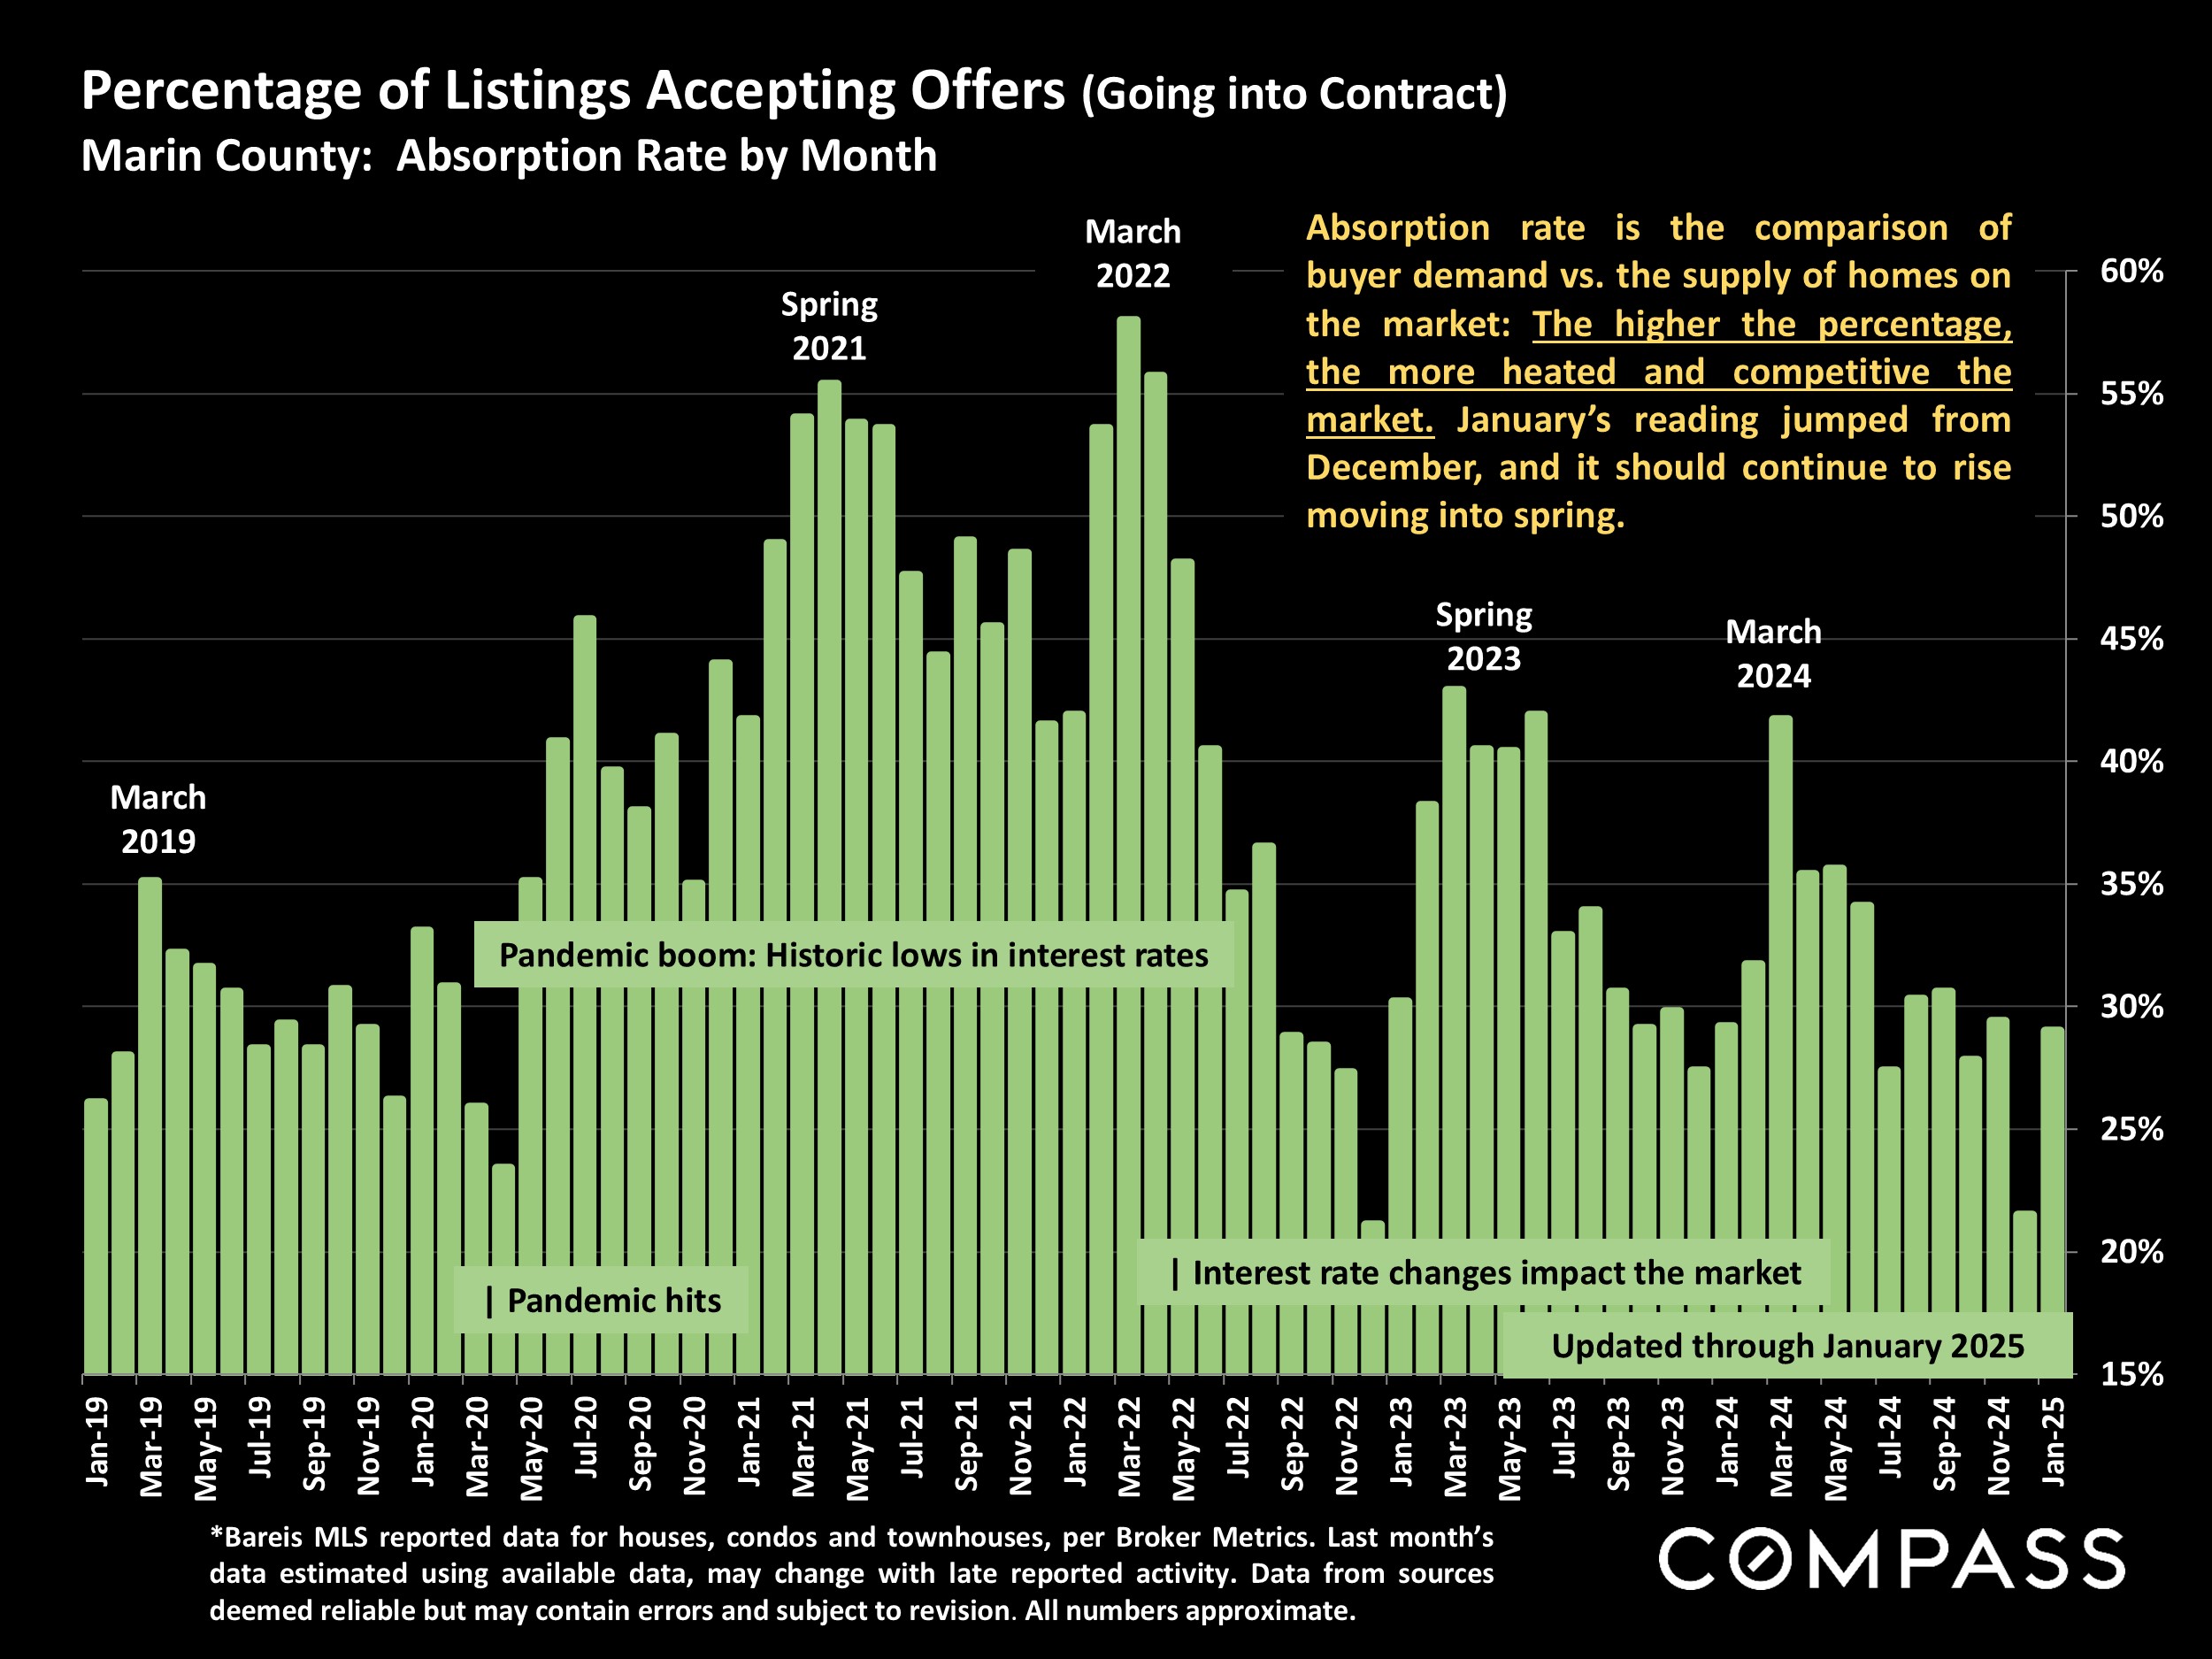
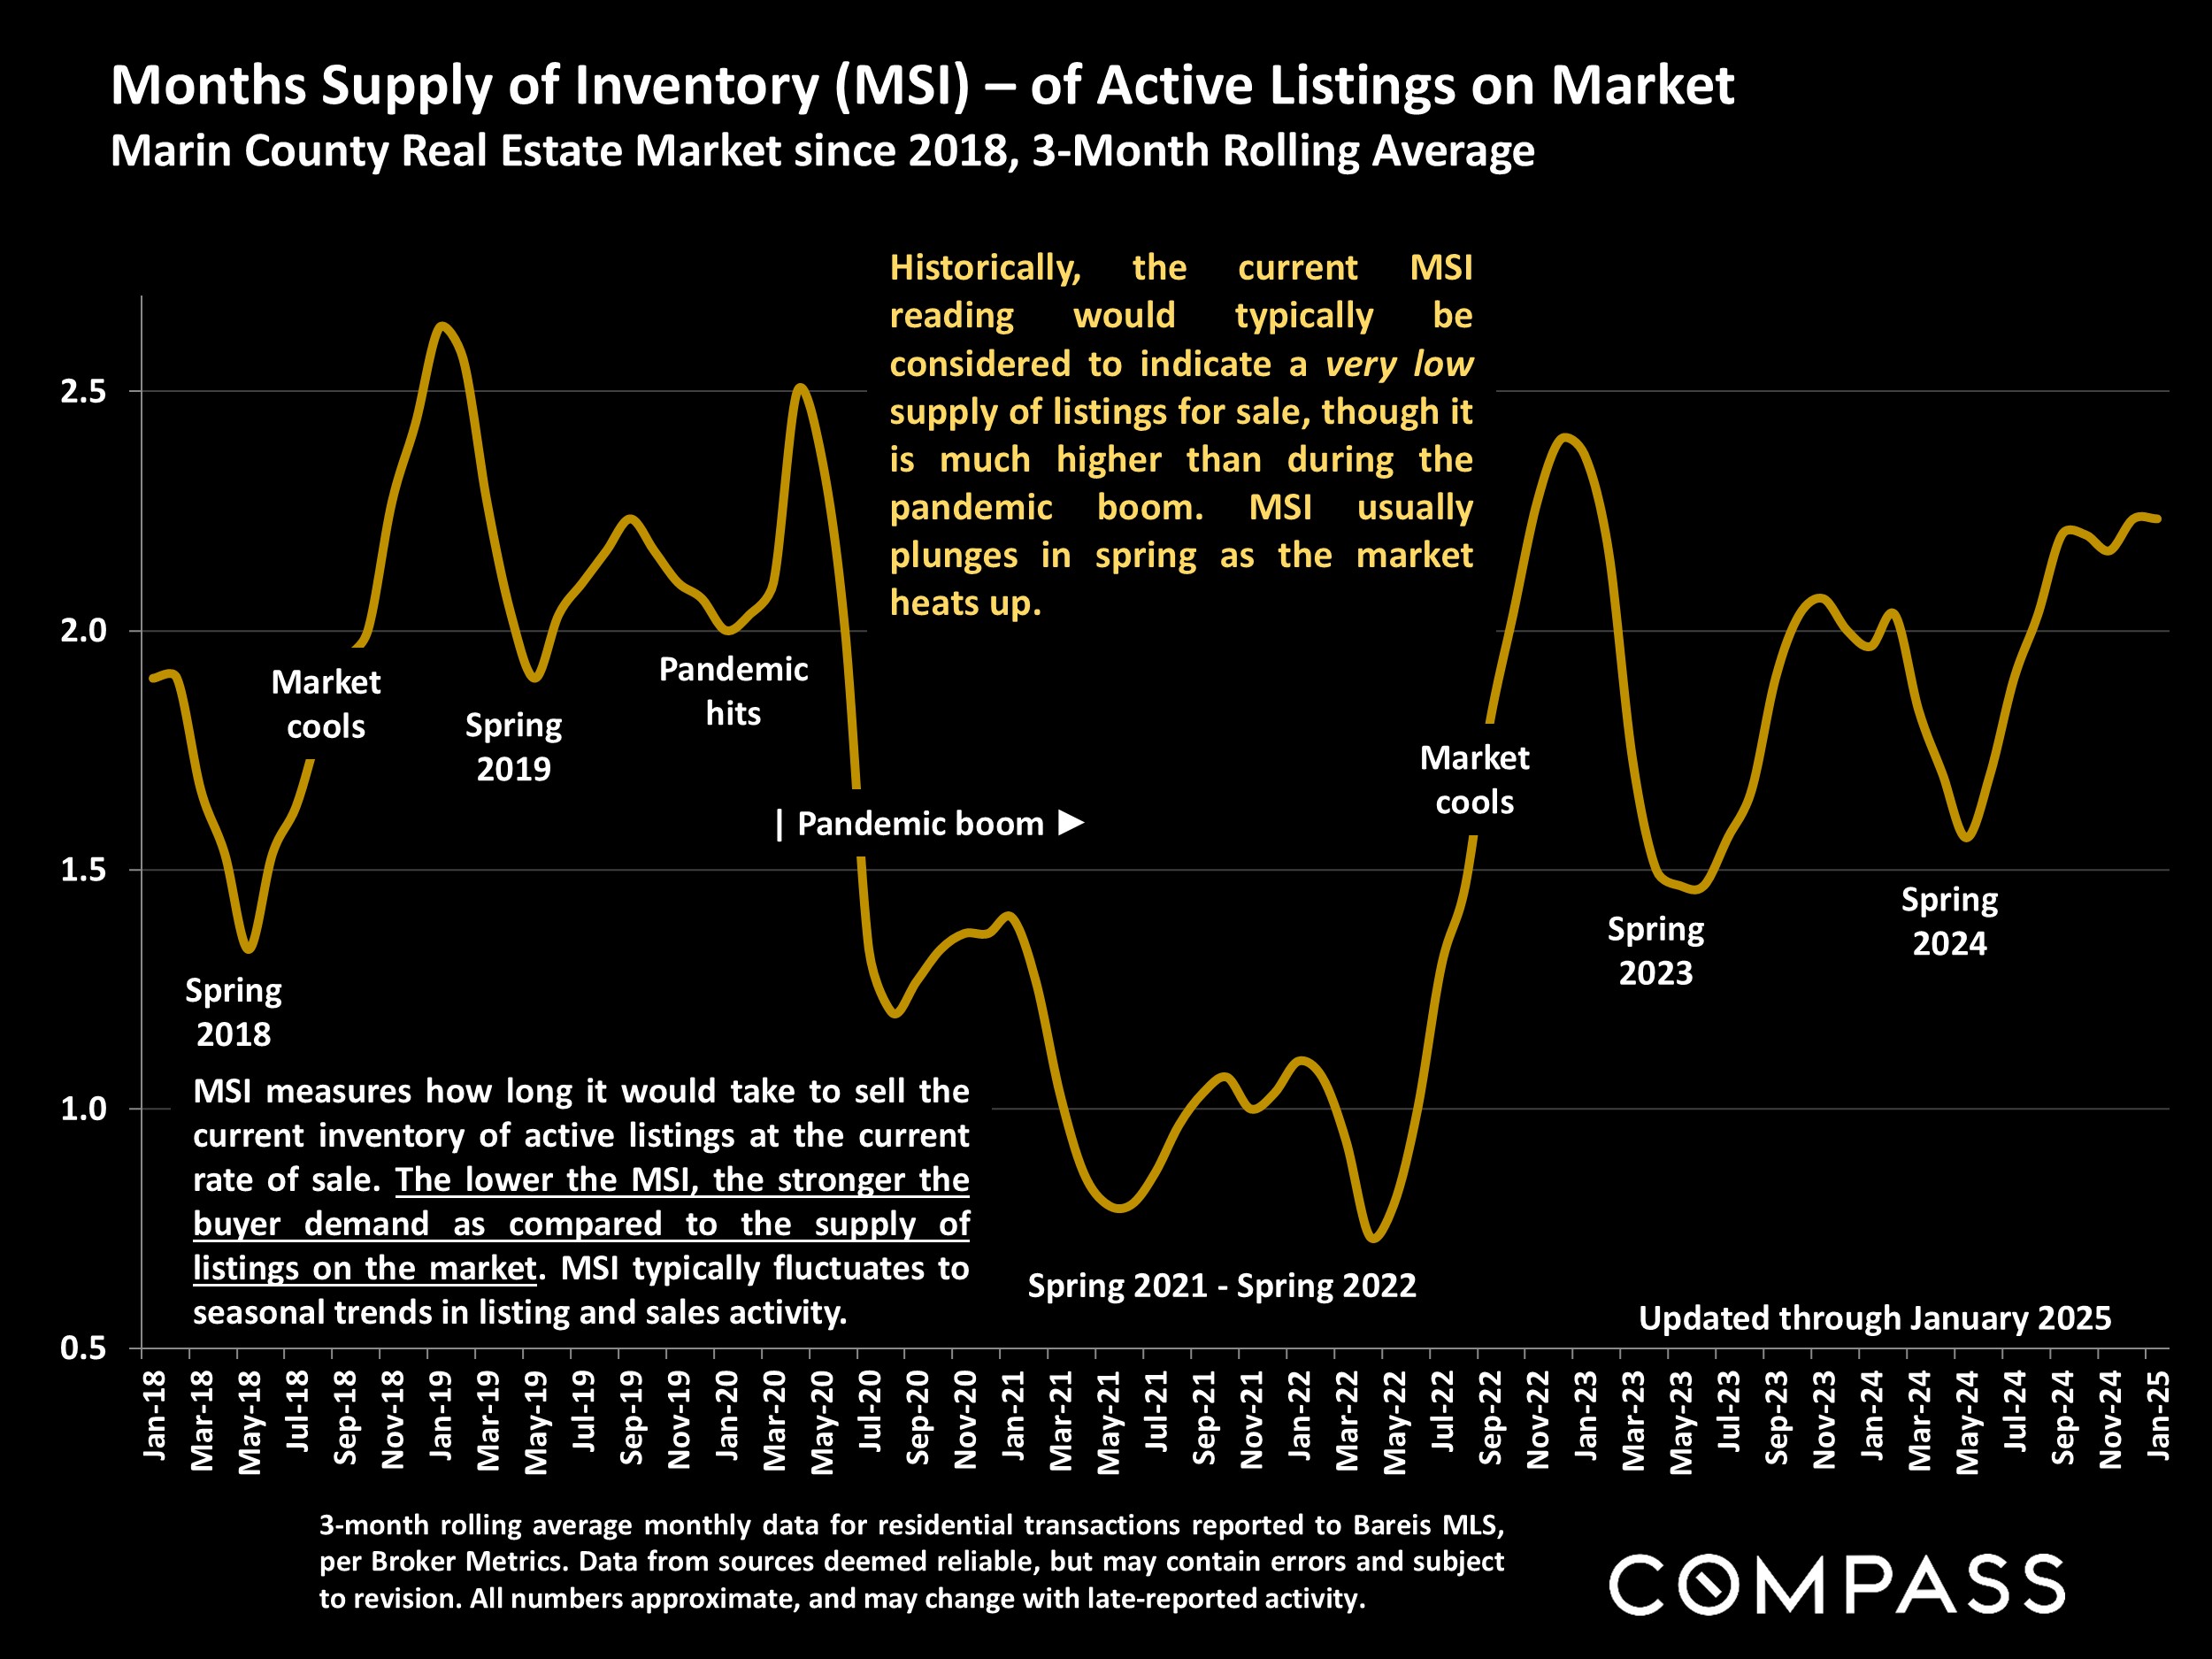
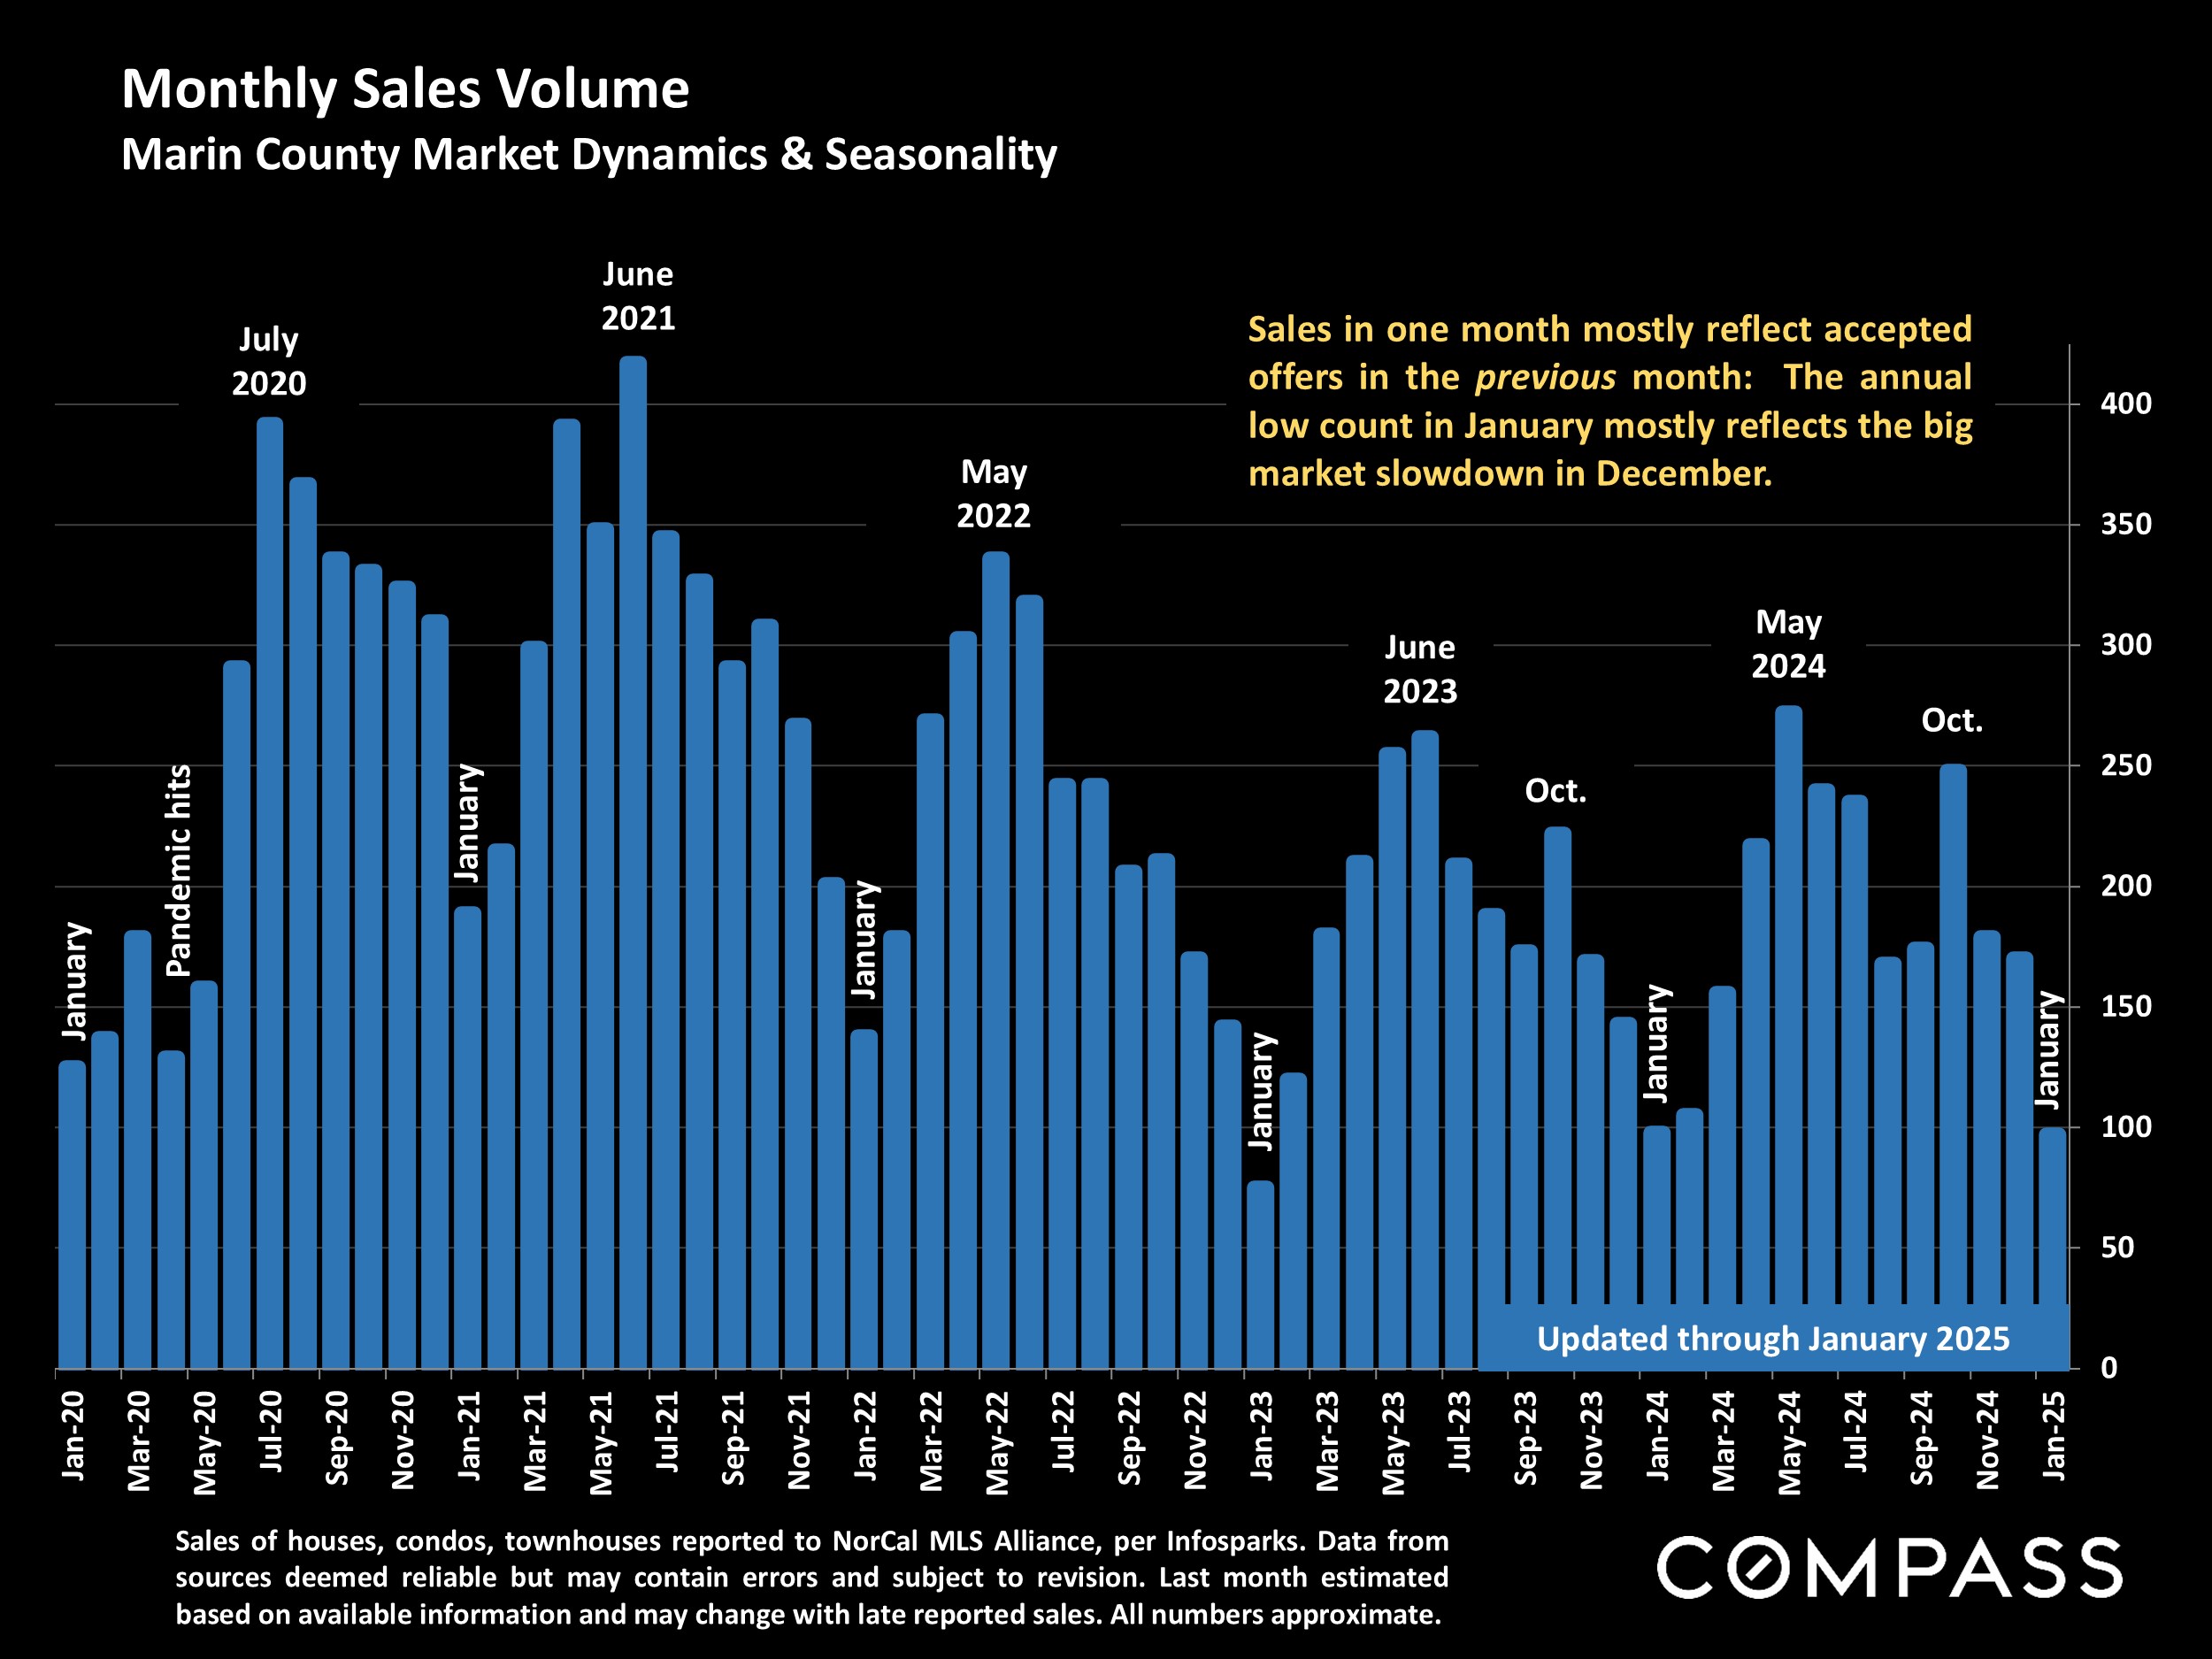
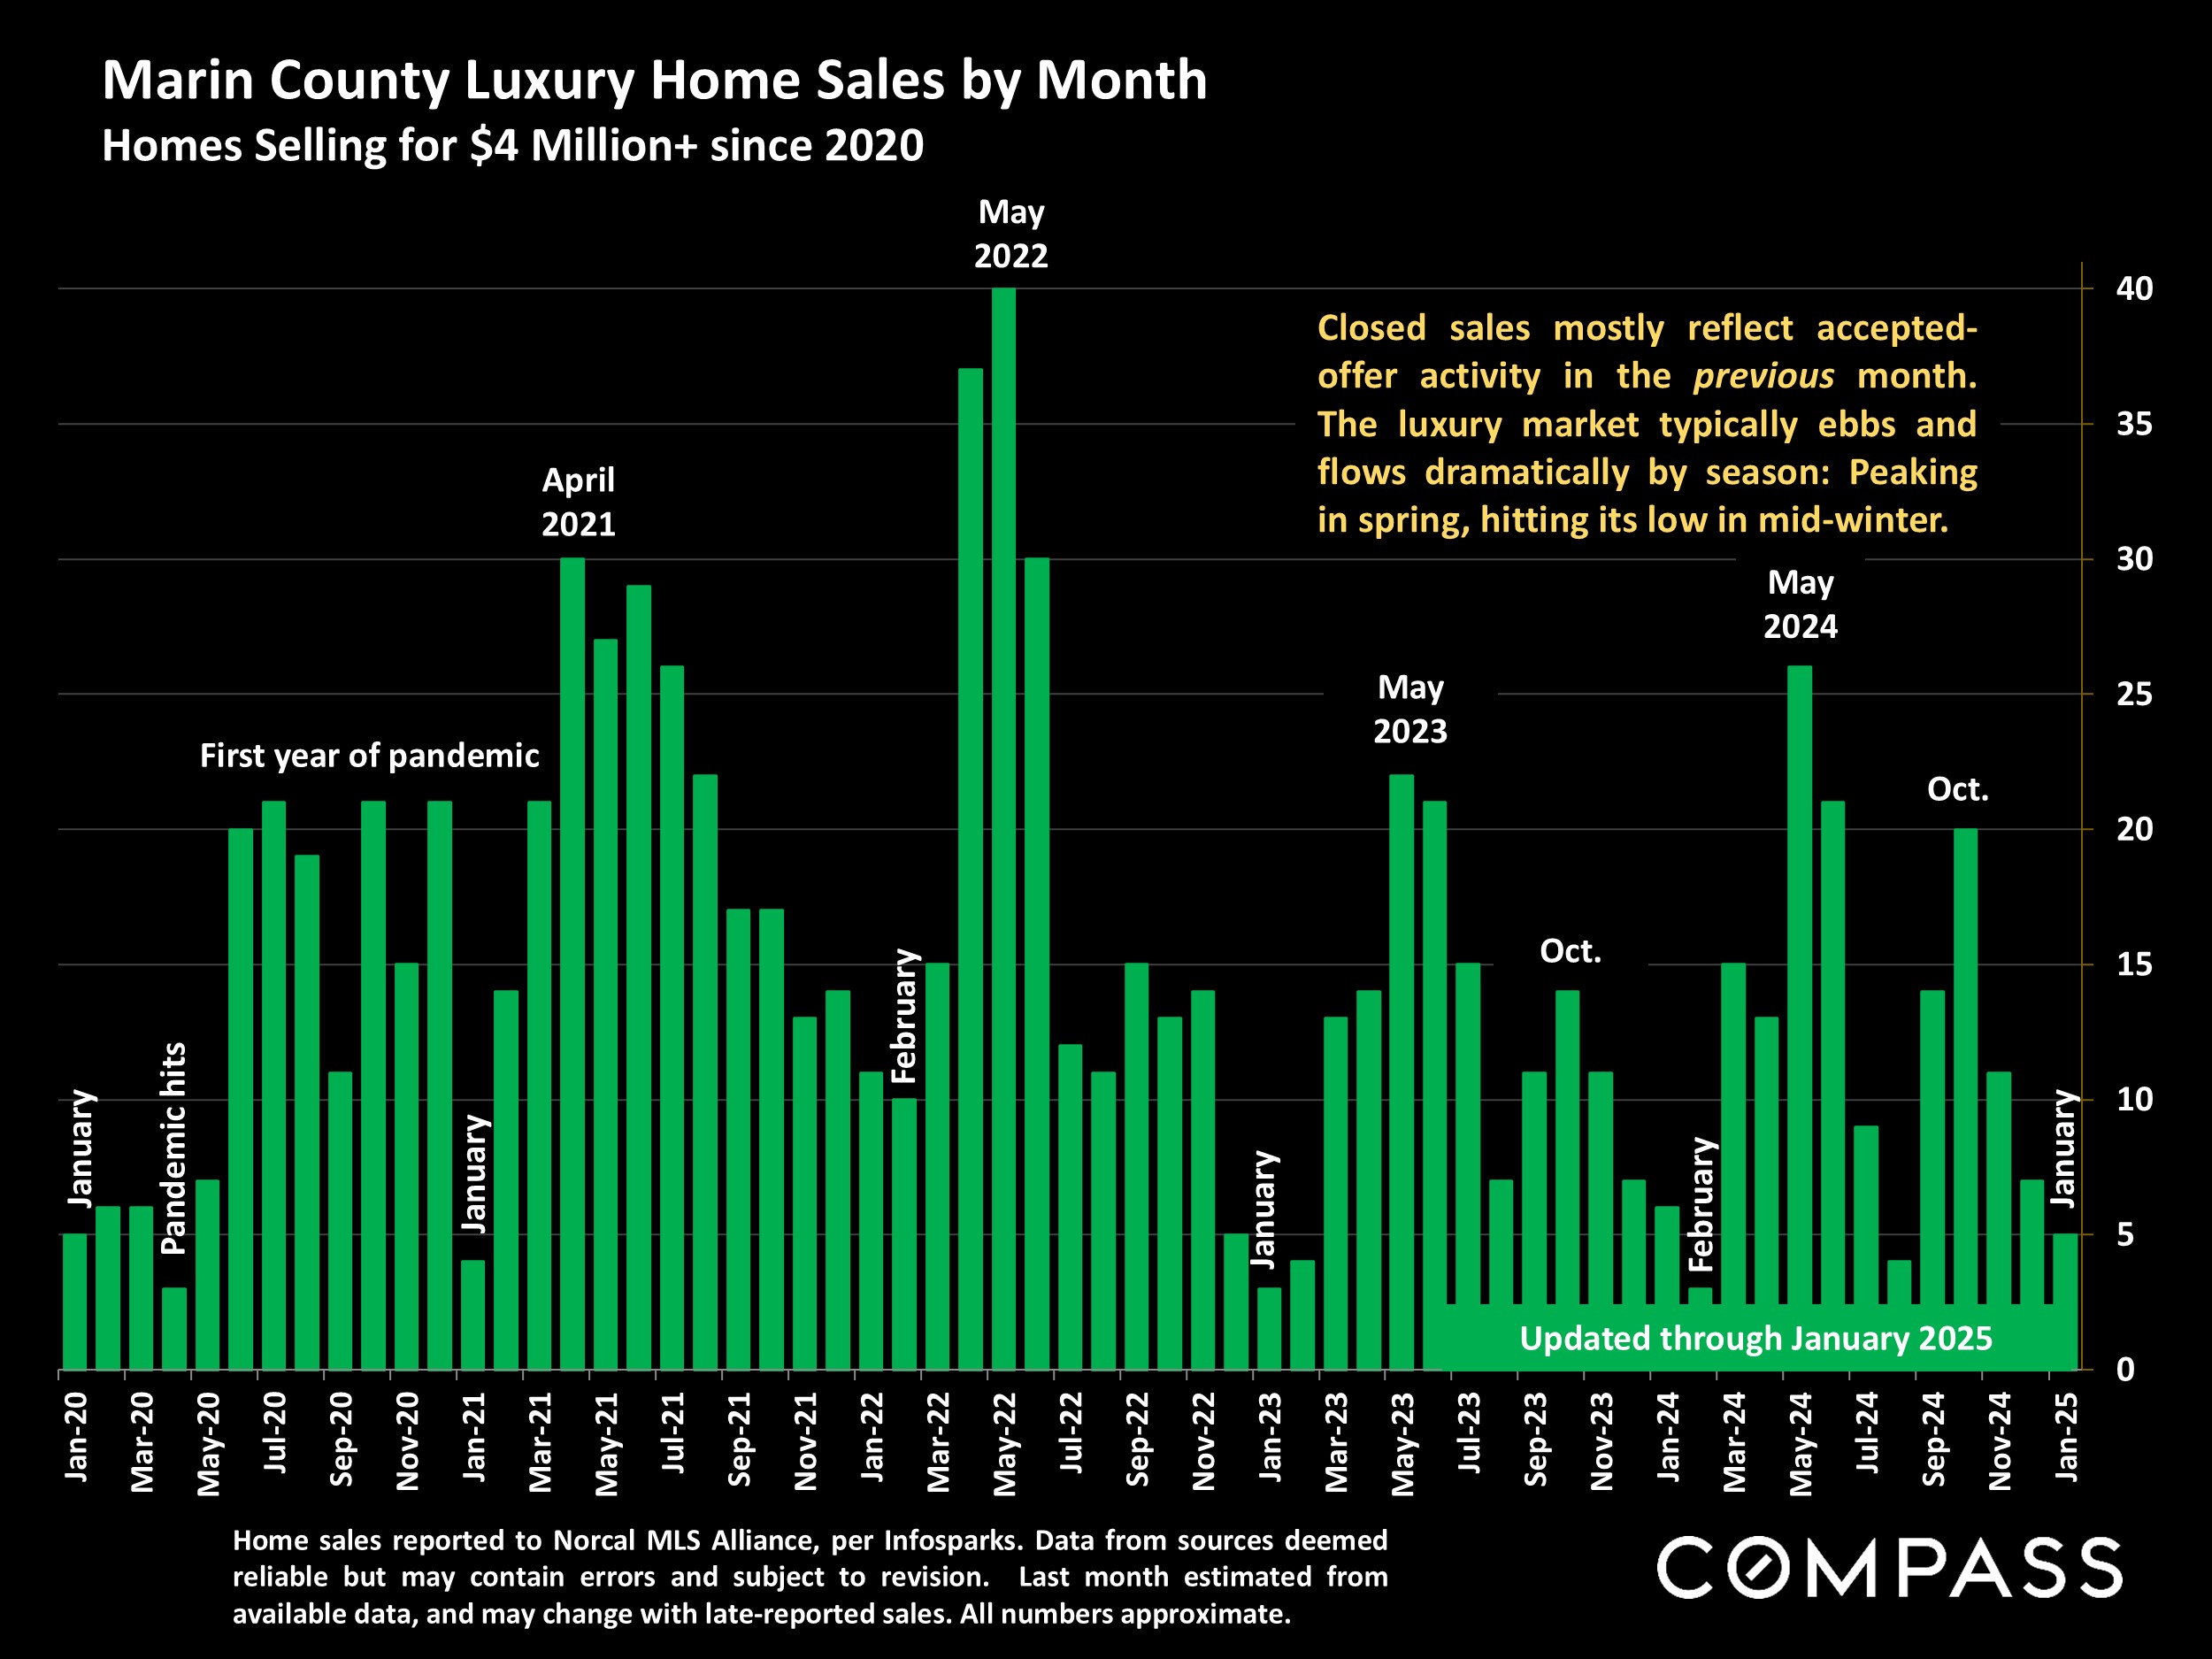
But in local real estate, 2025 began with the usual new year rebound: The numbers of new listings and of listings going into contract have bounced back from their annual low counts in December, and both are almost certain to rise rapidly as we move further into the year. In the Bay Area, we are already on the cusp of spring, which typically sees the most heated market conditions of the year, and, not unusually, the highest median home sales prices.

"Our outlook for the U.S. economy is positive and offers a promising perspective on the housing market in the year ahead. We expect the U.S. labor market to continue to cool in 2025, which will reduce some of the pressures on inflation. And though we forecast mortgage rates to remain higher for longer, we expect the rate lock-in effect to cool off throughout the year as homeowners adjust to the new normal with respect to rates, therefore adding more inventory to the market." Freddie Mac Research, 1/28/25

30-Year, Fixed-Rate, JUMBO Mortgage Index* Optimal Blue Mortgage Market Index since 2018Marin County Home Price Trends since 1990 Monthly Median House Sales Price, 3-Month Rolling2011 - 2024*Marin County House Value Trends since 2005 3-Month-Rolling Median Dollar per Square Foot Values*2024 Median House Dollar per Square Foot Values Greater Bay Area + Sacramento, by County*Marin County Condo Price Trends since 2005 3-Month Rolling Median Condo Sales PriceNew Listings Coming on Market Marin County Market Dynamics & SeasonalityMarin County Homes Market Active & Coming-Soon Listings on 1st of Month*Listings Accepting Offers (Going into Contract) Marin County Market Dynamics & SeasonalityPercentage of Listings Accepting Offers (Going into Contract) Marin County: Absorption Rate by MonthMonths Supply of Inventory (MSI) - of Active Listings on Market Marin County Real Estate Market since 2018, 3-Month Rolling AverageMonthly Sales Volume Marin County Market Dynamics & SeasonalityMarin County Luxury Home Sales by Month Homes Selling for $4 Million+ since 2020Price Reductions on Active Listings Marin County Market Dynamics & SeasonalityOverbidding List Prices in Marin County Percentage of Home Sales Closing over List Price, since 2019Average Sales Price to Original List Price Percentage Marin County Over/Under Bidding: Market Dynamics & SeasonalityMedian Days on Market: Speed of Sale Marin County: Market Dynamics & SeasonalityAverage Annual Home Insurance Cost for $300,000 in Coverage Comparative Costs in Selected States, per Bankrate, January 2025* STATE Avg. Annual Cost Nebraska $ 5,401 Florida $ 5,376 Kansas $ 4,168 Louisiana $ 3,969 Texas $ 3,725 Mississippi $ 3,171 Kentucky $ 3,151 Colorado $ 3,017 Minnesota $ 2,583 Montana $ 2,418 North Carolina $ 2,394 Tennessee $ 2,305 South Carolina $ 2,272 Rhode Island $ 2,160 STATE Avg. Annual Cost Missouri $ 2,121 Arizona $ 2,099 Illinois $ 2,079 Michigan $ 1,997 Georgia $ 1,916 New York $ 1,704 Indiana $ 1,663 Connecticut $ 1,659 Massachussets $ 1,642 Maryland $ 1,606 Virginia $ 1,578 Washington $ 1,443 California $ 1,381 Washington DC $ 1,363 STATE Avg.


Want to learn more about Bay Area market trends?

Let’s connect! With relationships and networks across the city, there are a variety of ways I can help you make informed real estate decisions. Call, email, or text – I’m here to help.


Contact