Feature image for Marin: February 2026 Market Stats

February 18, 2026

Marin: February 2026 Market Stats

By Compass

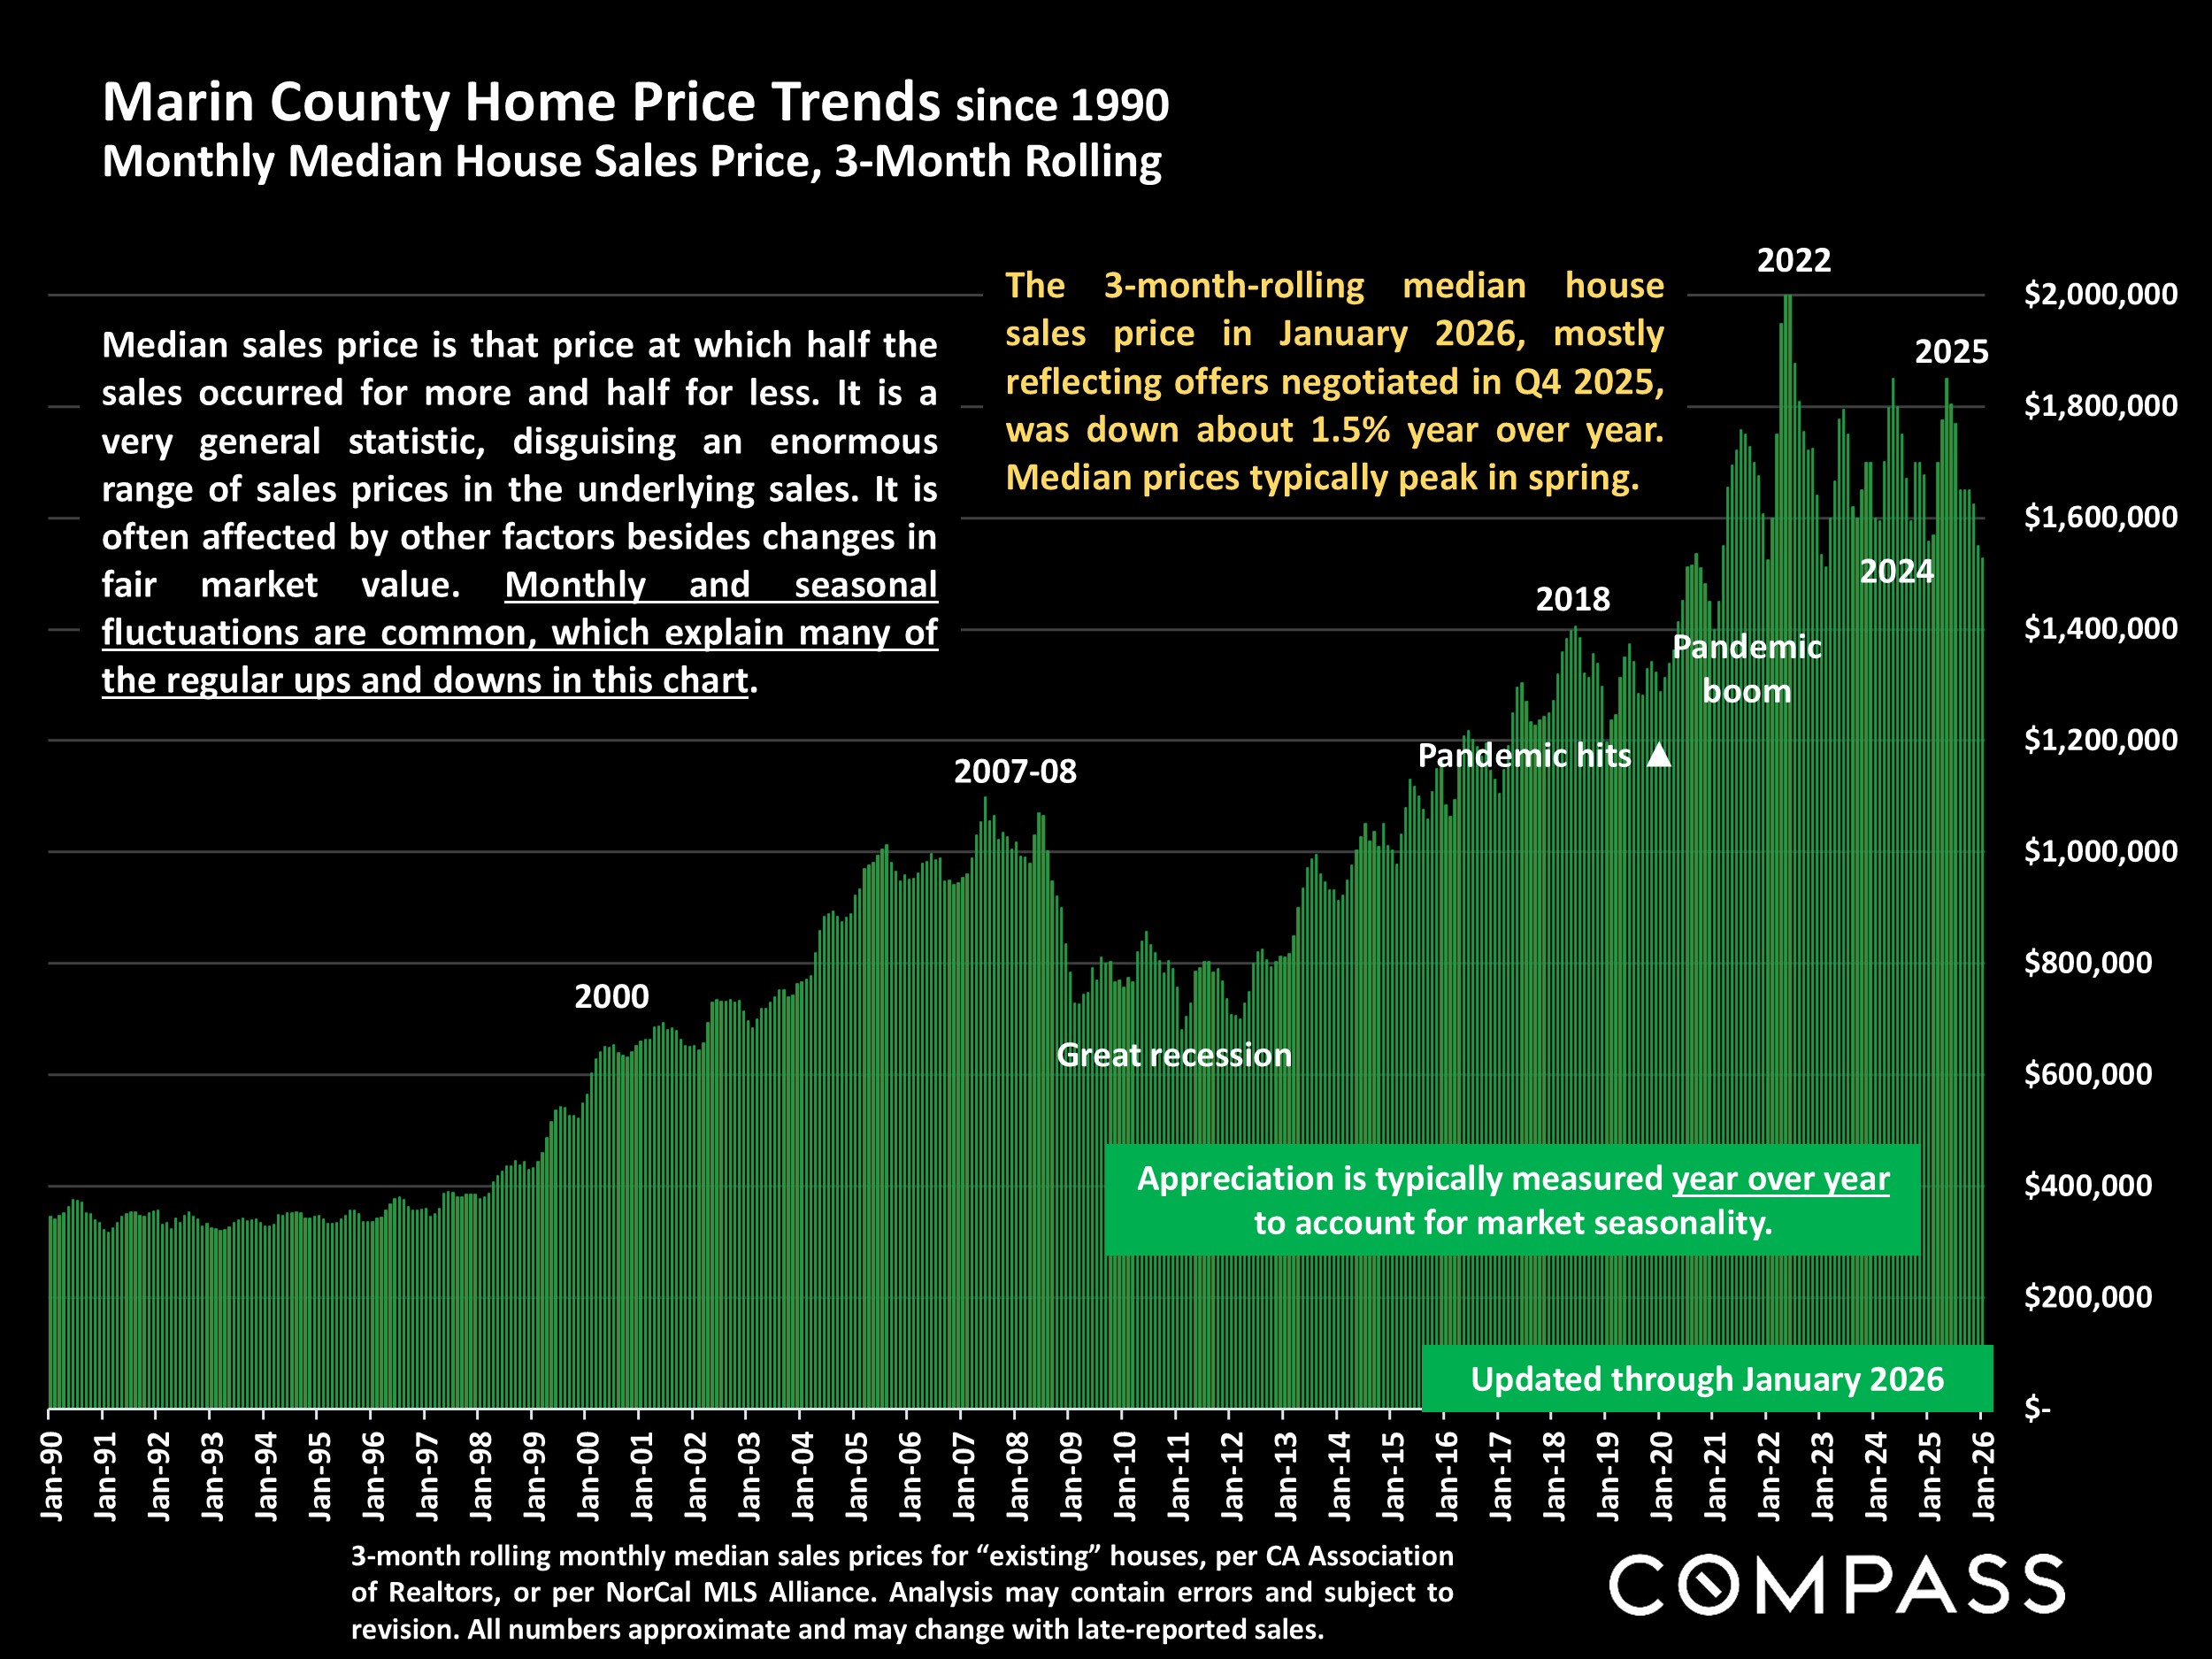
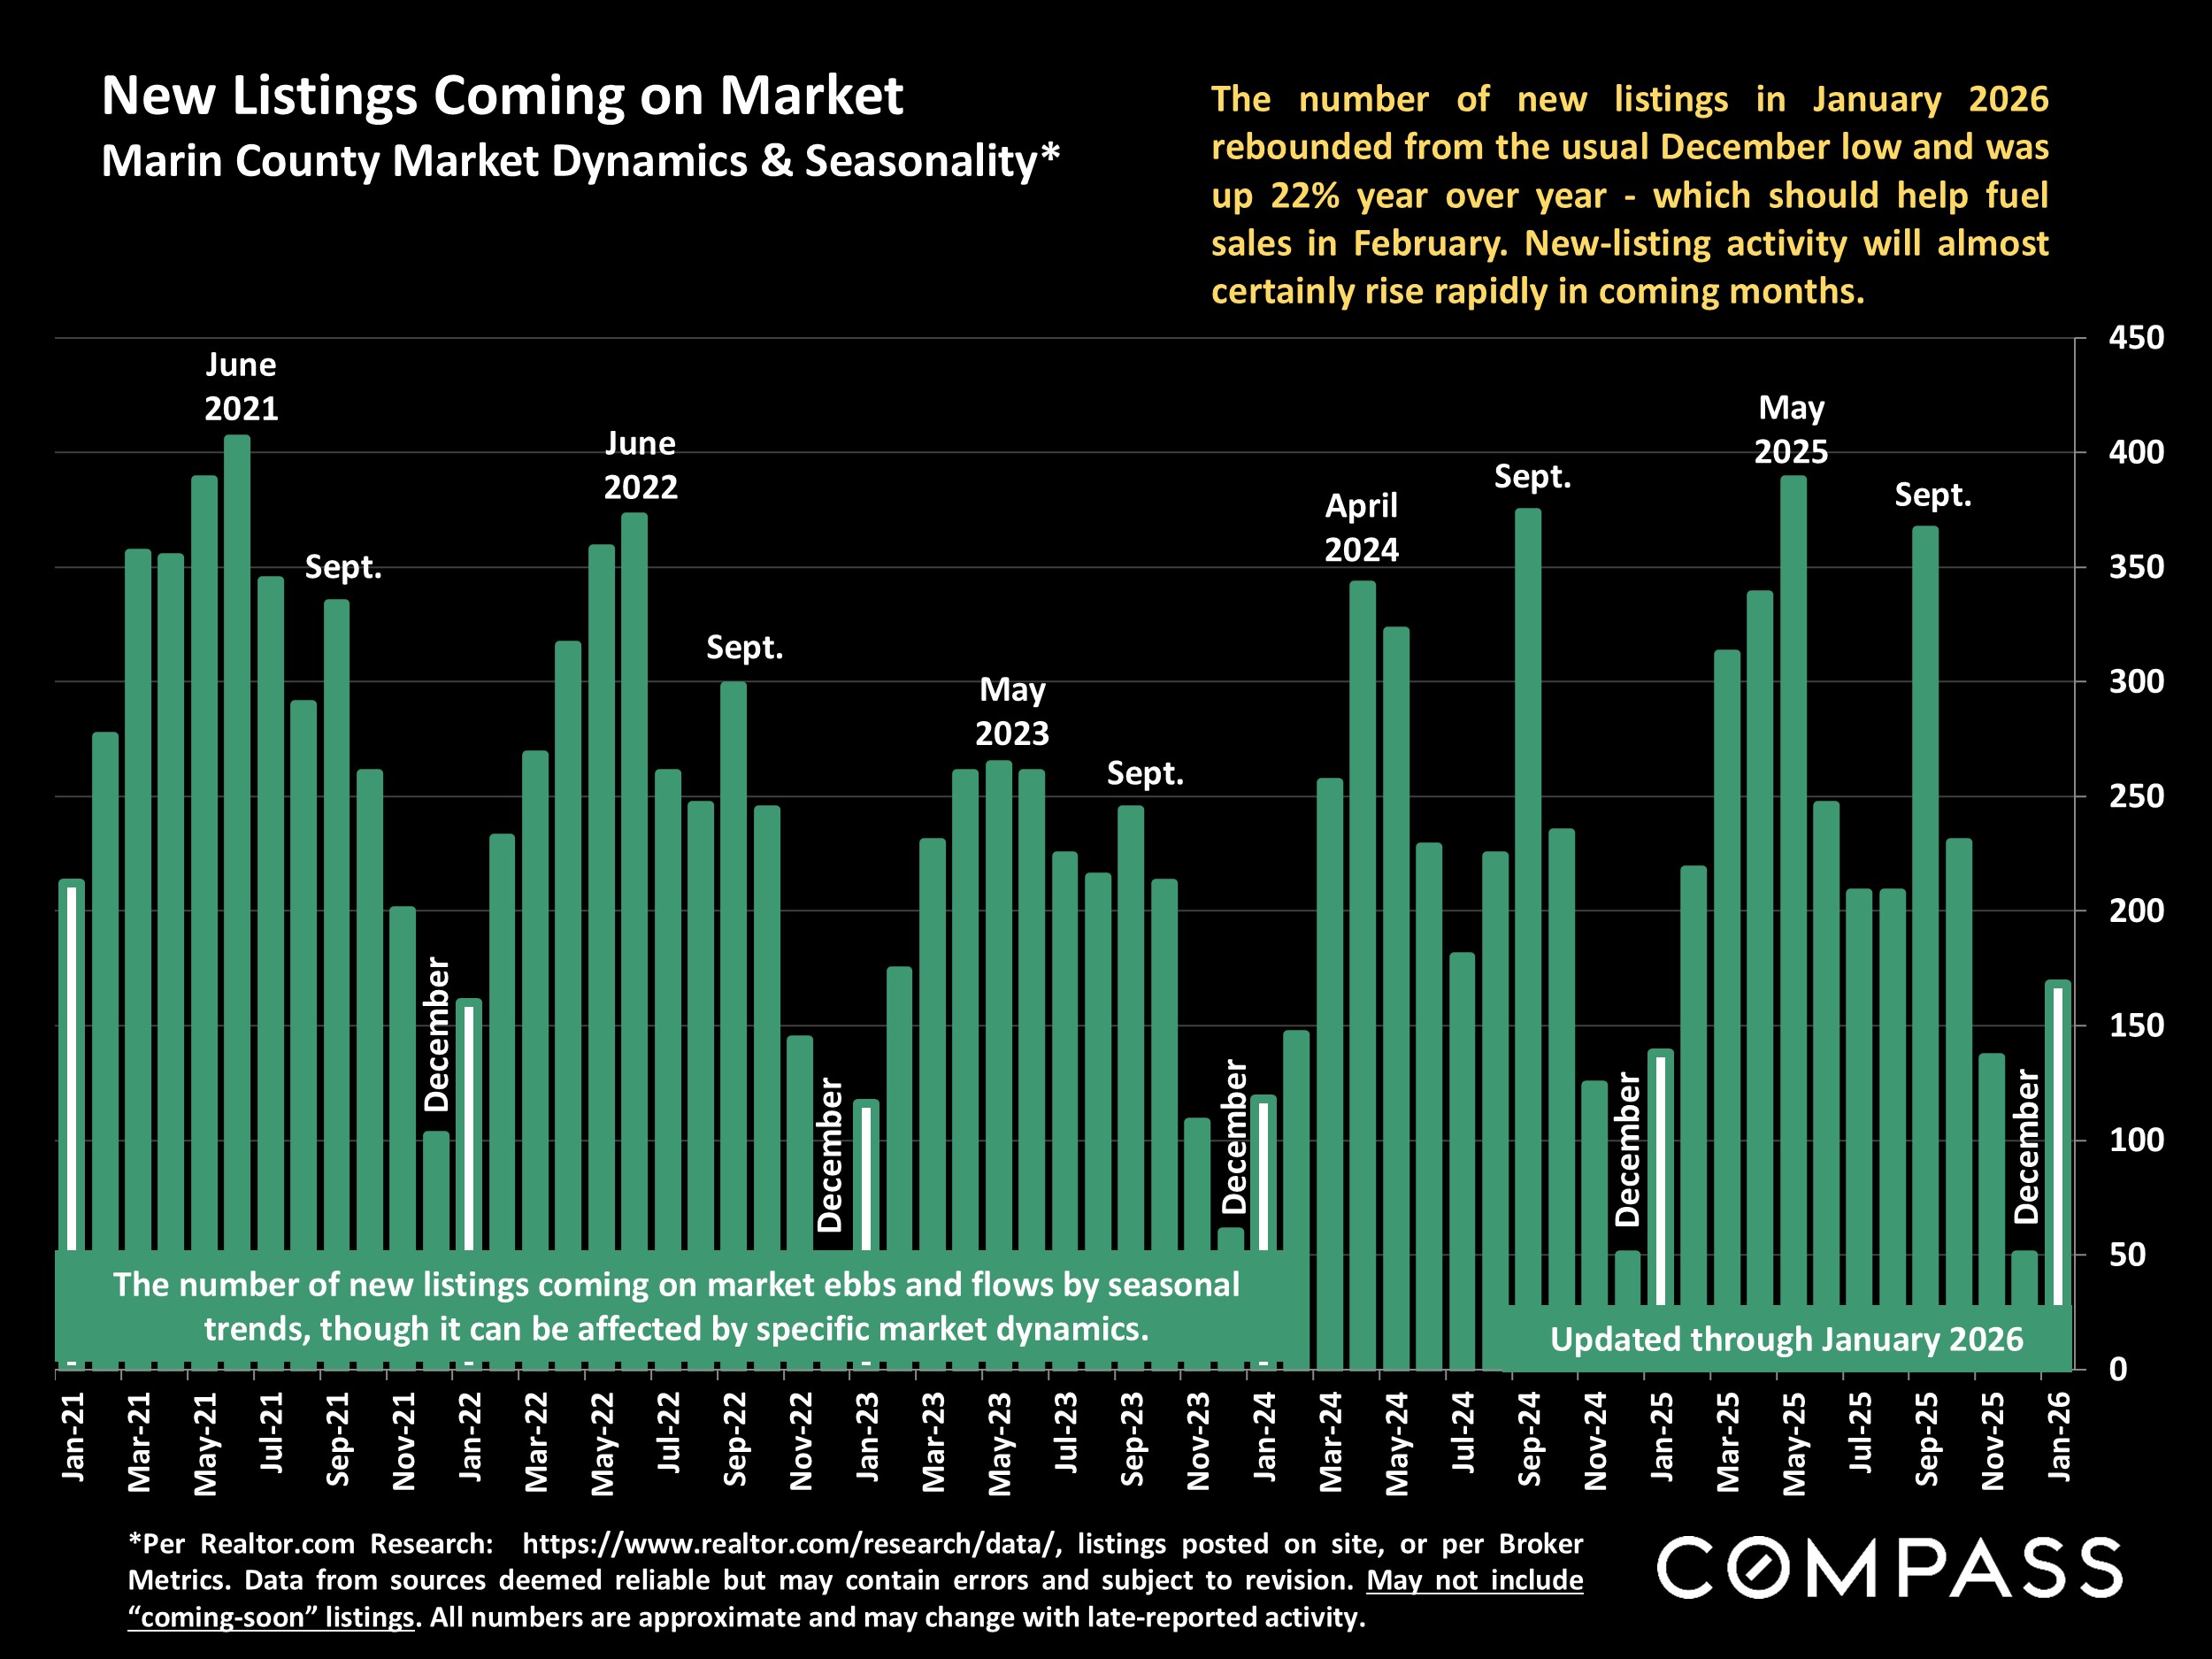
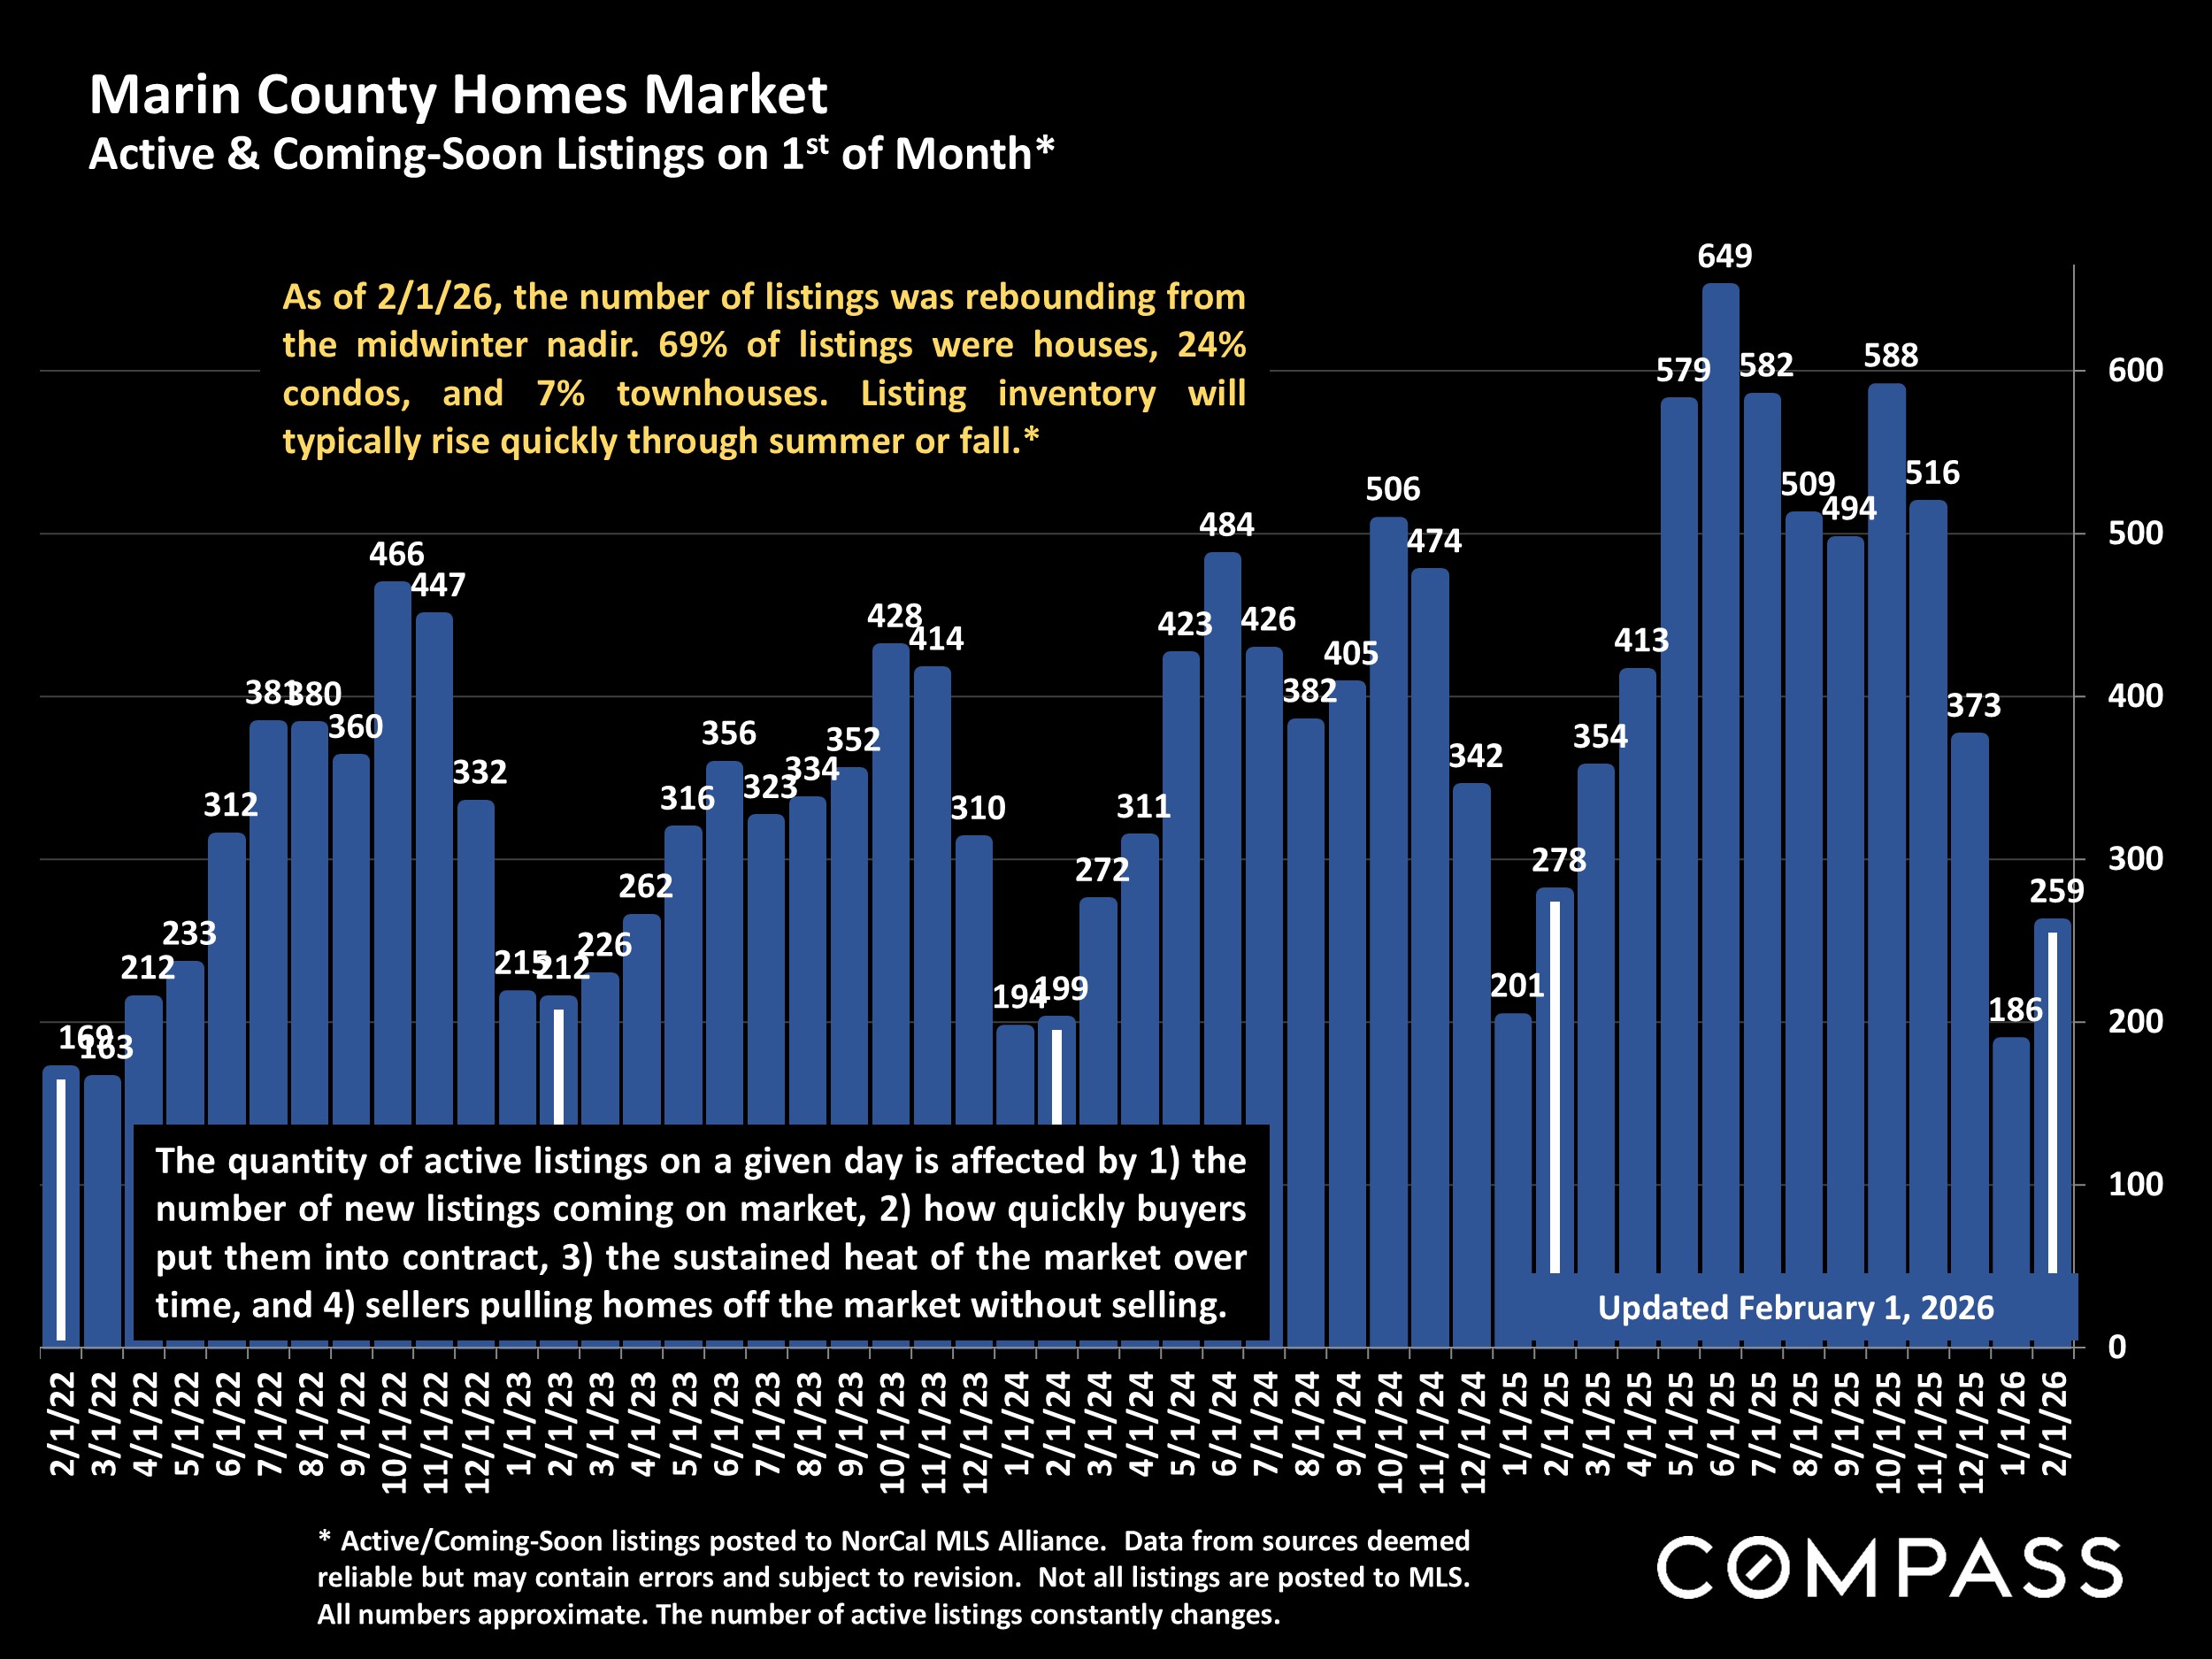
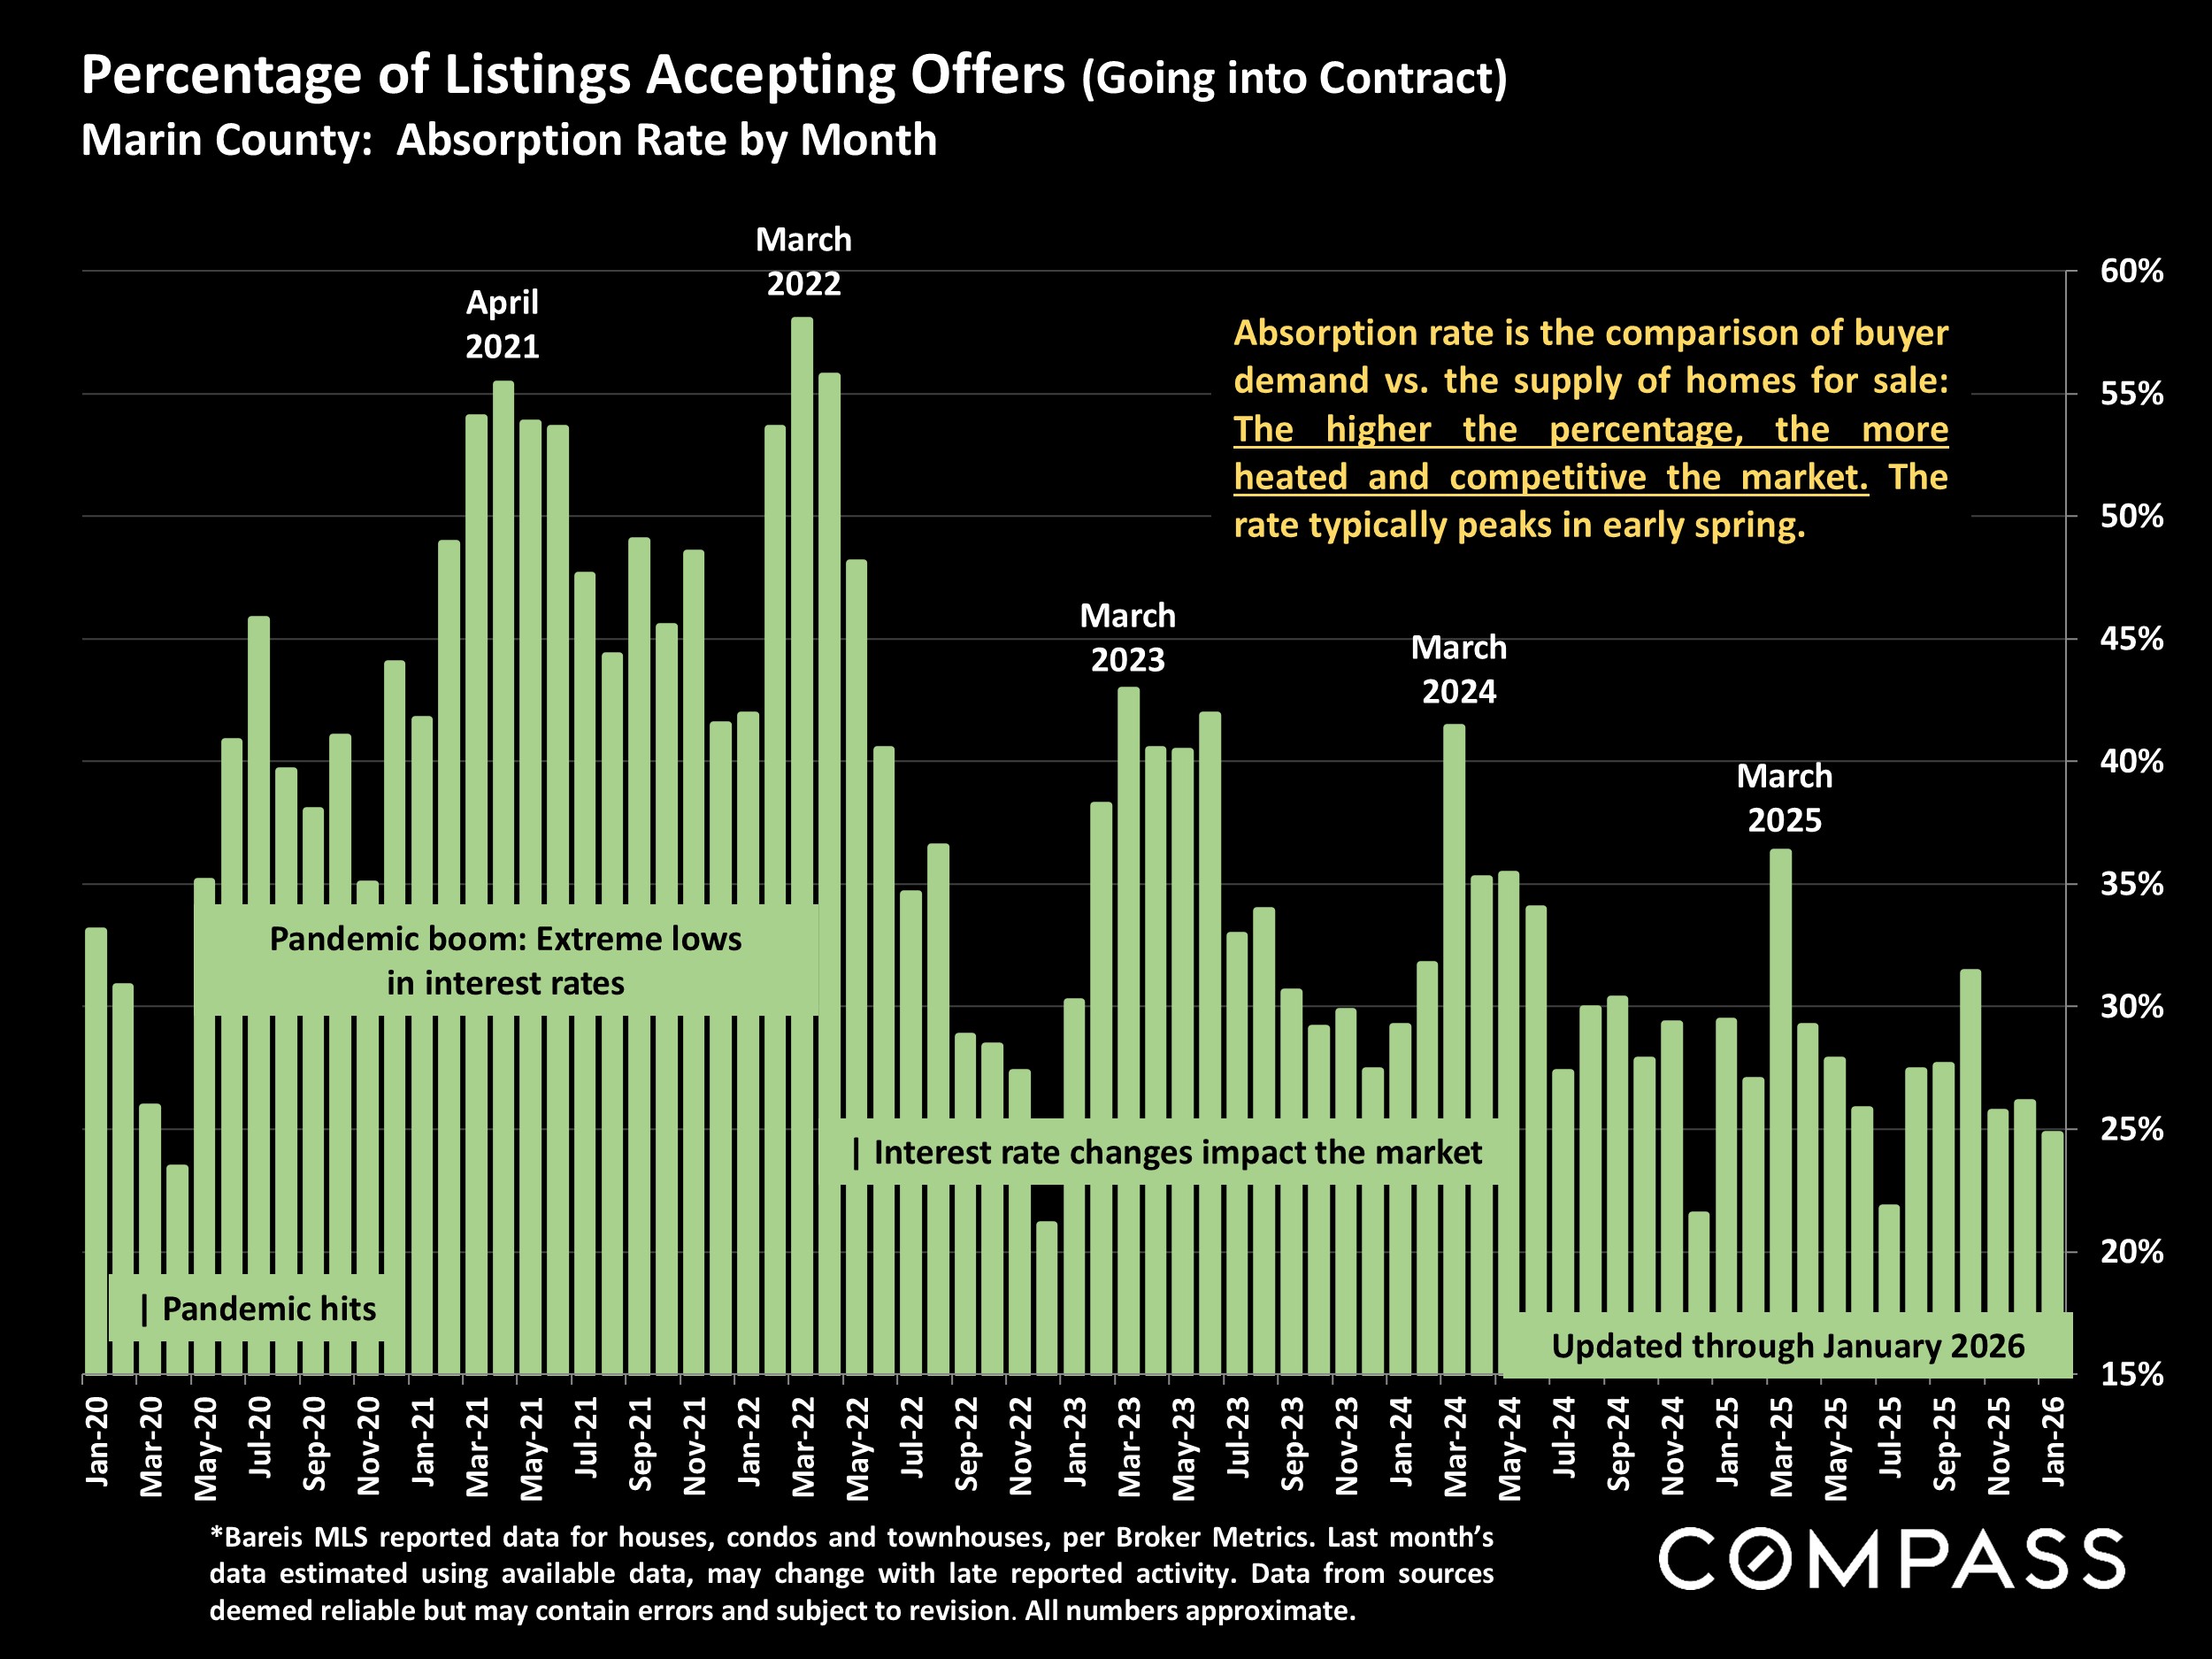
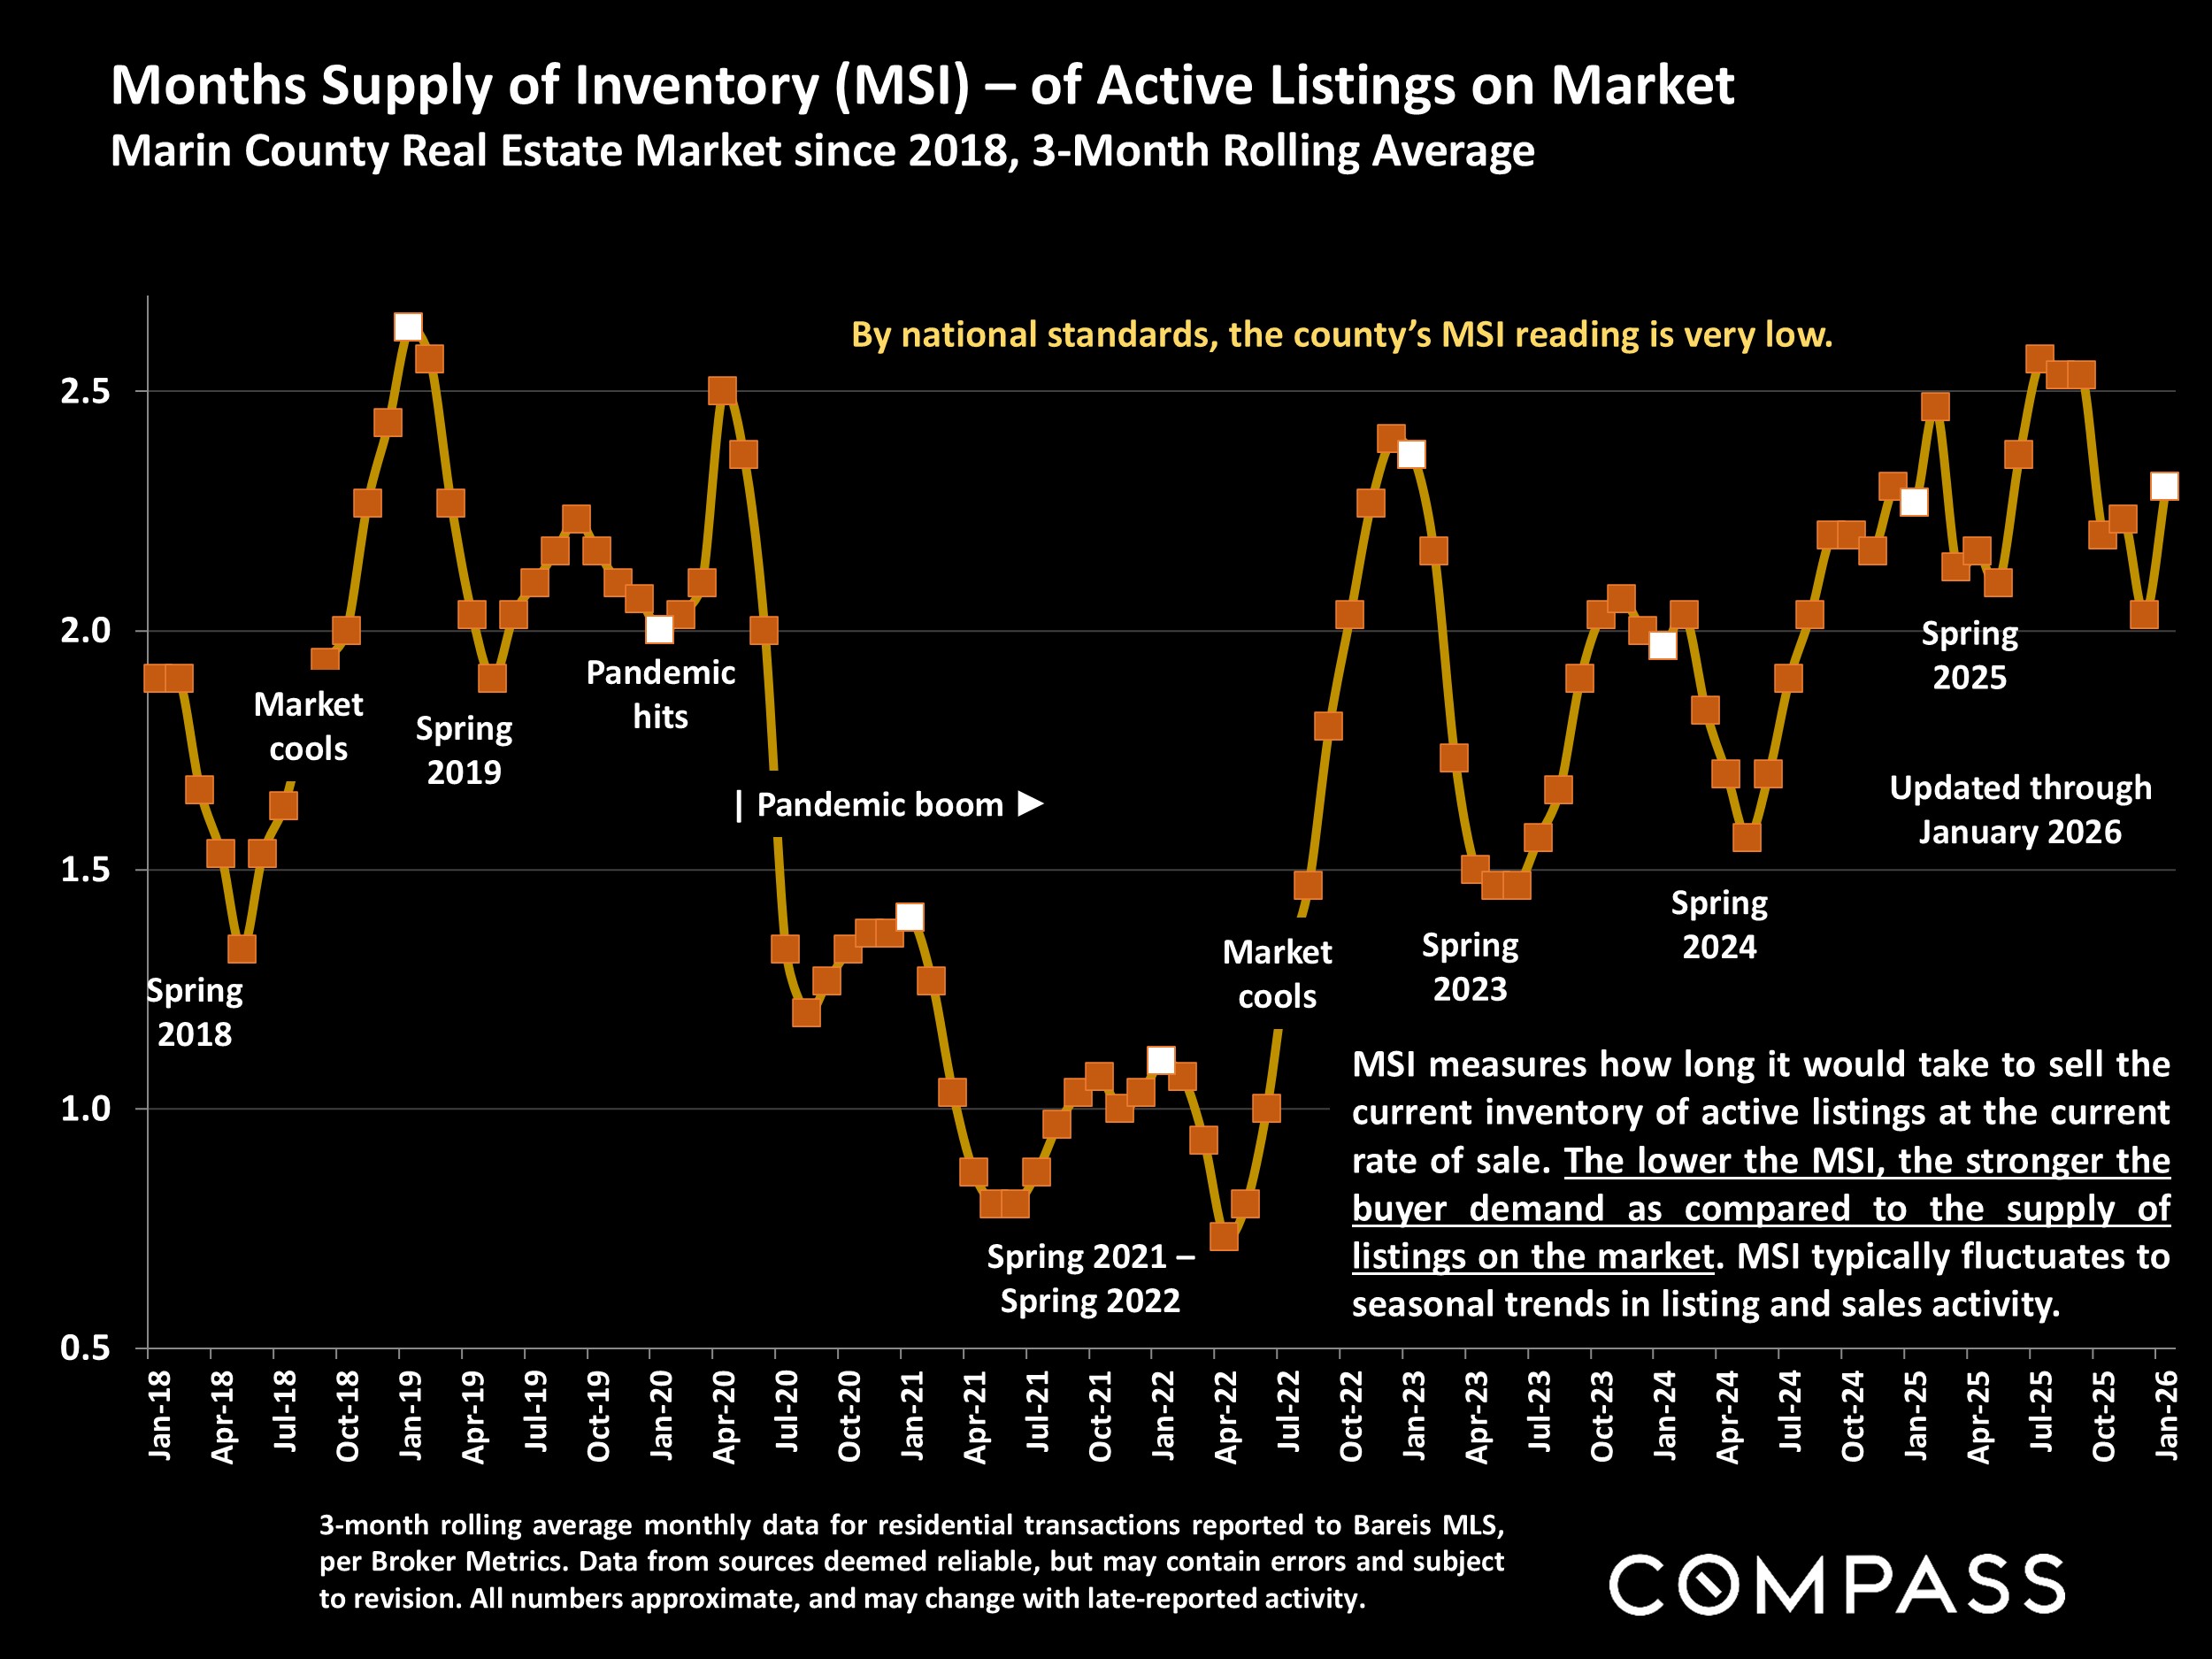
The new year's market just begins to wake up in January, but buyers typically jump in much faster than new listings arrive on the market. Though new listing activity begins to rise quickly in the last 2 weeks of January - after hitting its annual low count in December - it still lags buyer demand. So right from the start of the year, there is a dynamic of increasing demand competing for an insufficient supply of listings, and competition, normally characterized by fast sales and overbidding of asking prices, is the biggest factor in home-price appreciation.

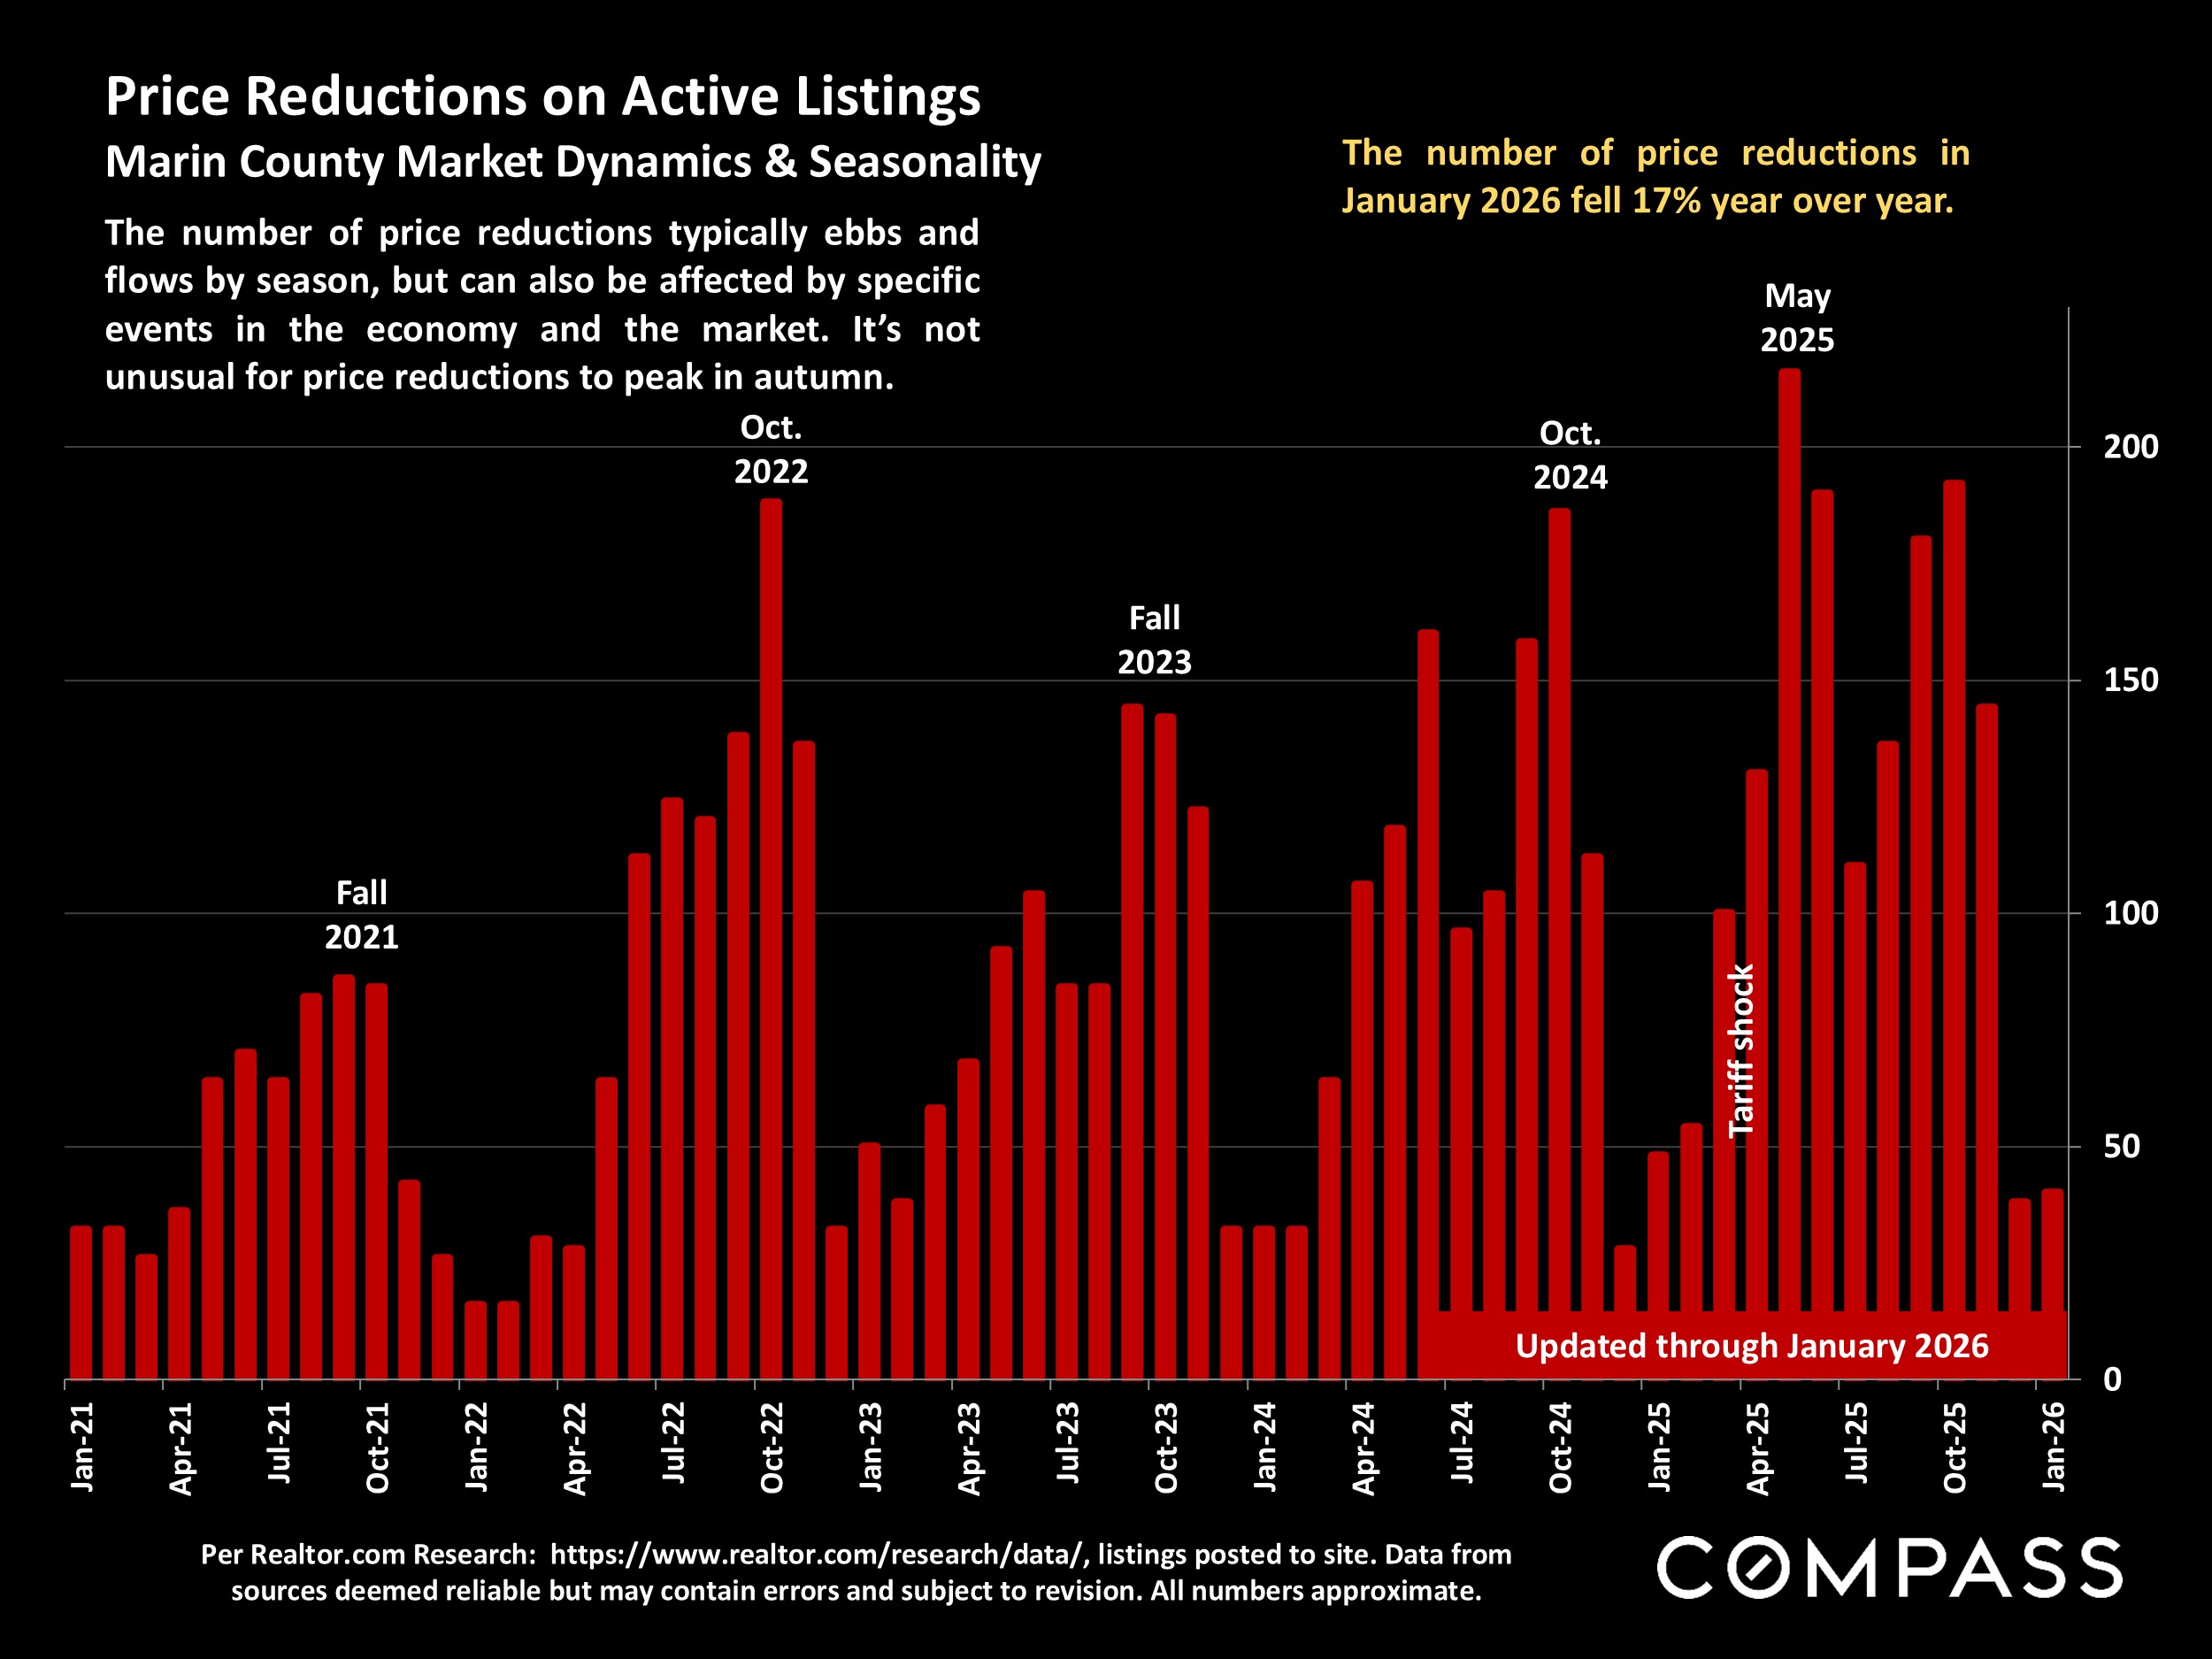
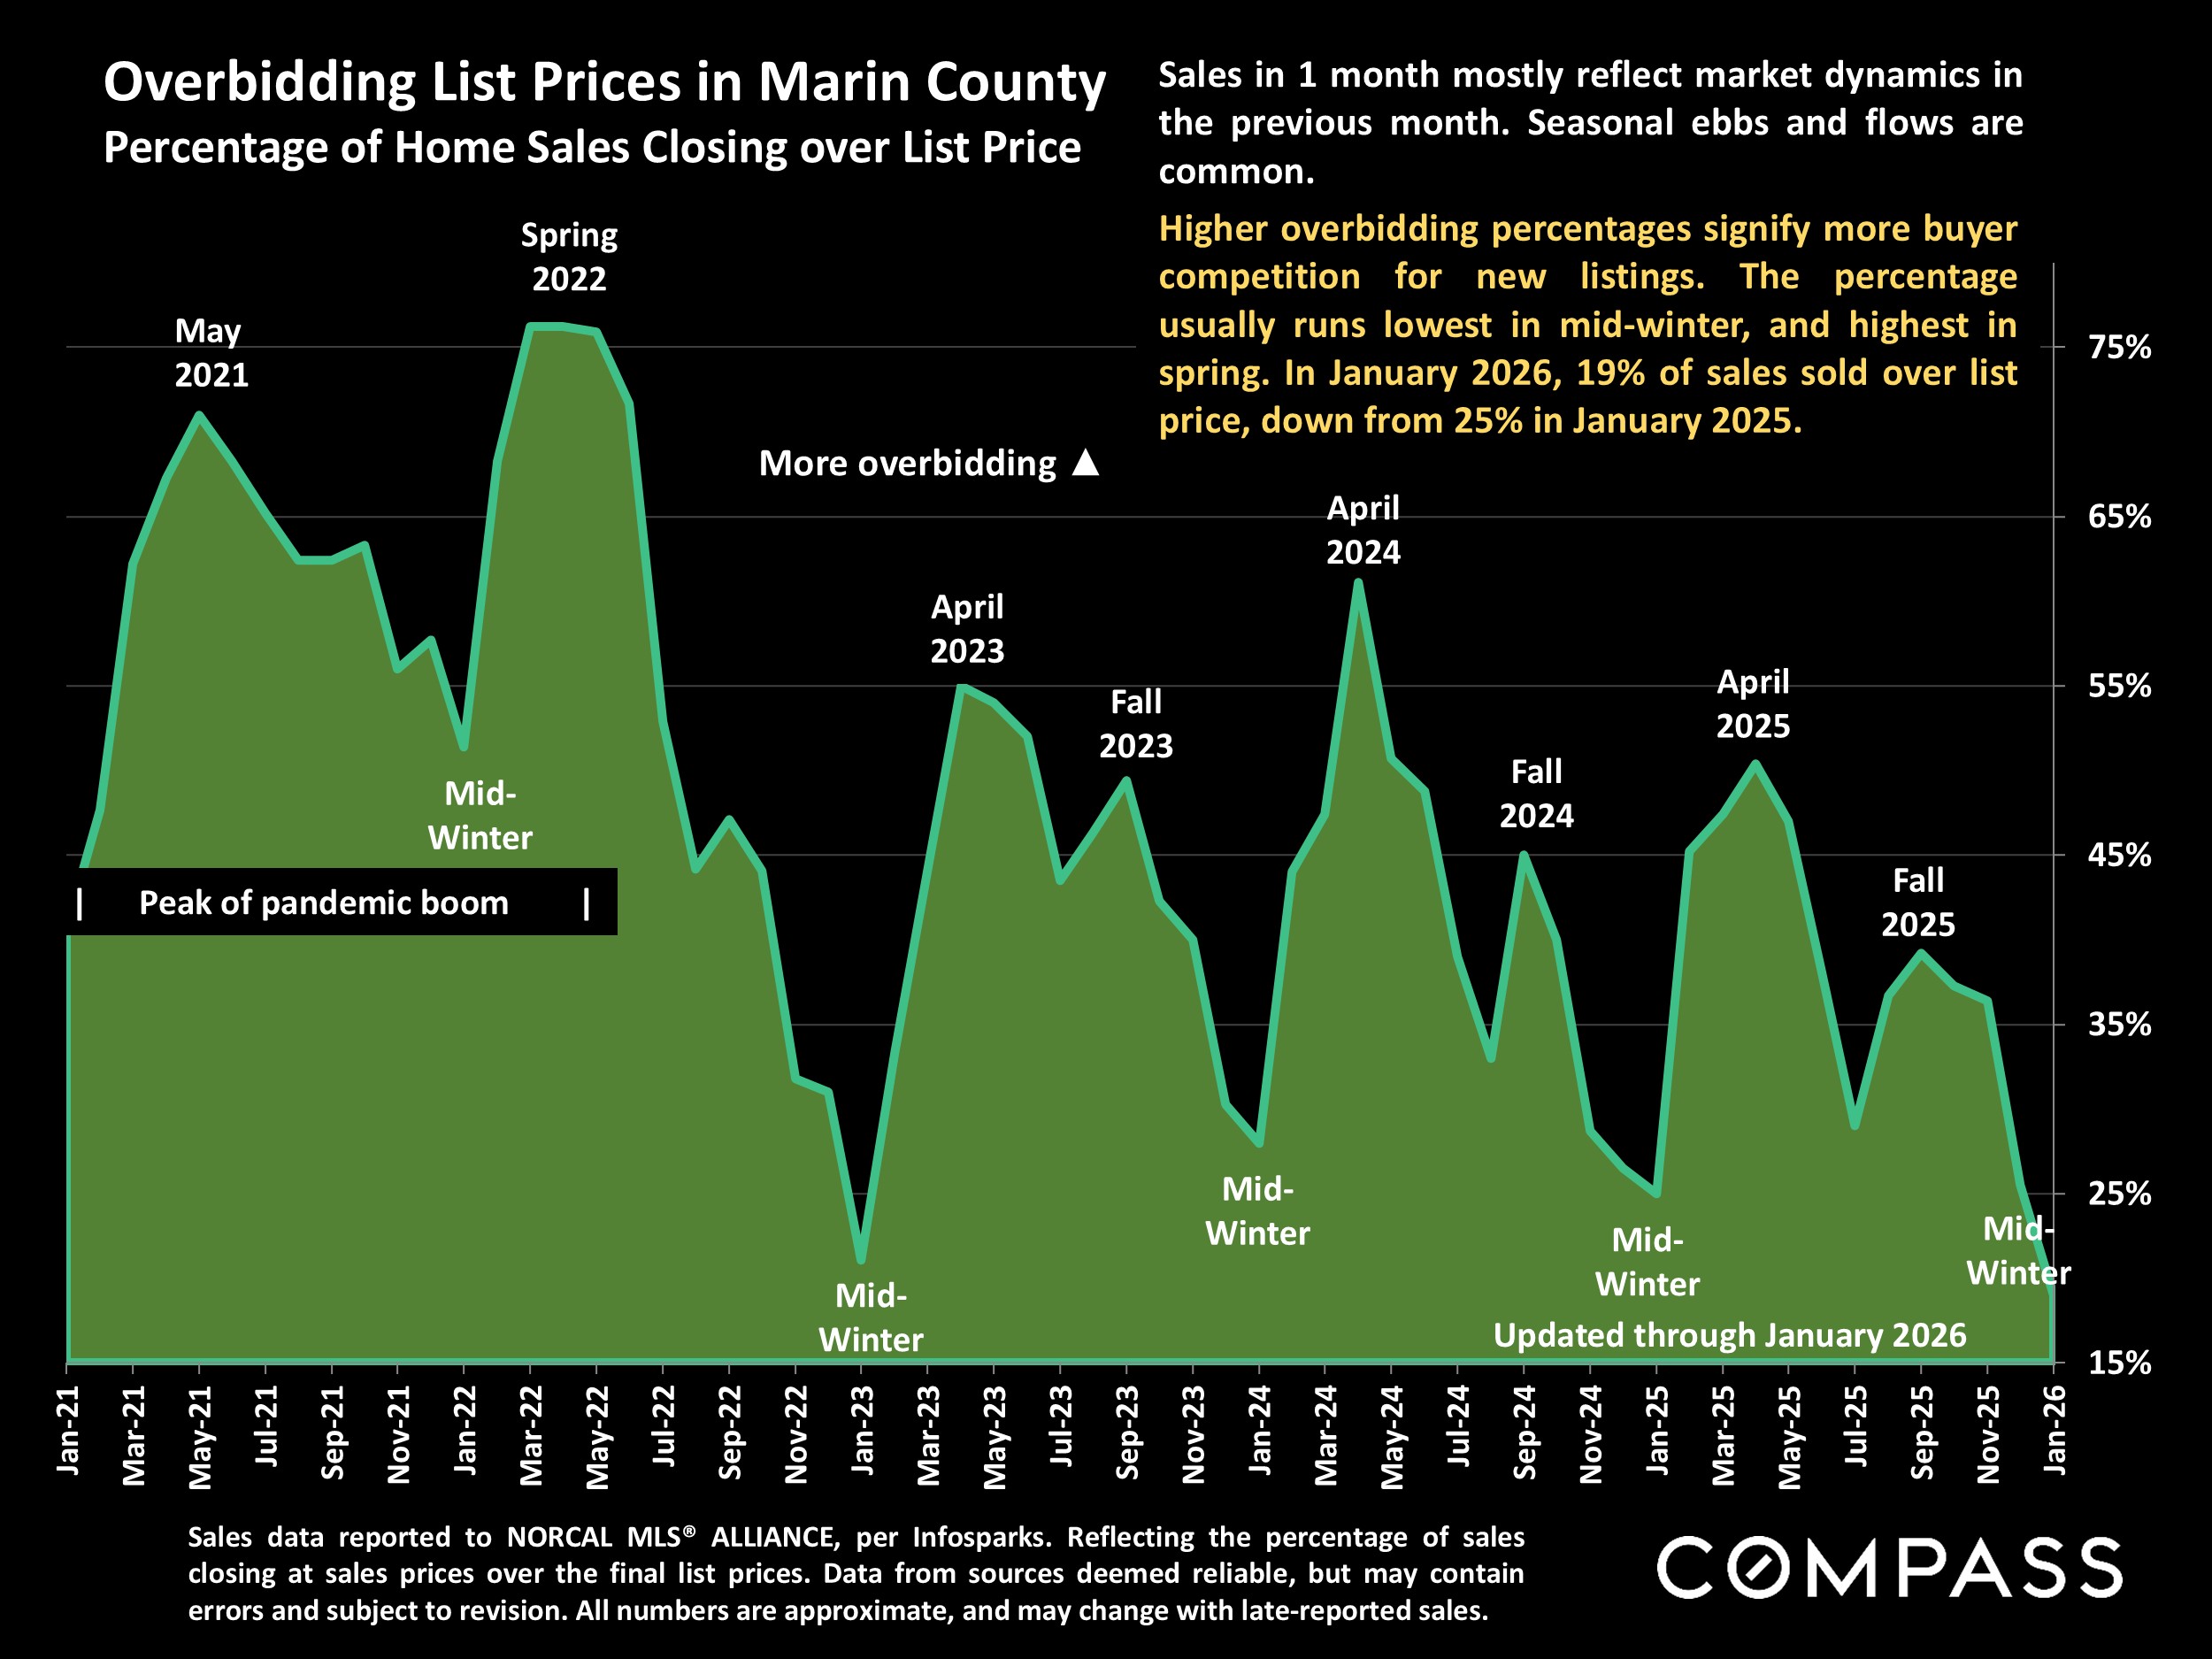
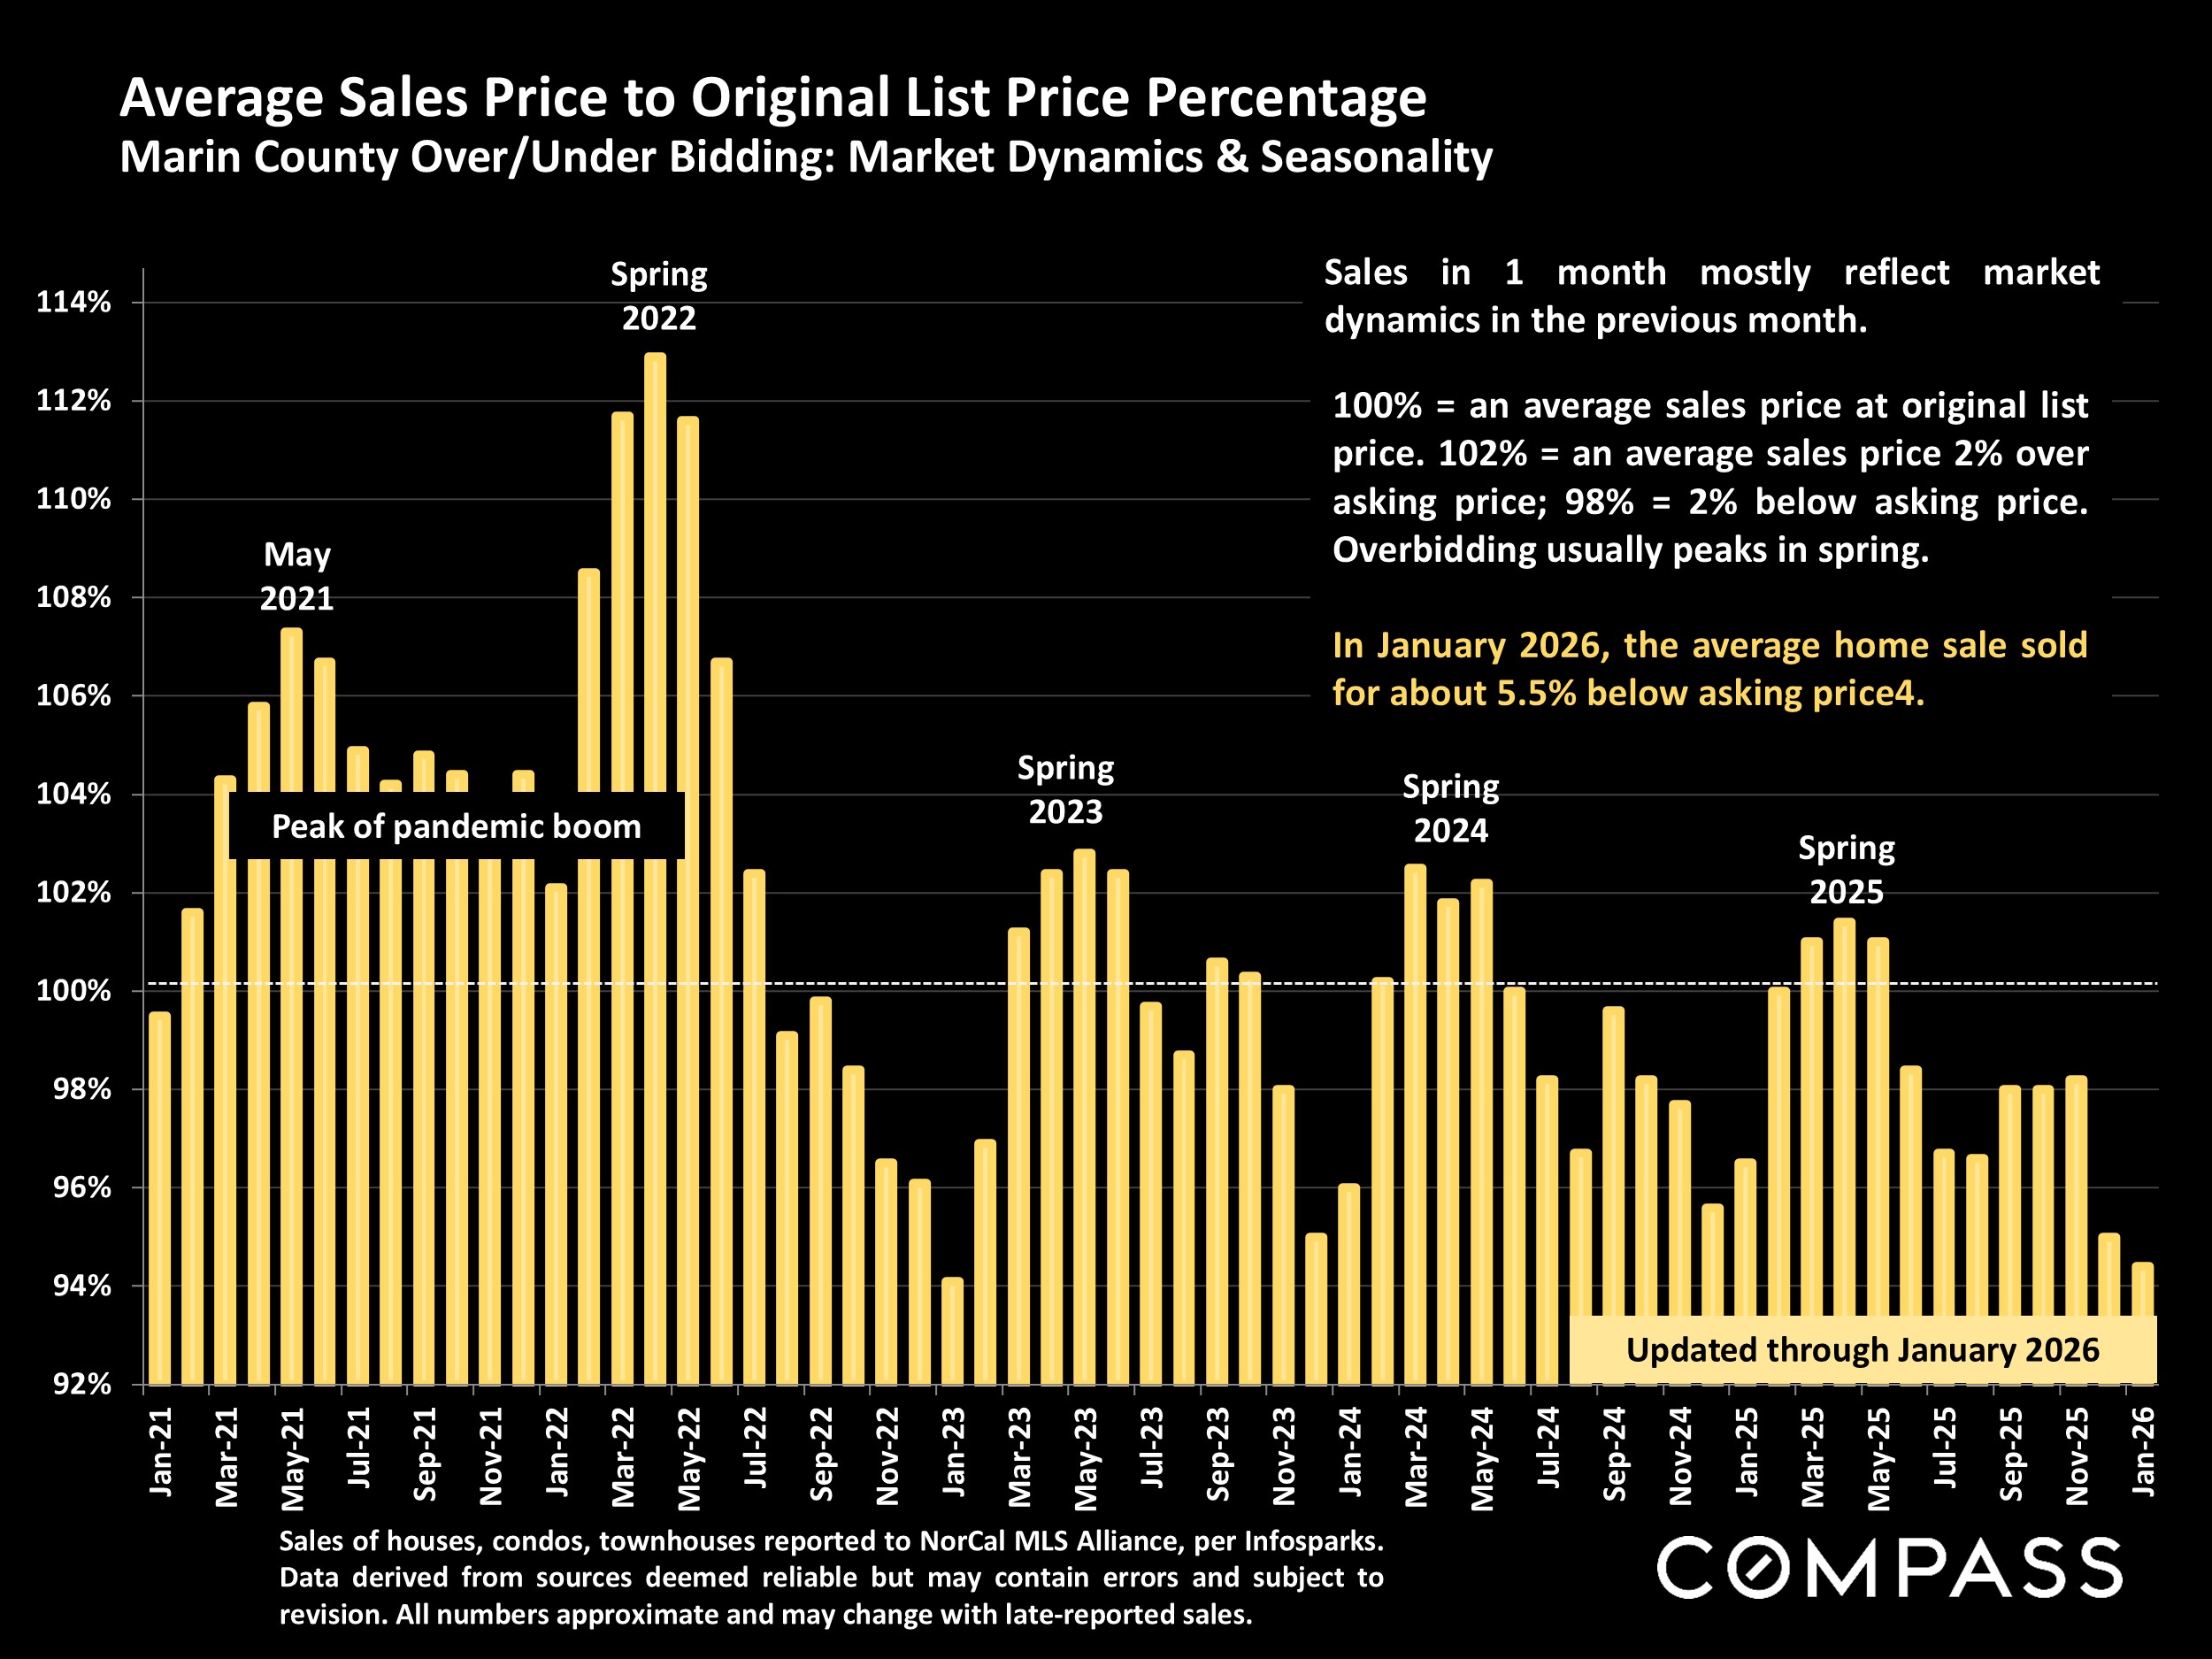
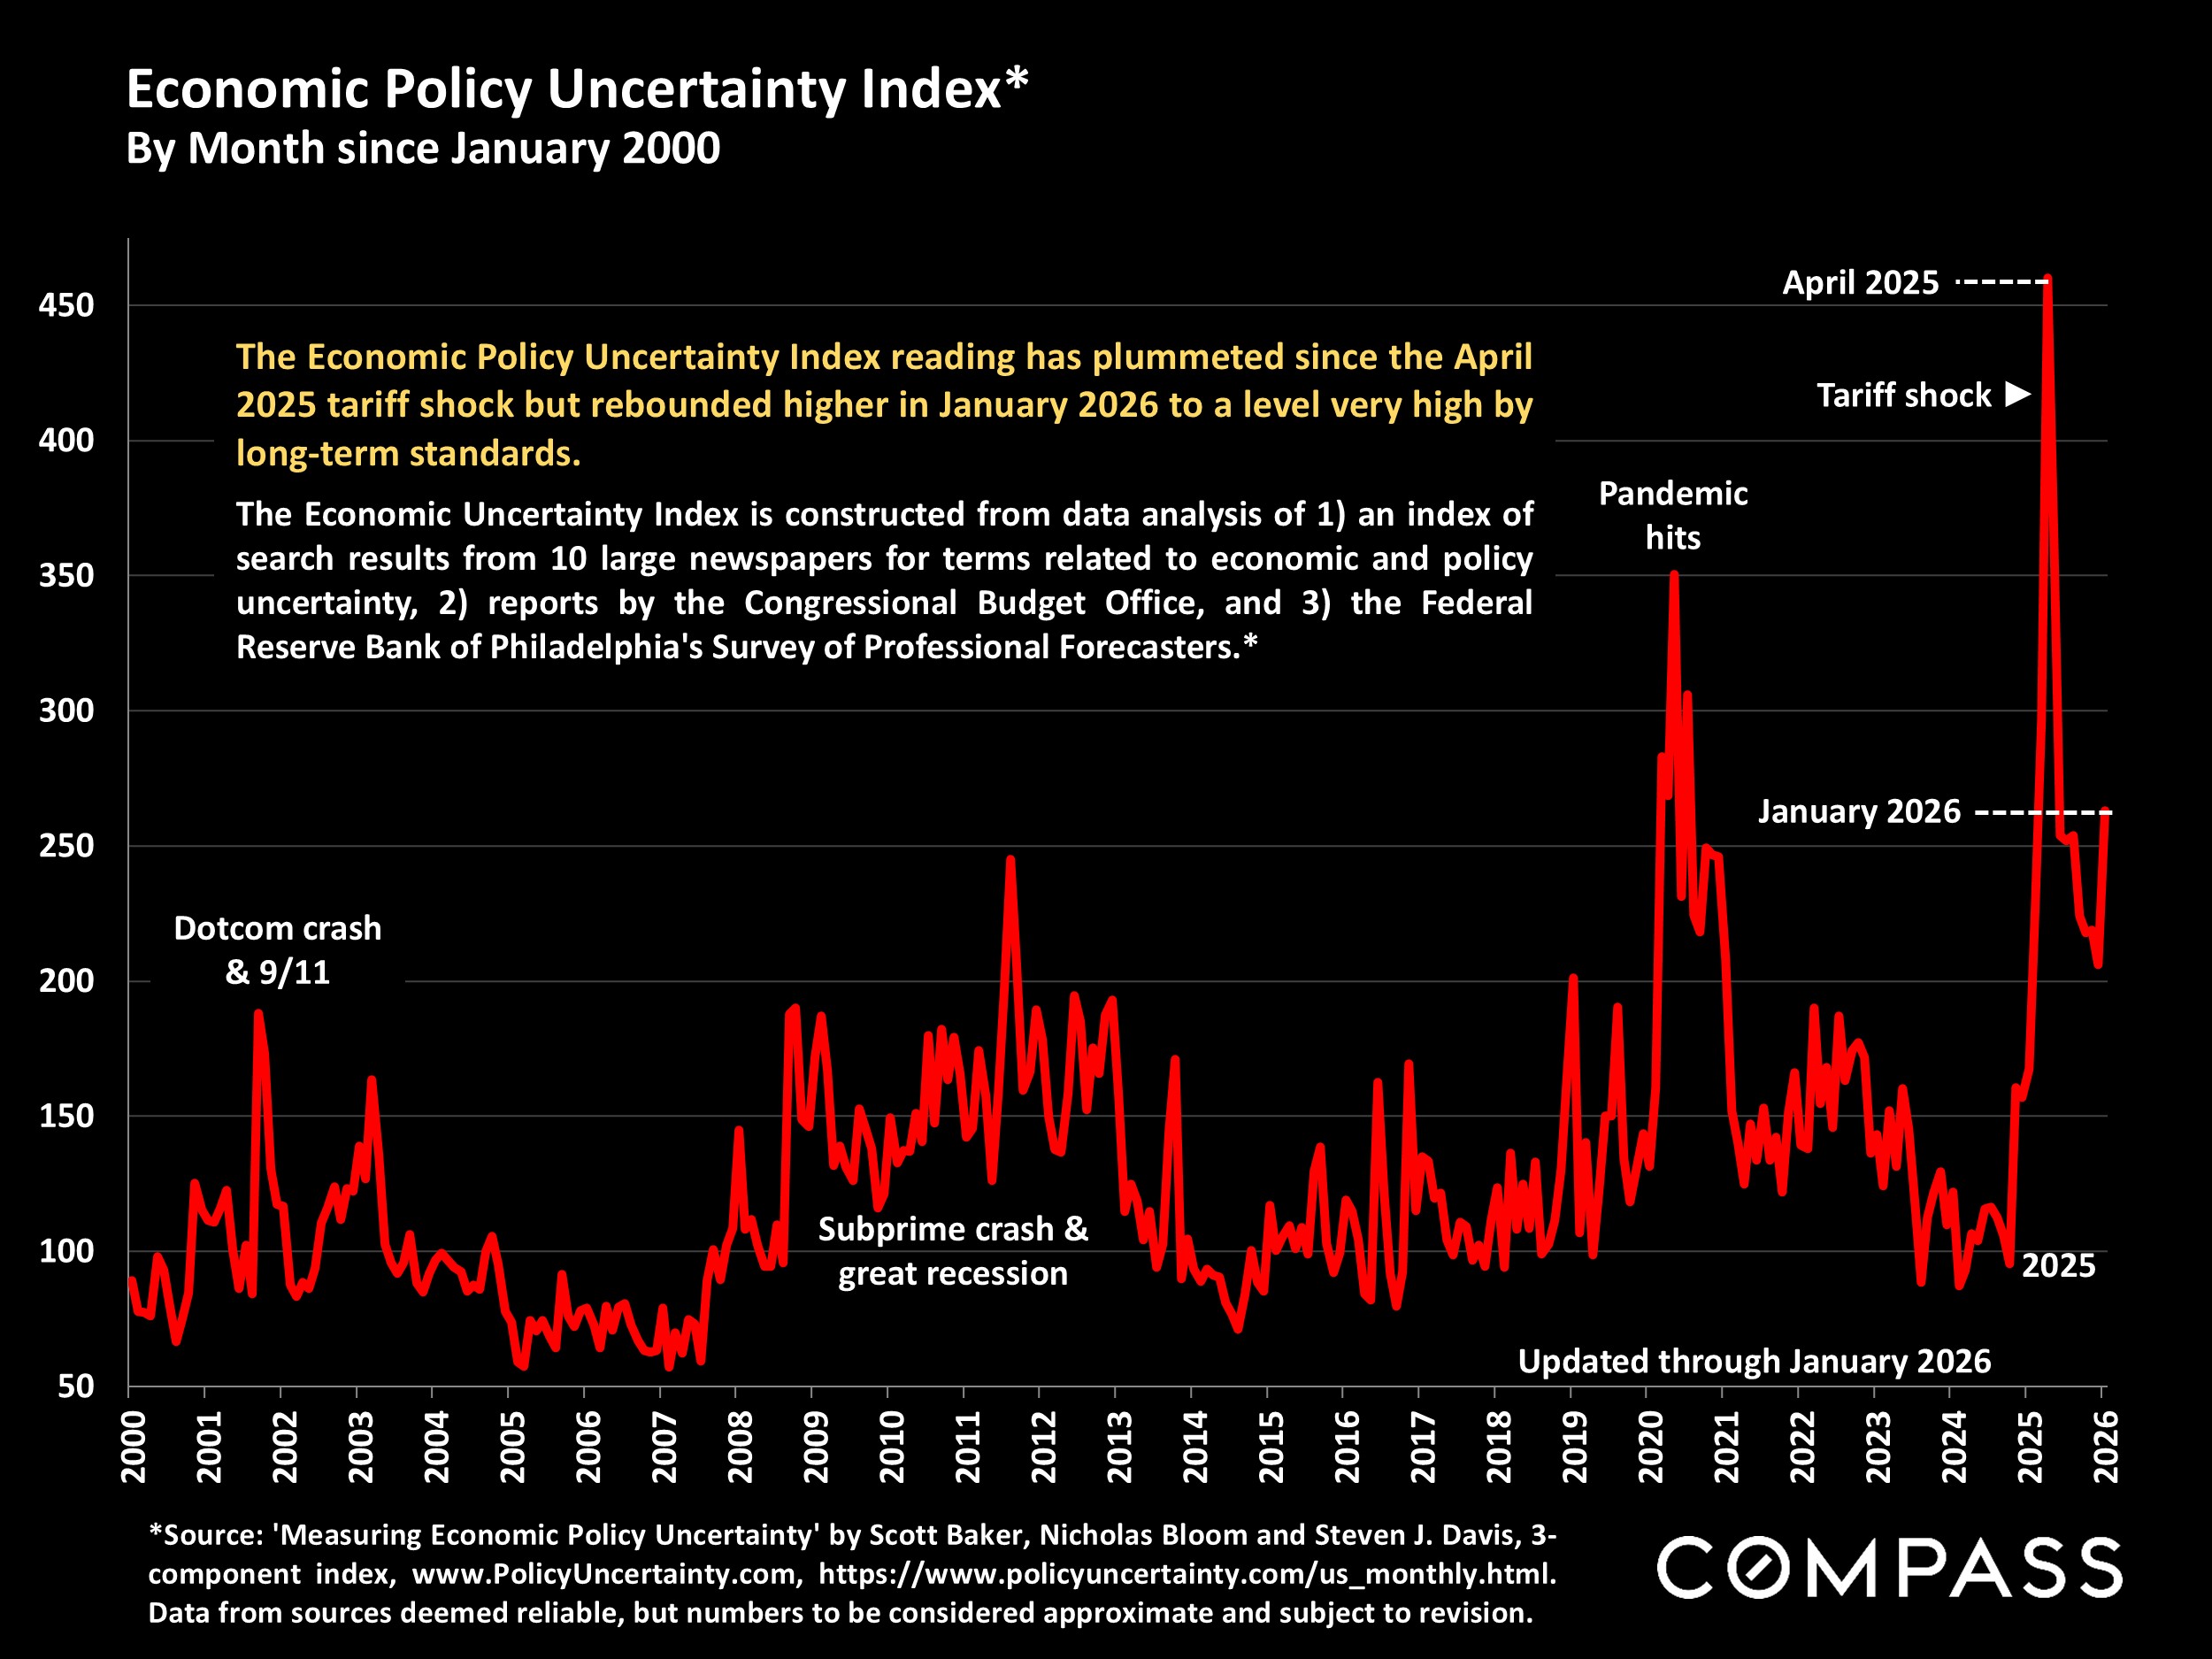
This imbalance in supply and demand commonly runs through the spring months, making them the most heated selling season of the year: This is illustrated in almost all the standard measures of market conditions. (Last year, this seasonal dynamic had the wind sucked out of it by the tariff shock.) In the Bay Area, the "spring" market often begins in February.

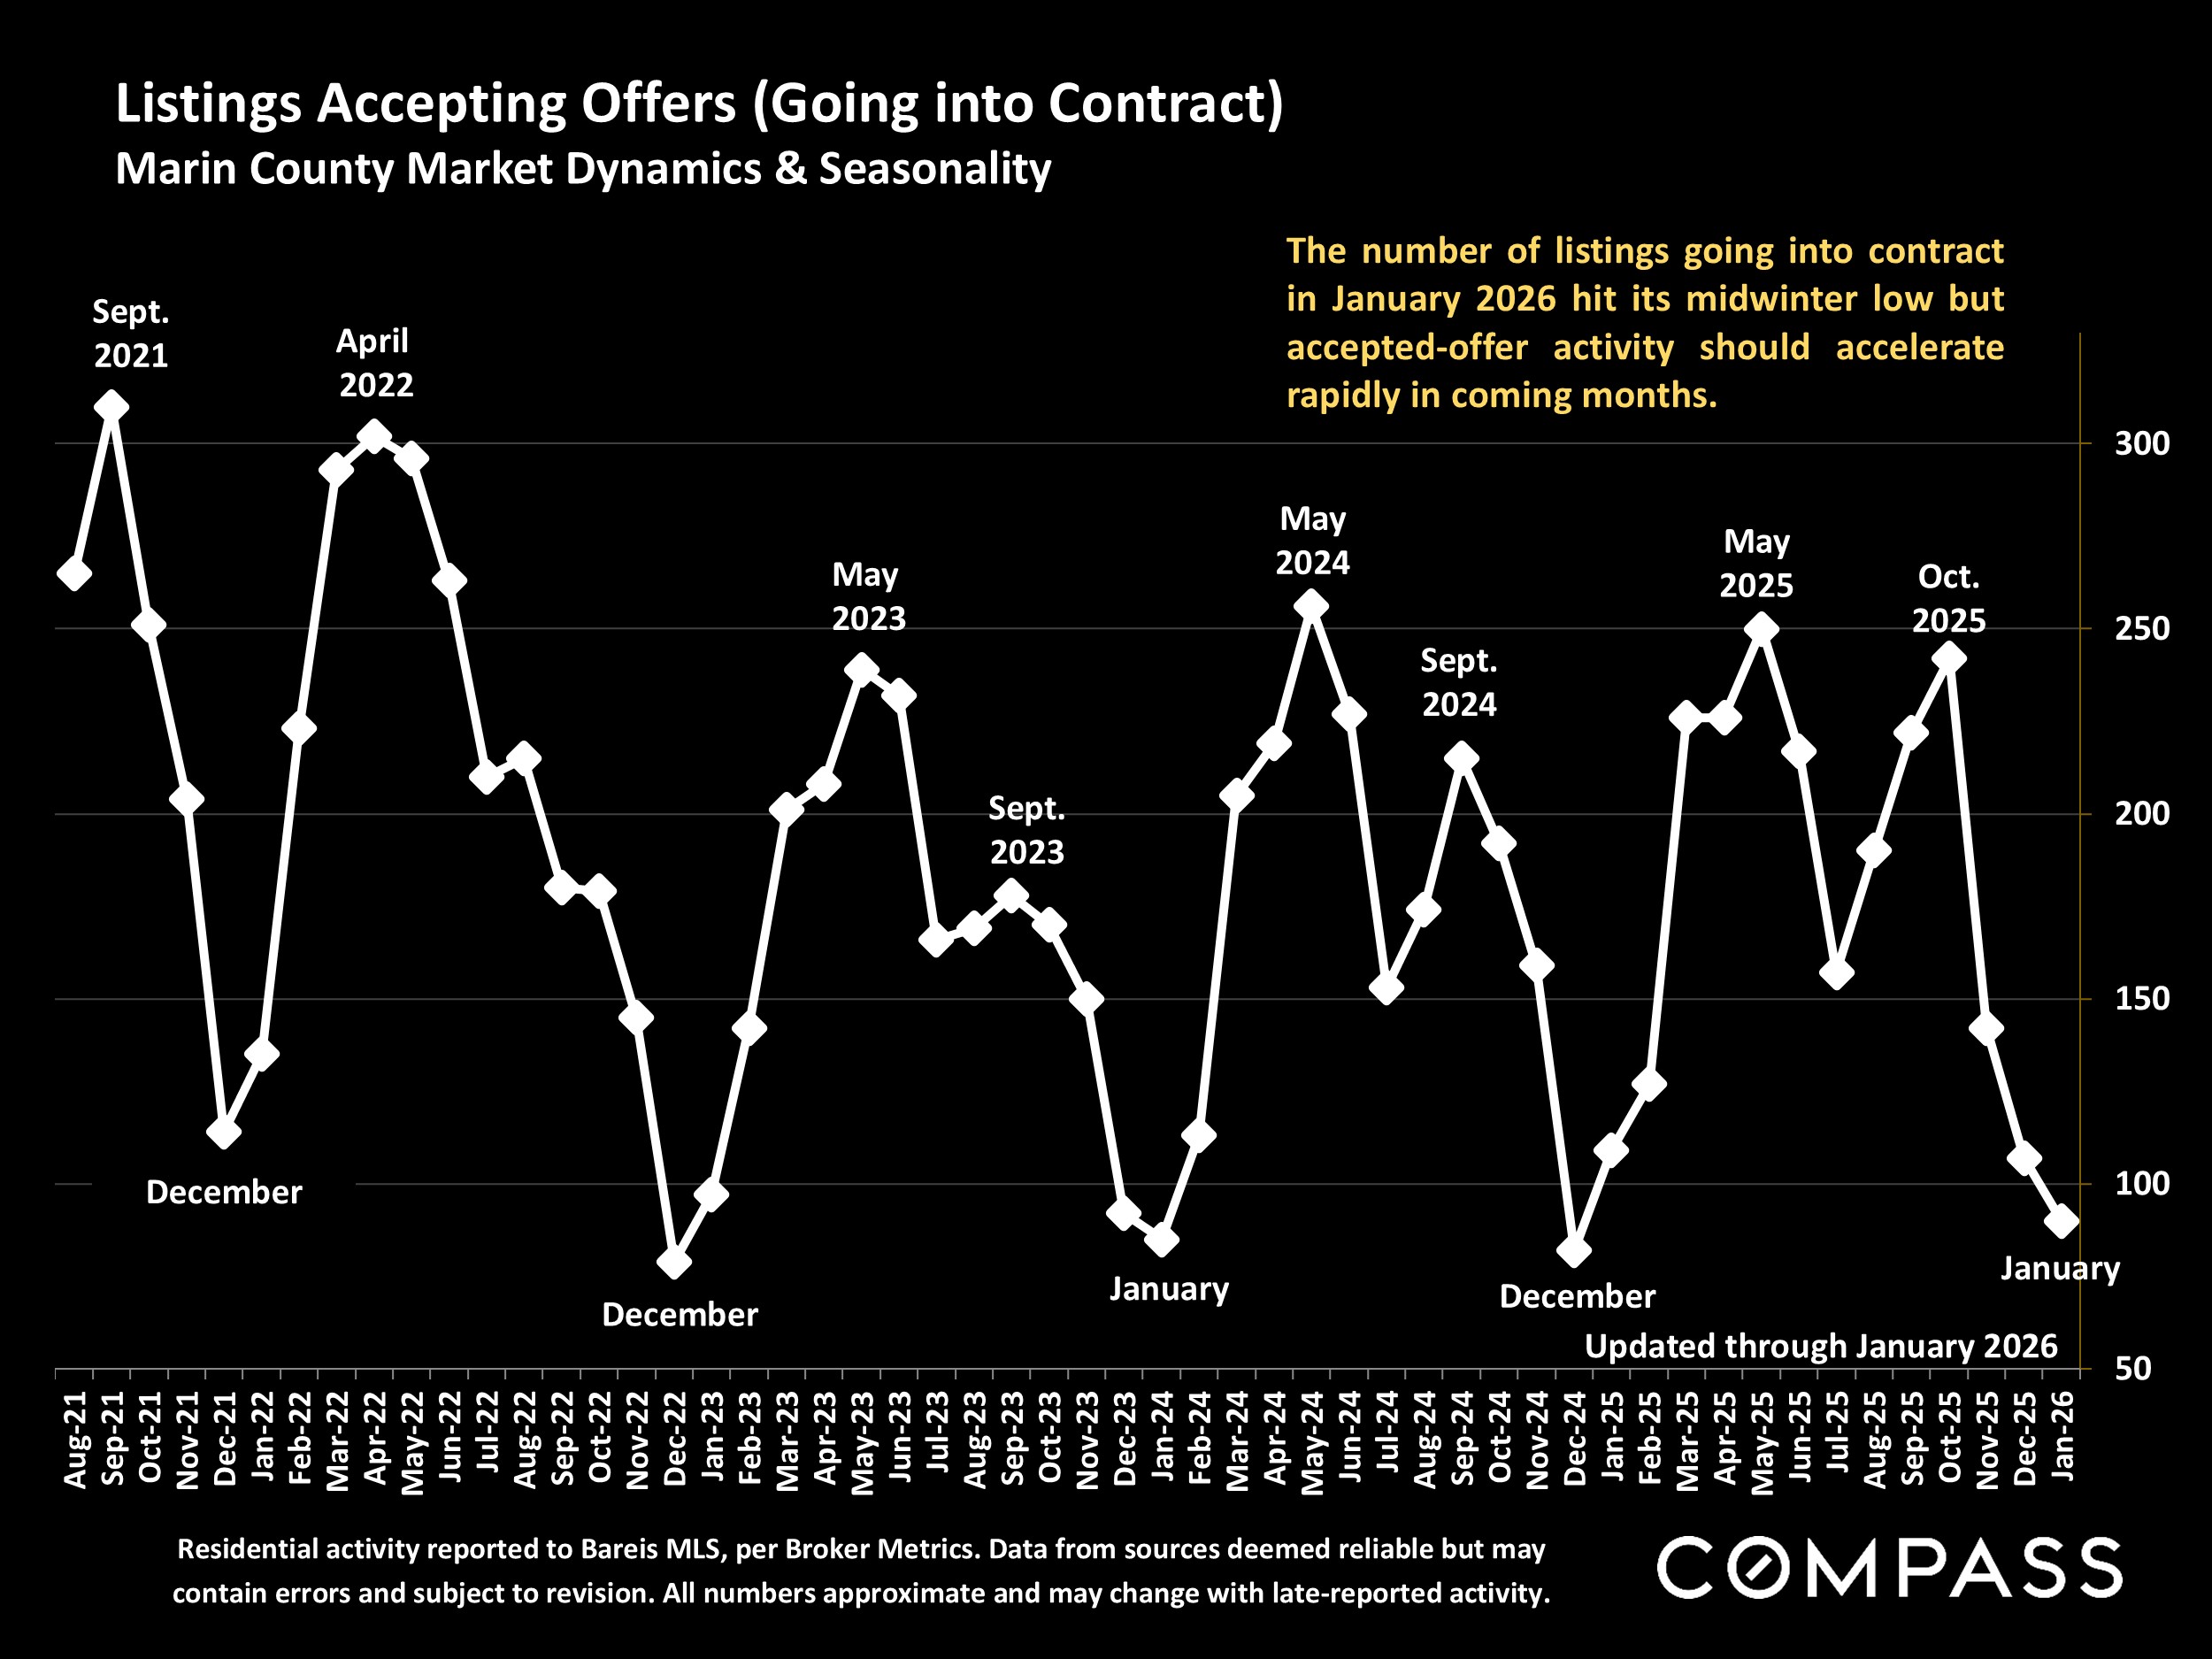
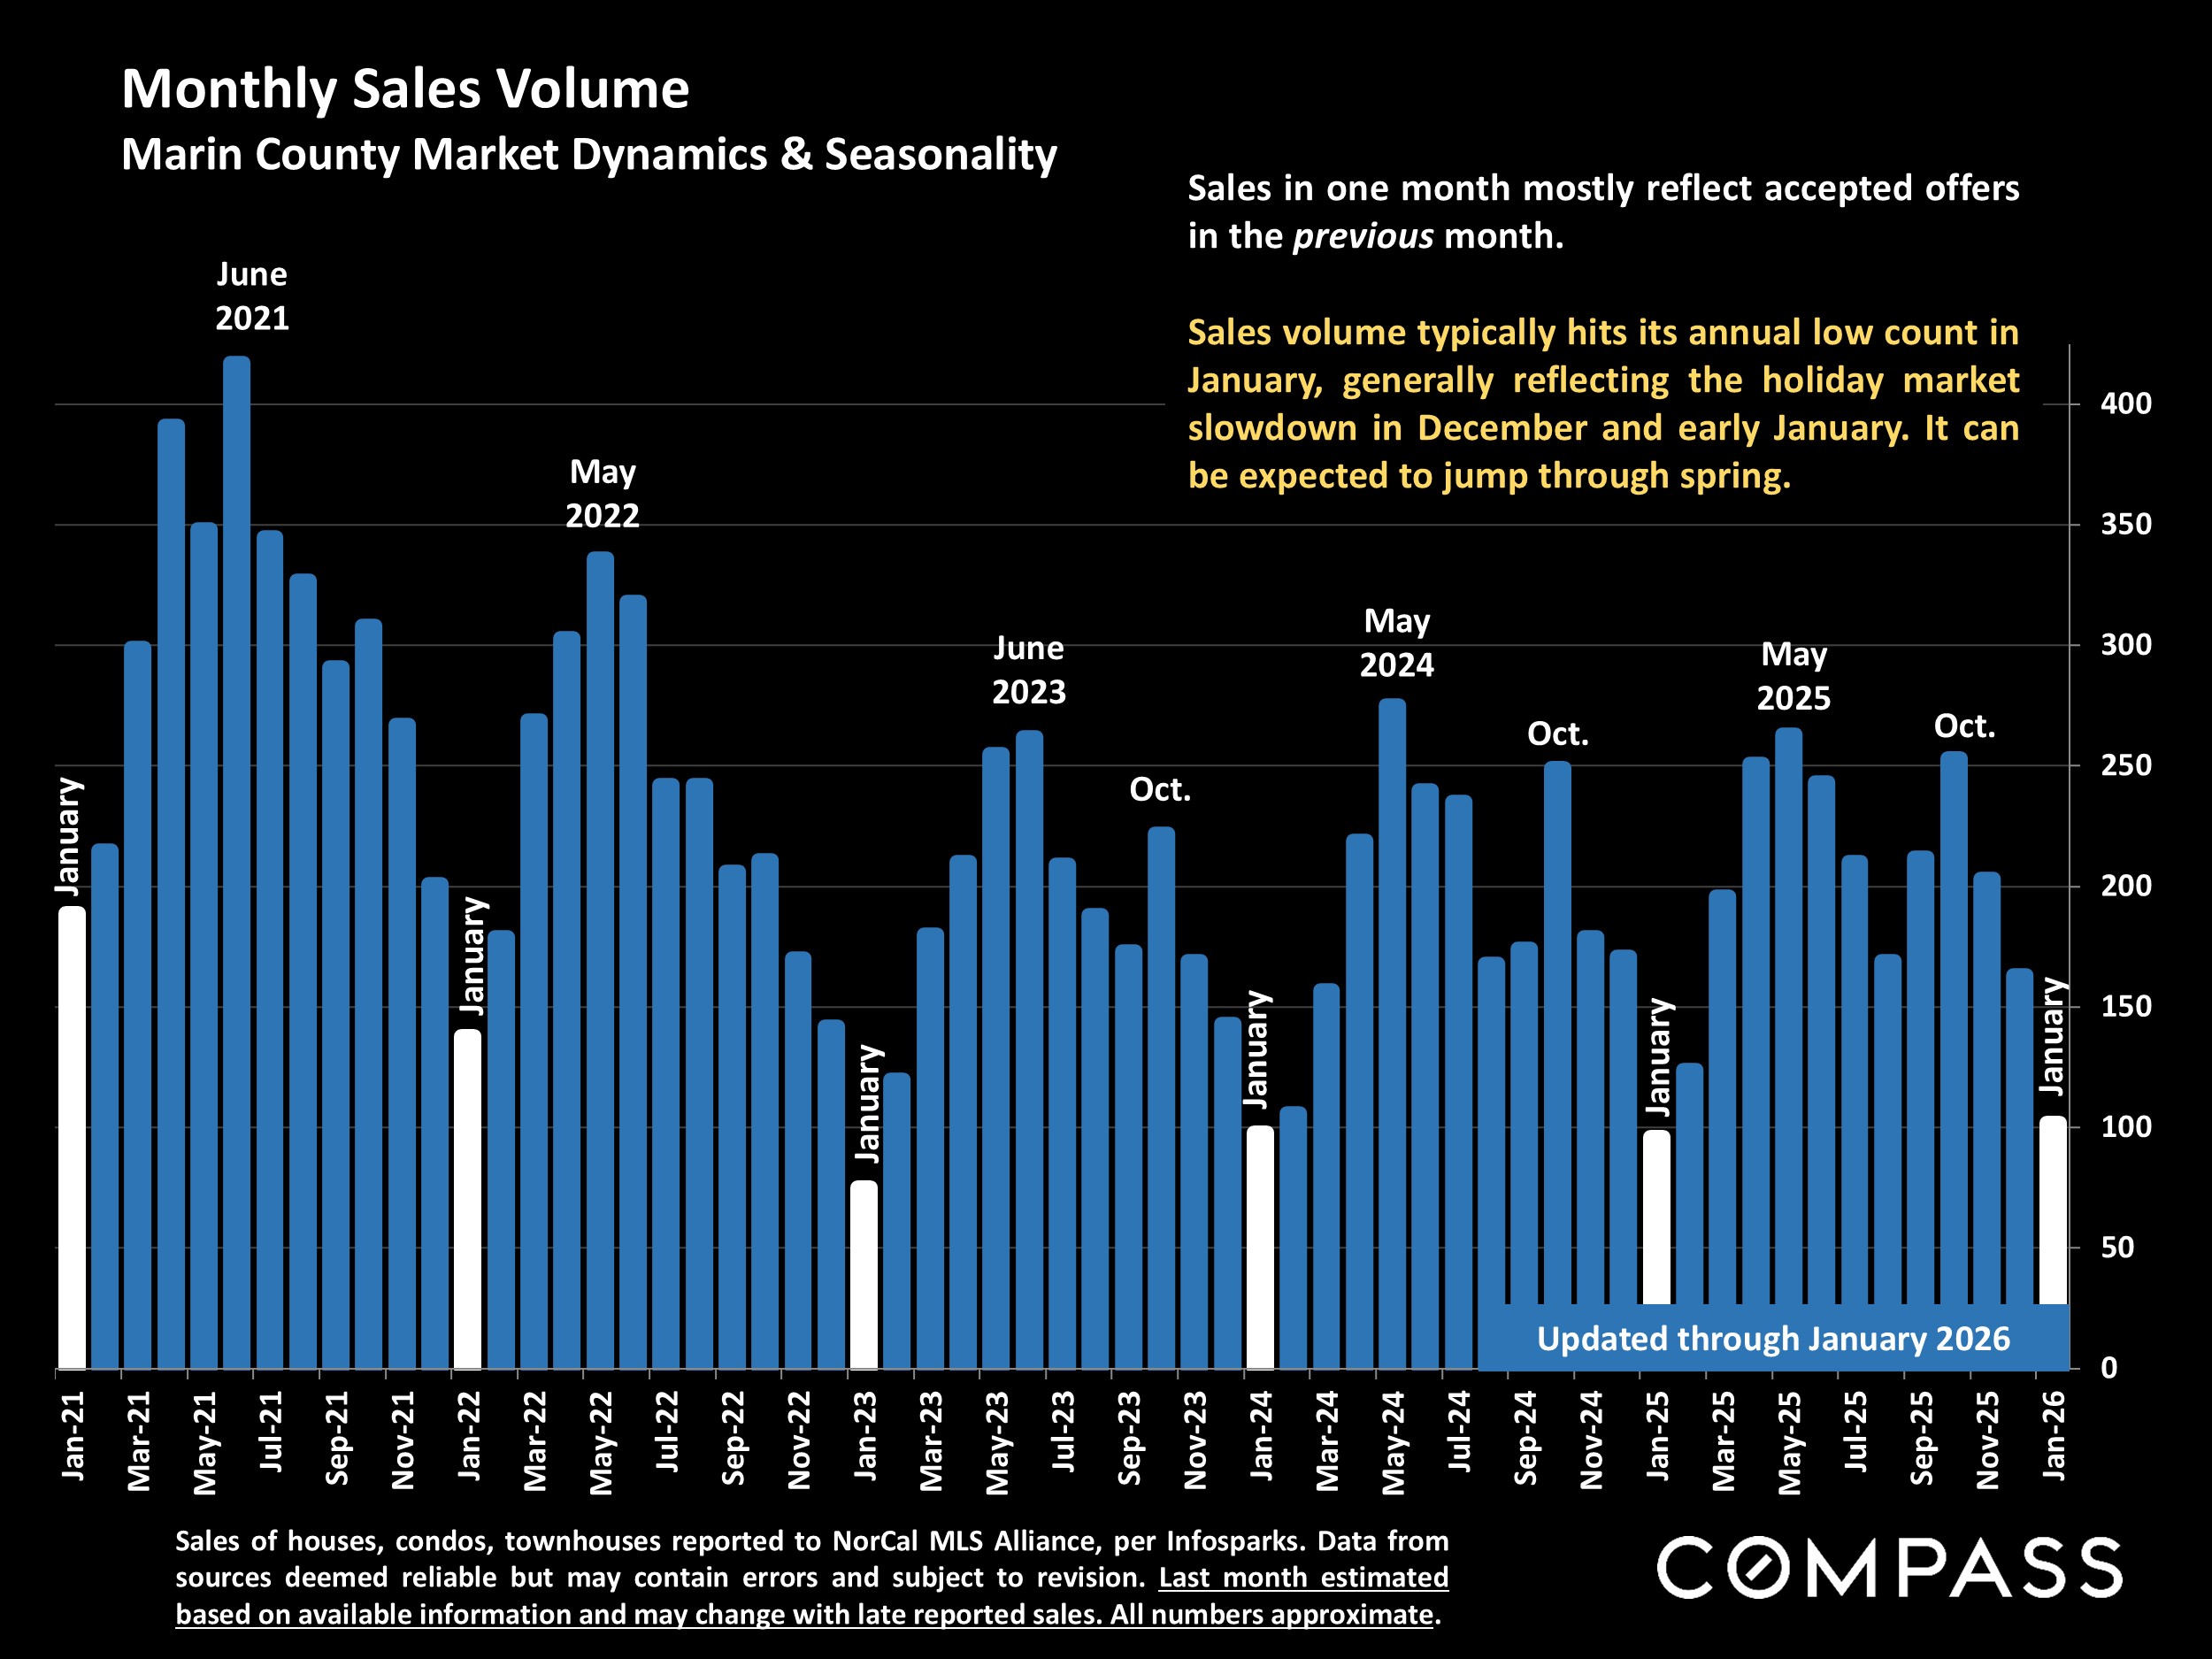
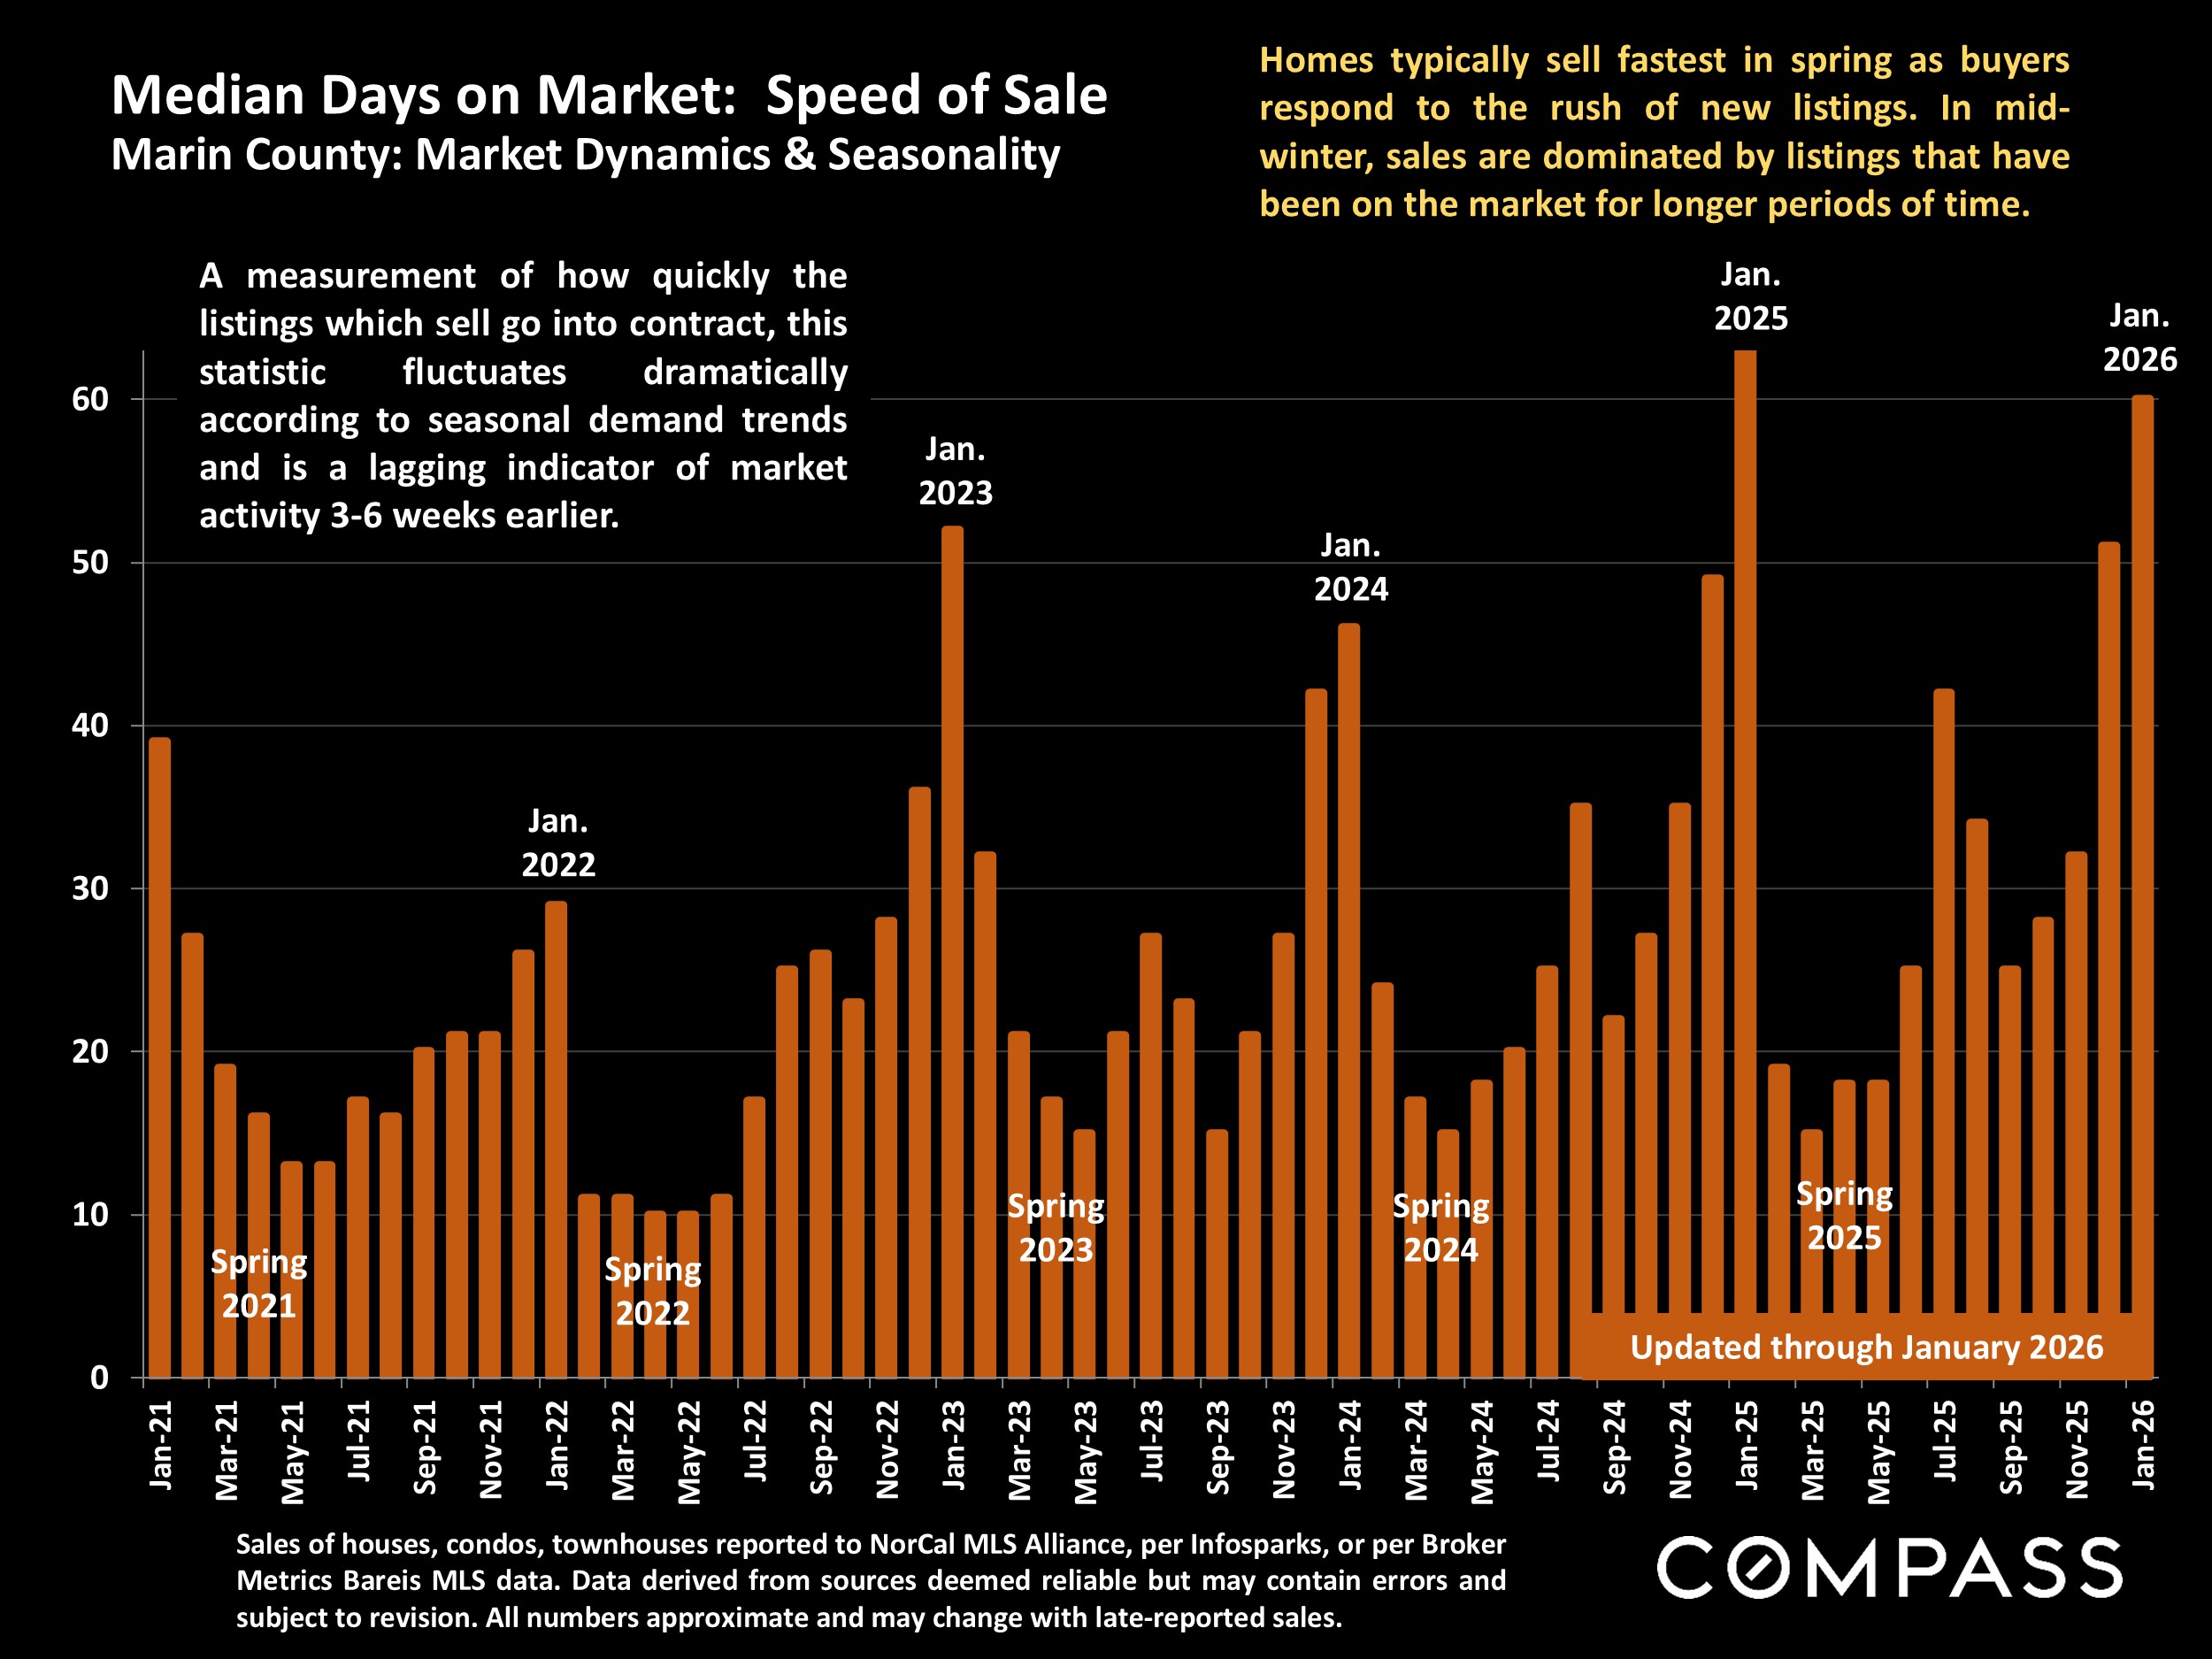
The January sales statistics illustrated in this report mostly reflect the very slow holiday market of December and early January when the offers were negotiated and accepted, which is why January typically sees very low sales volumes - often the lowest of the year - and weaker demand stats. These can be expected to shift rapidly in the coming months.

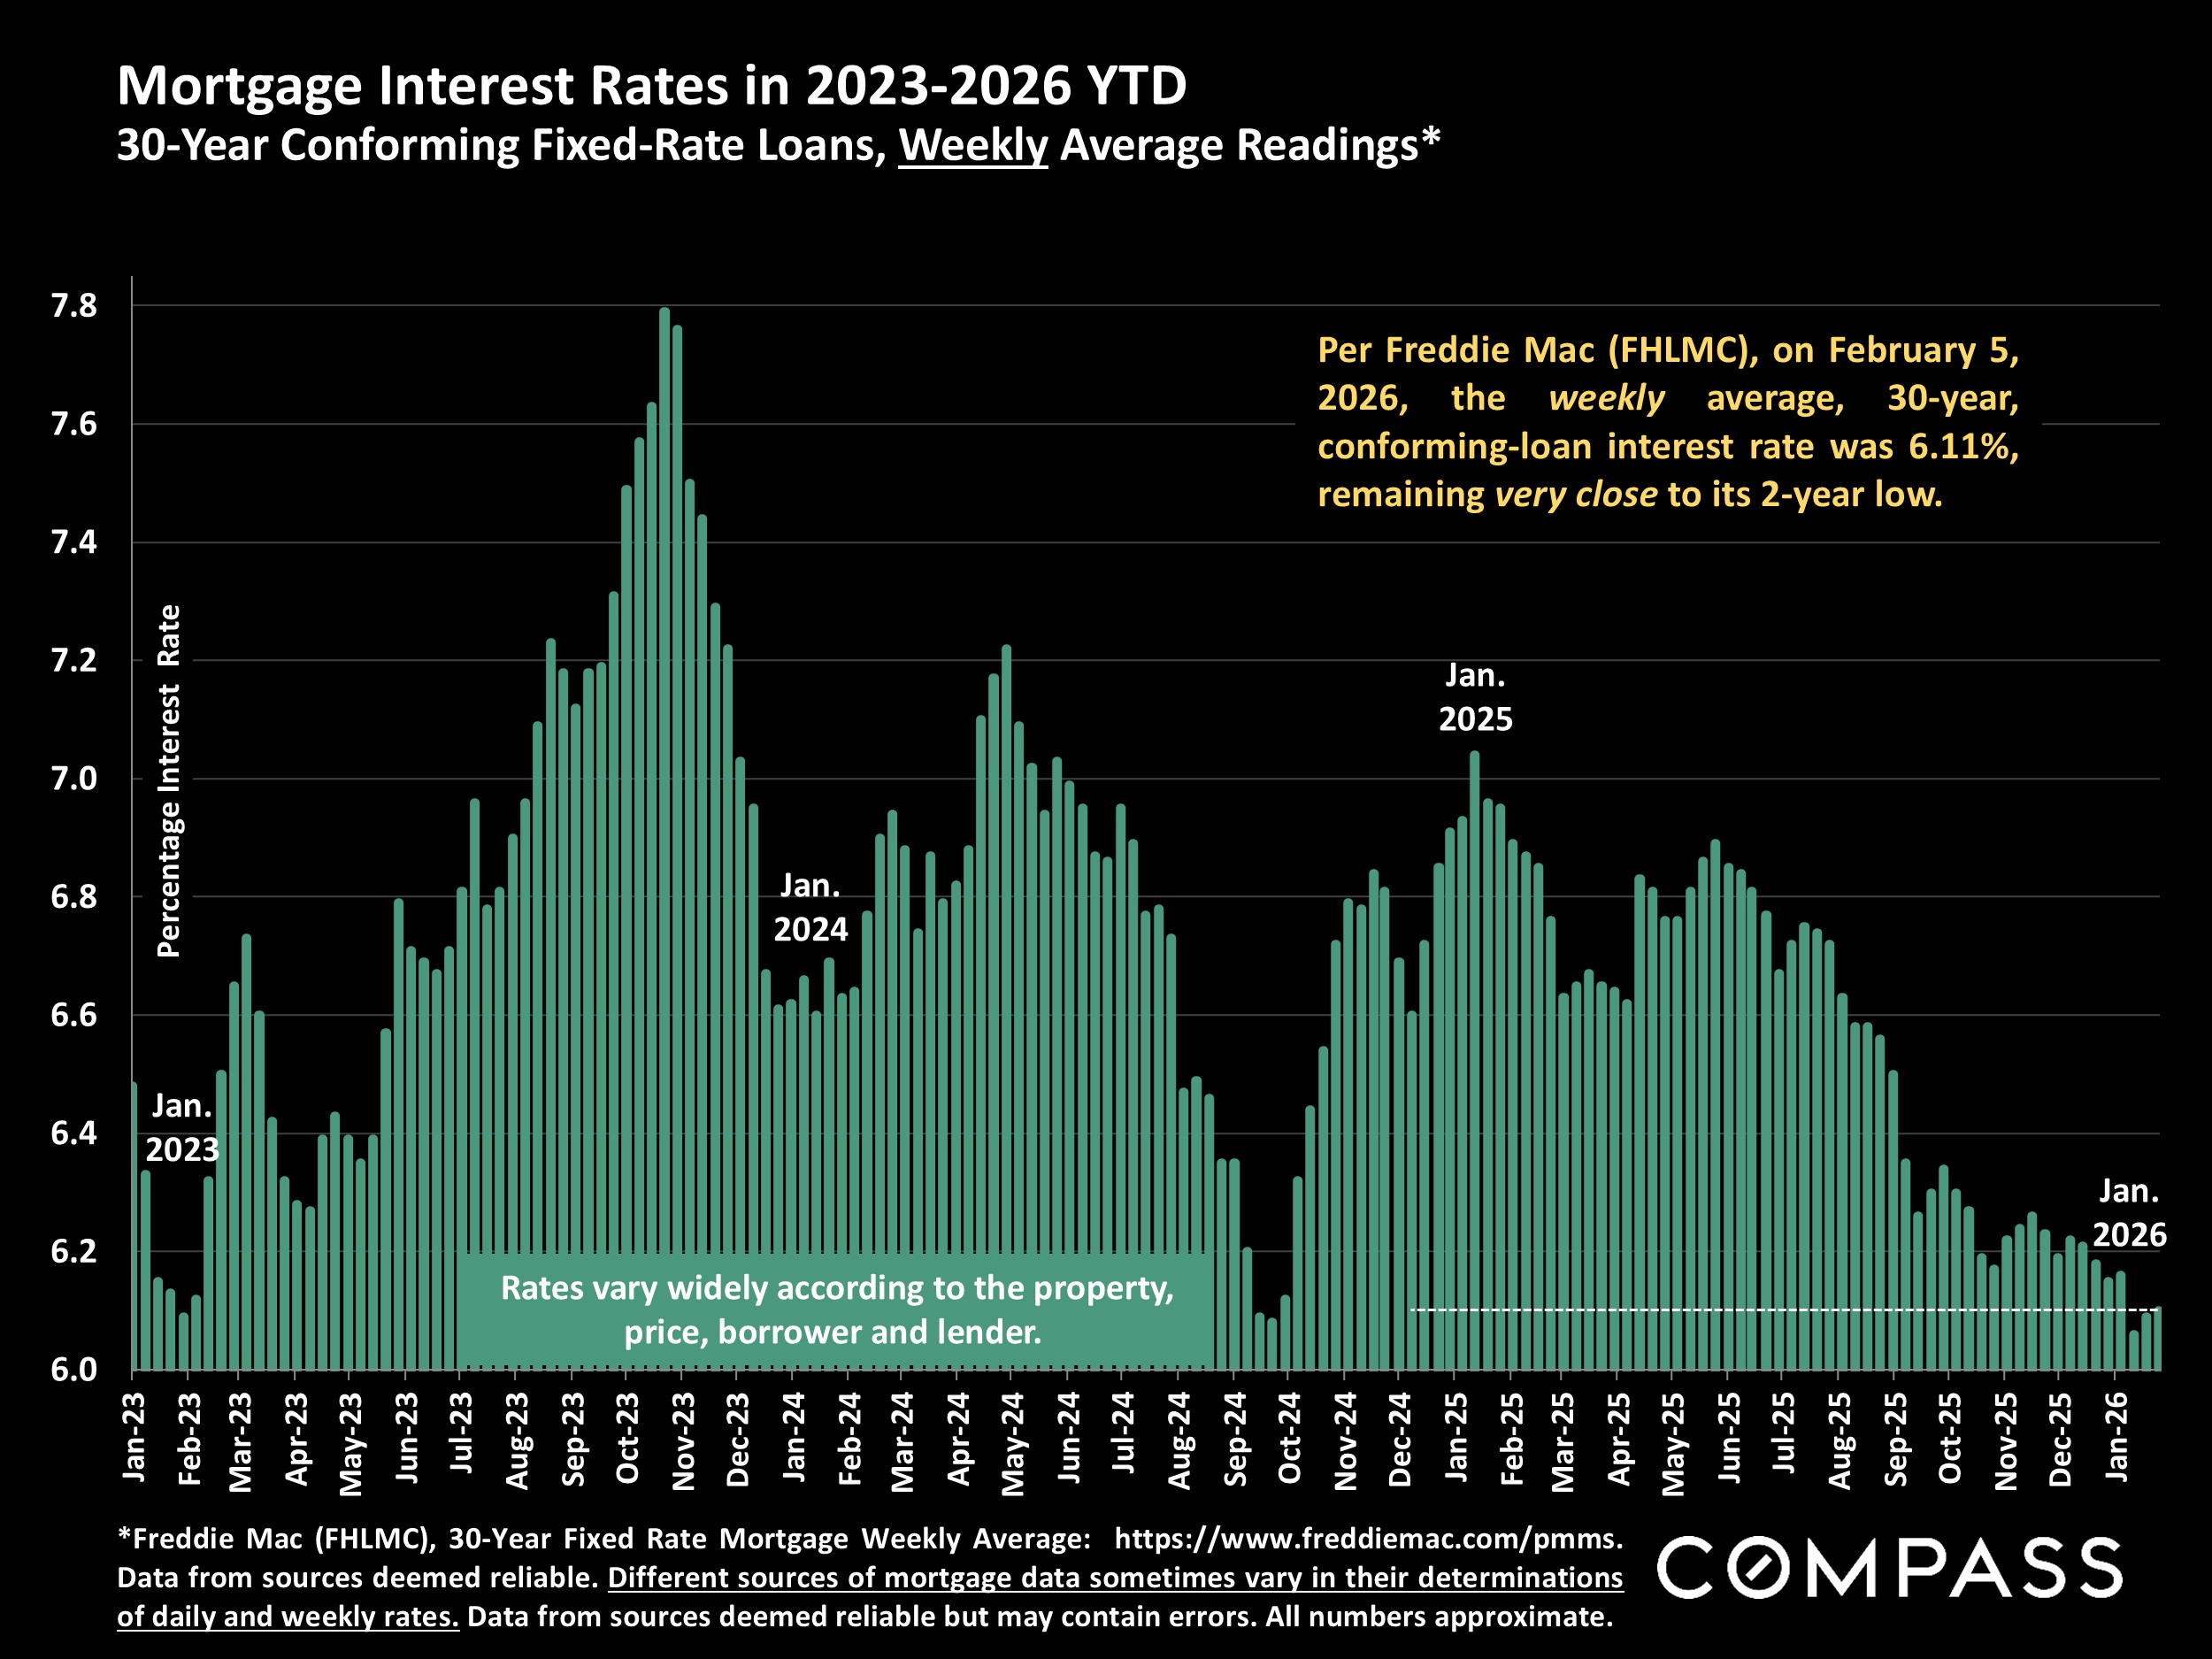
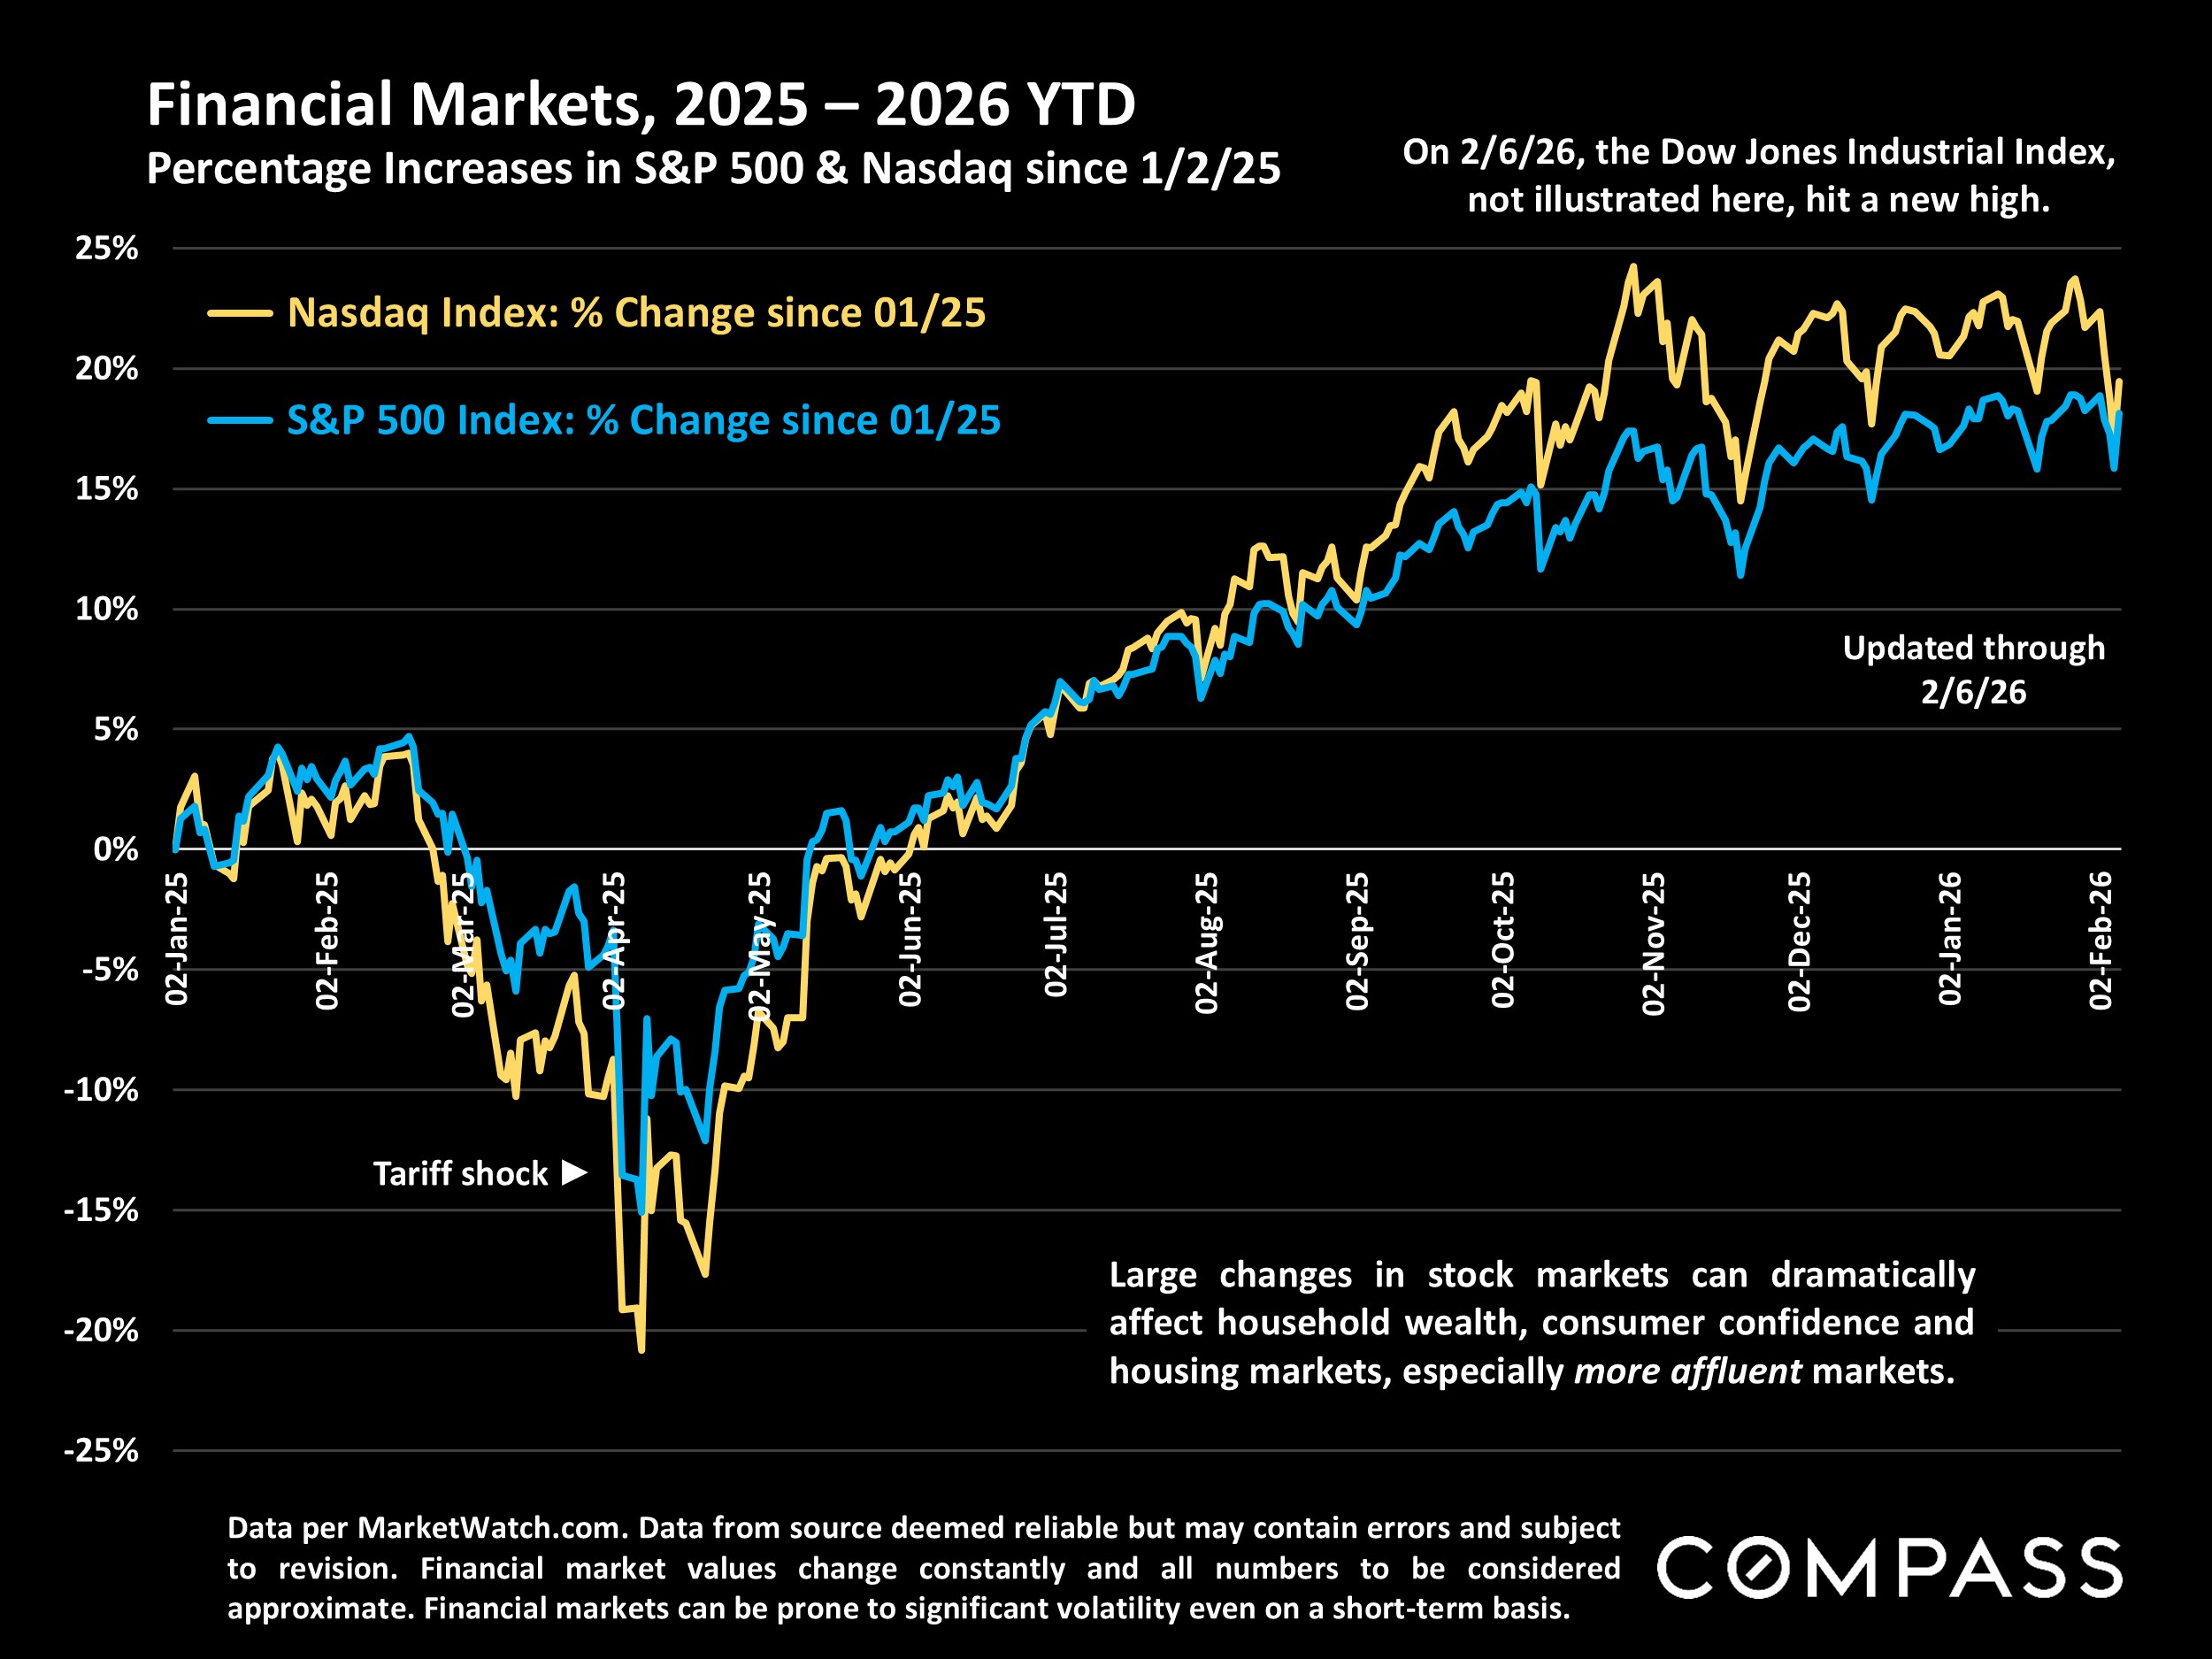
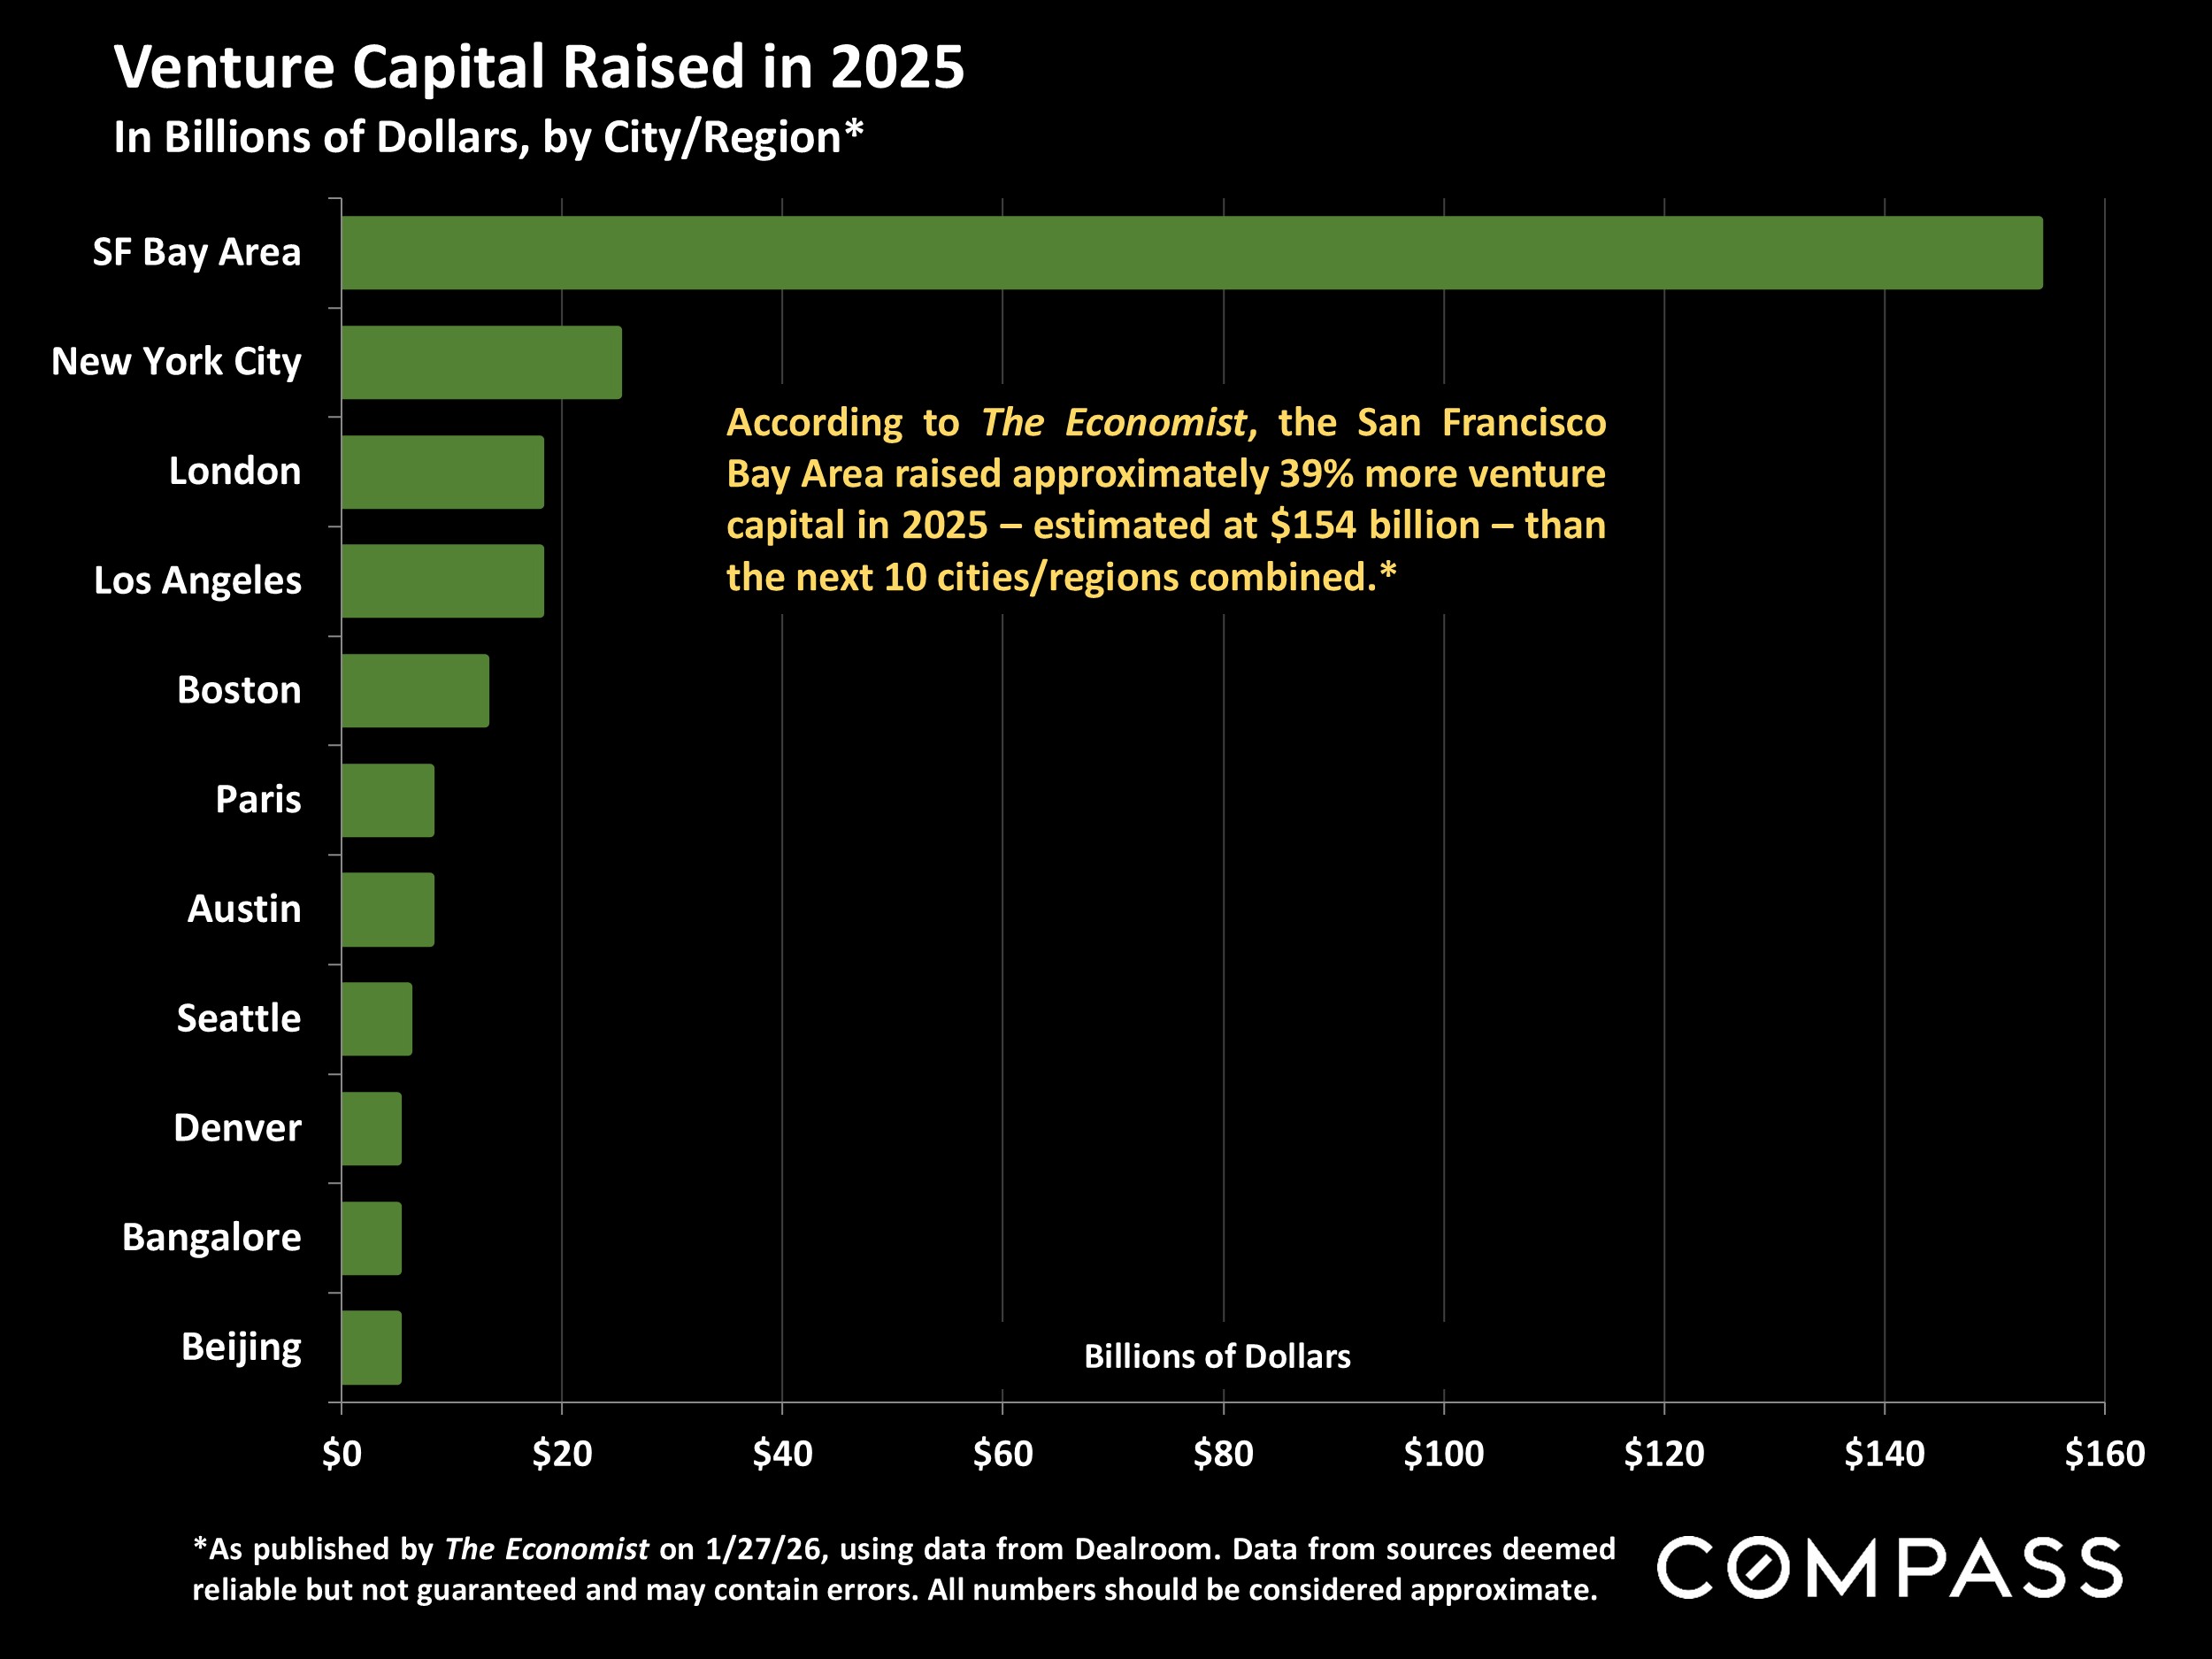
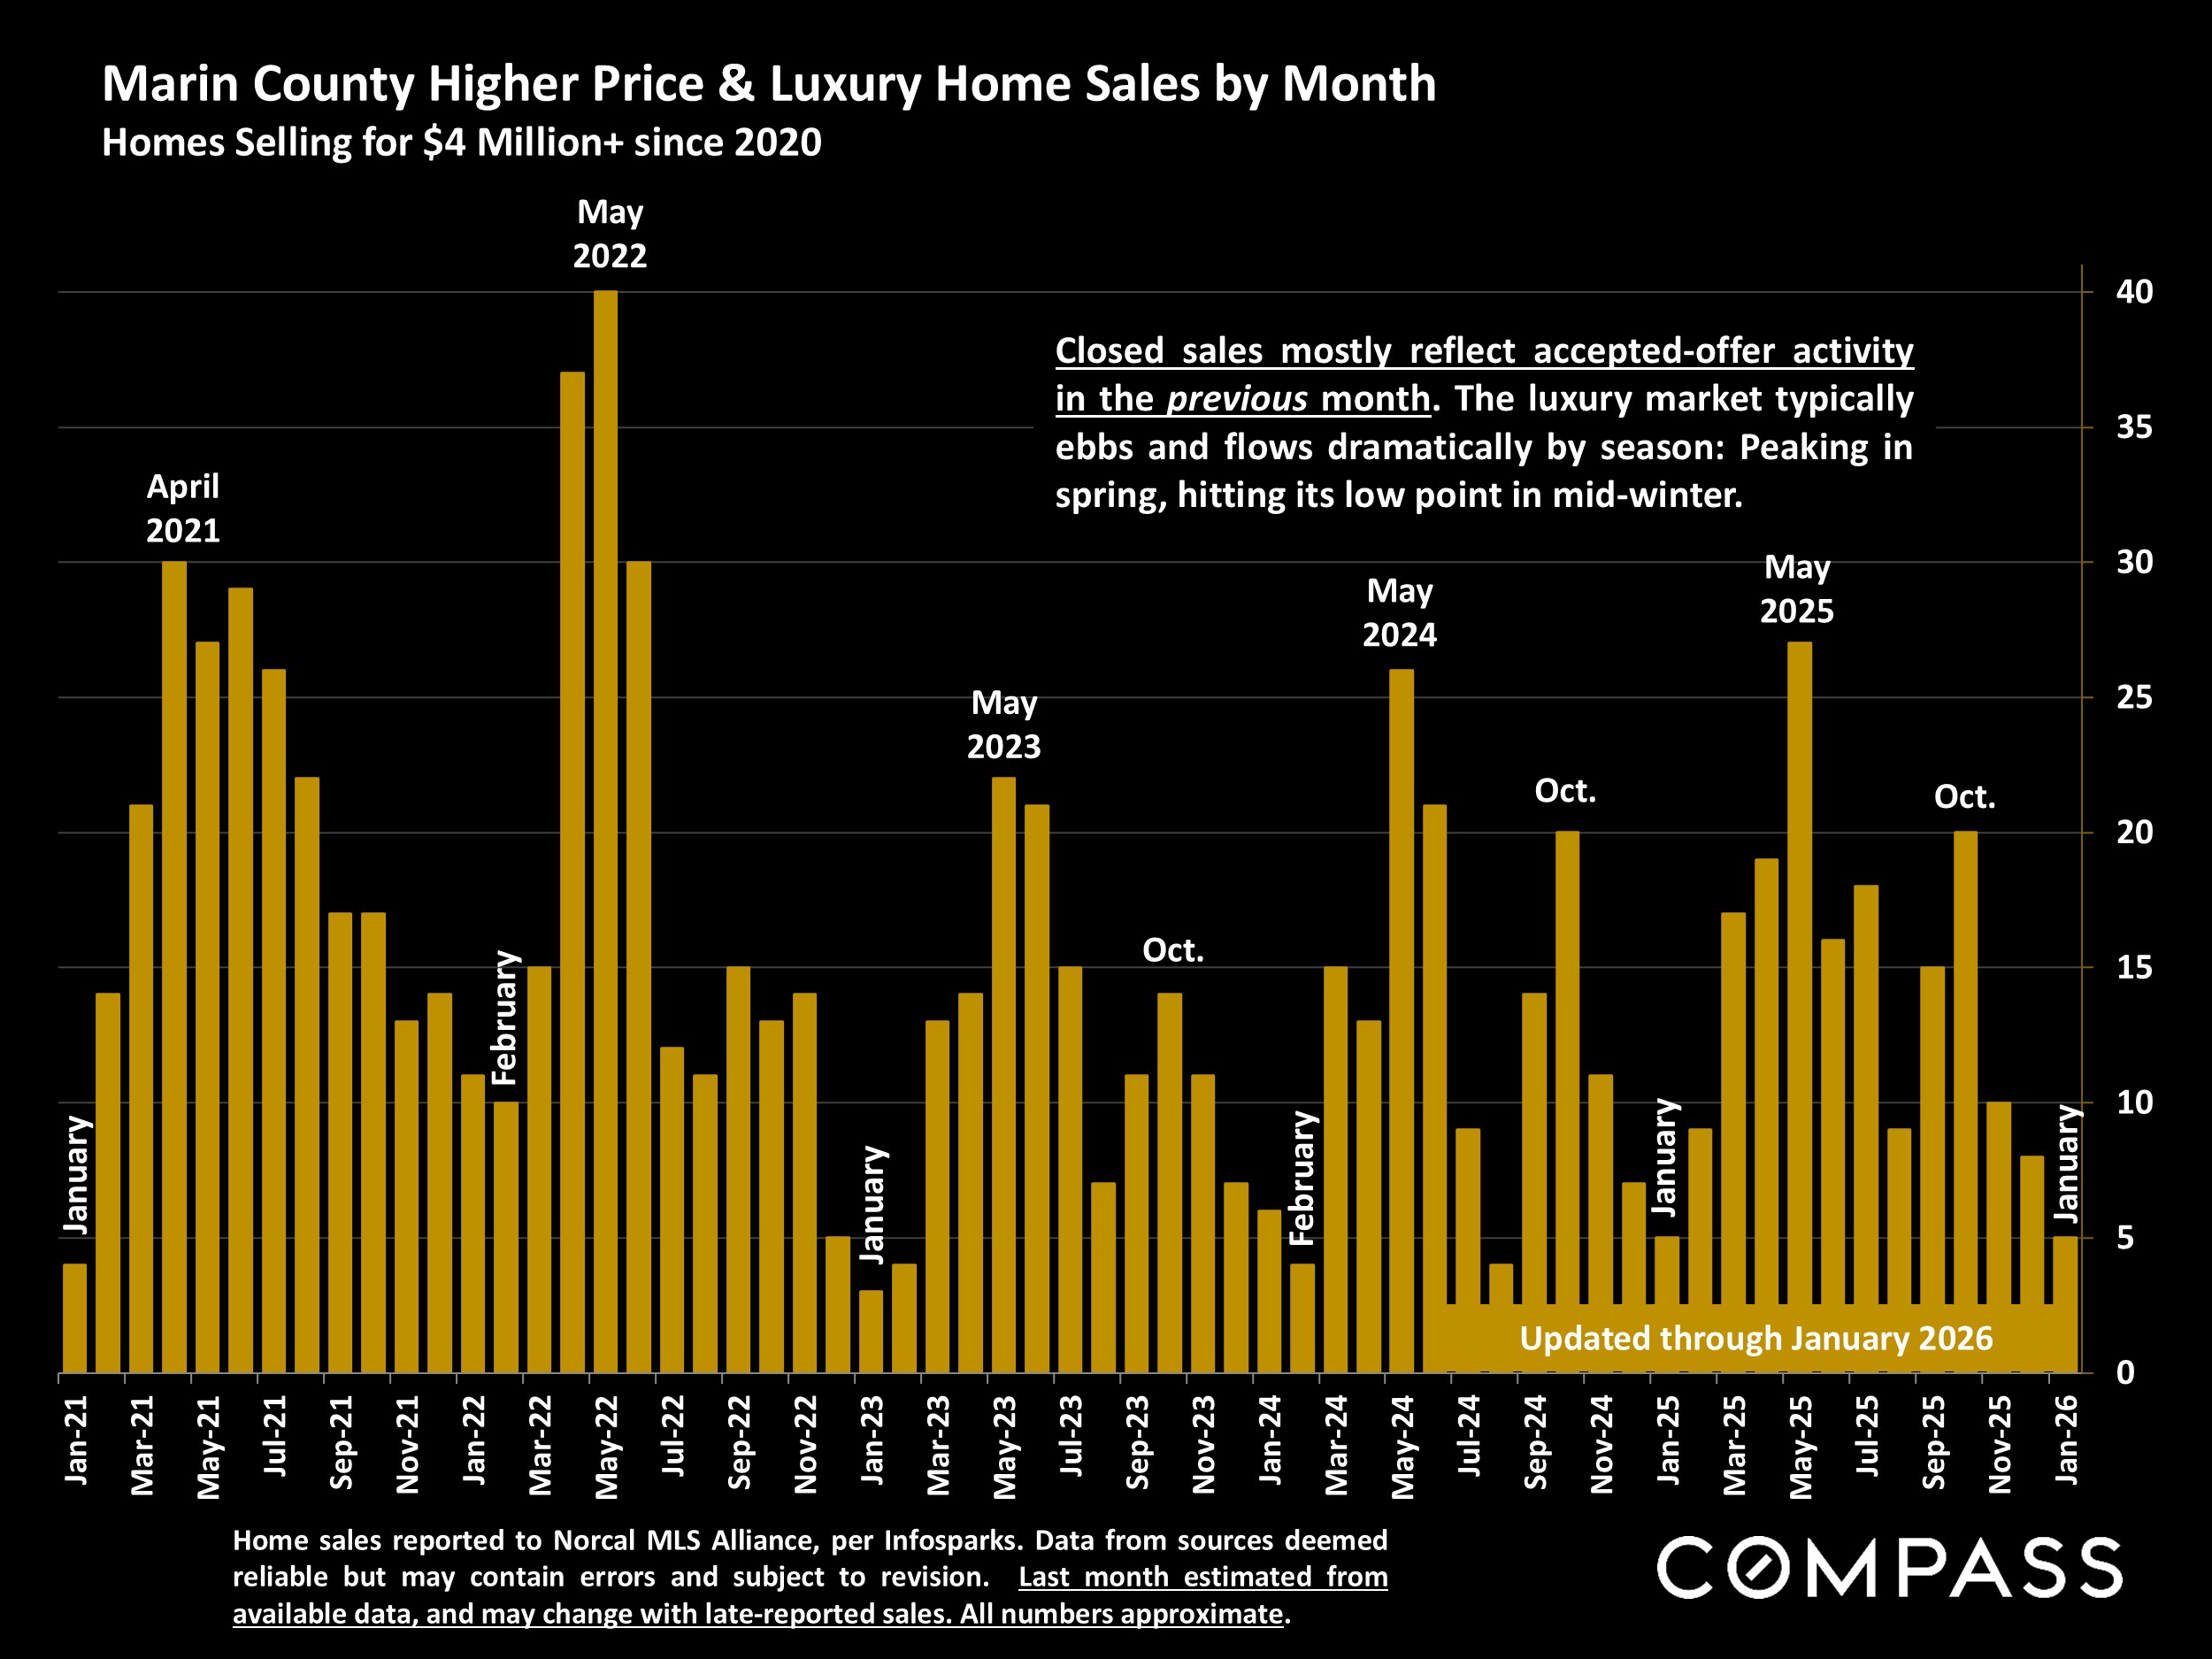
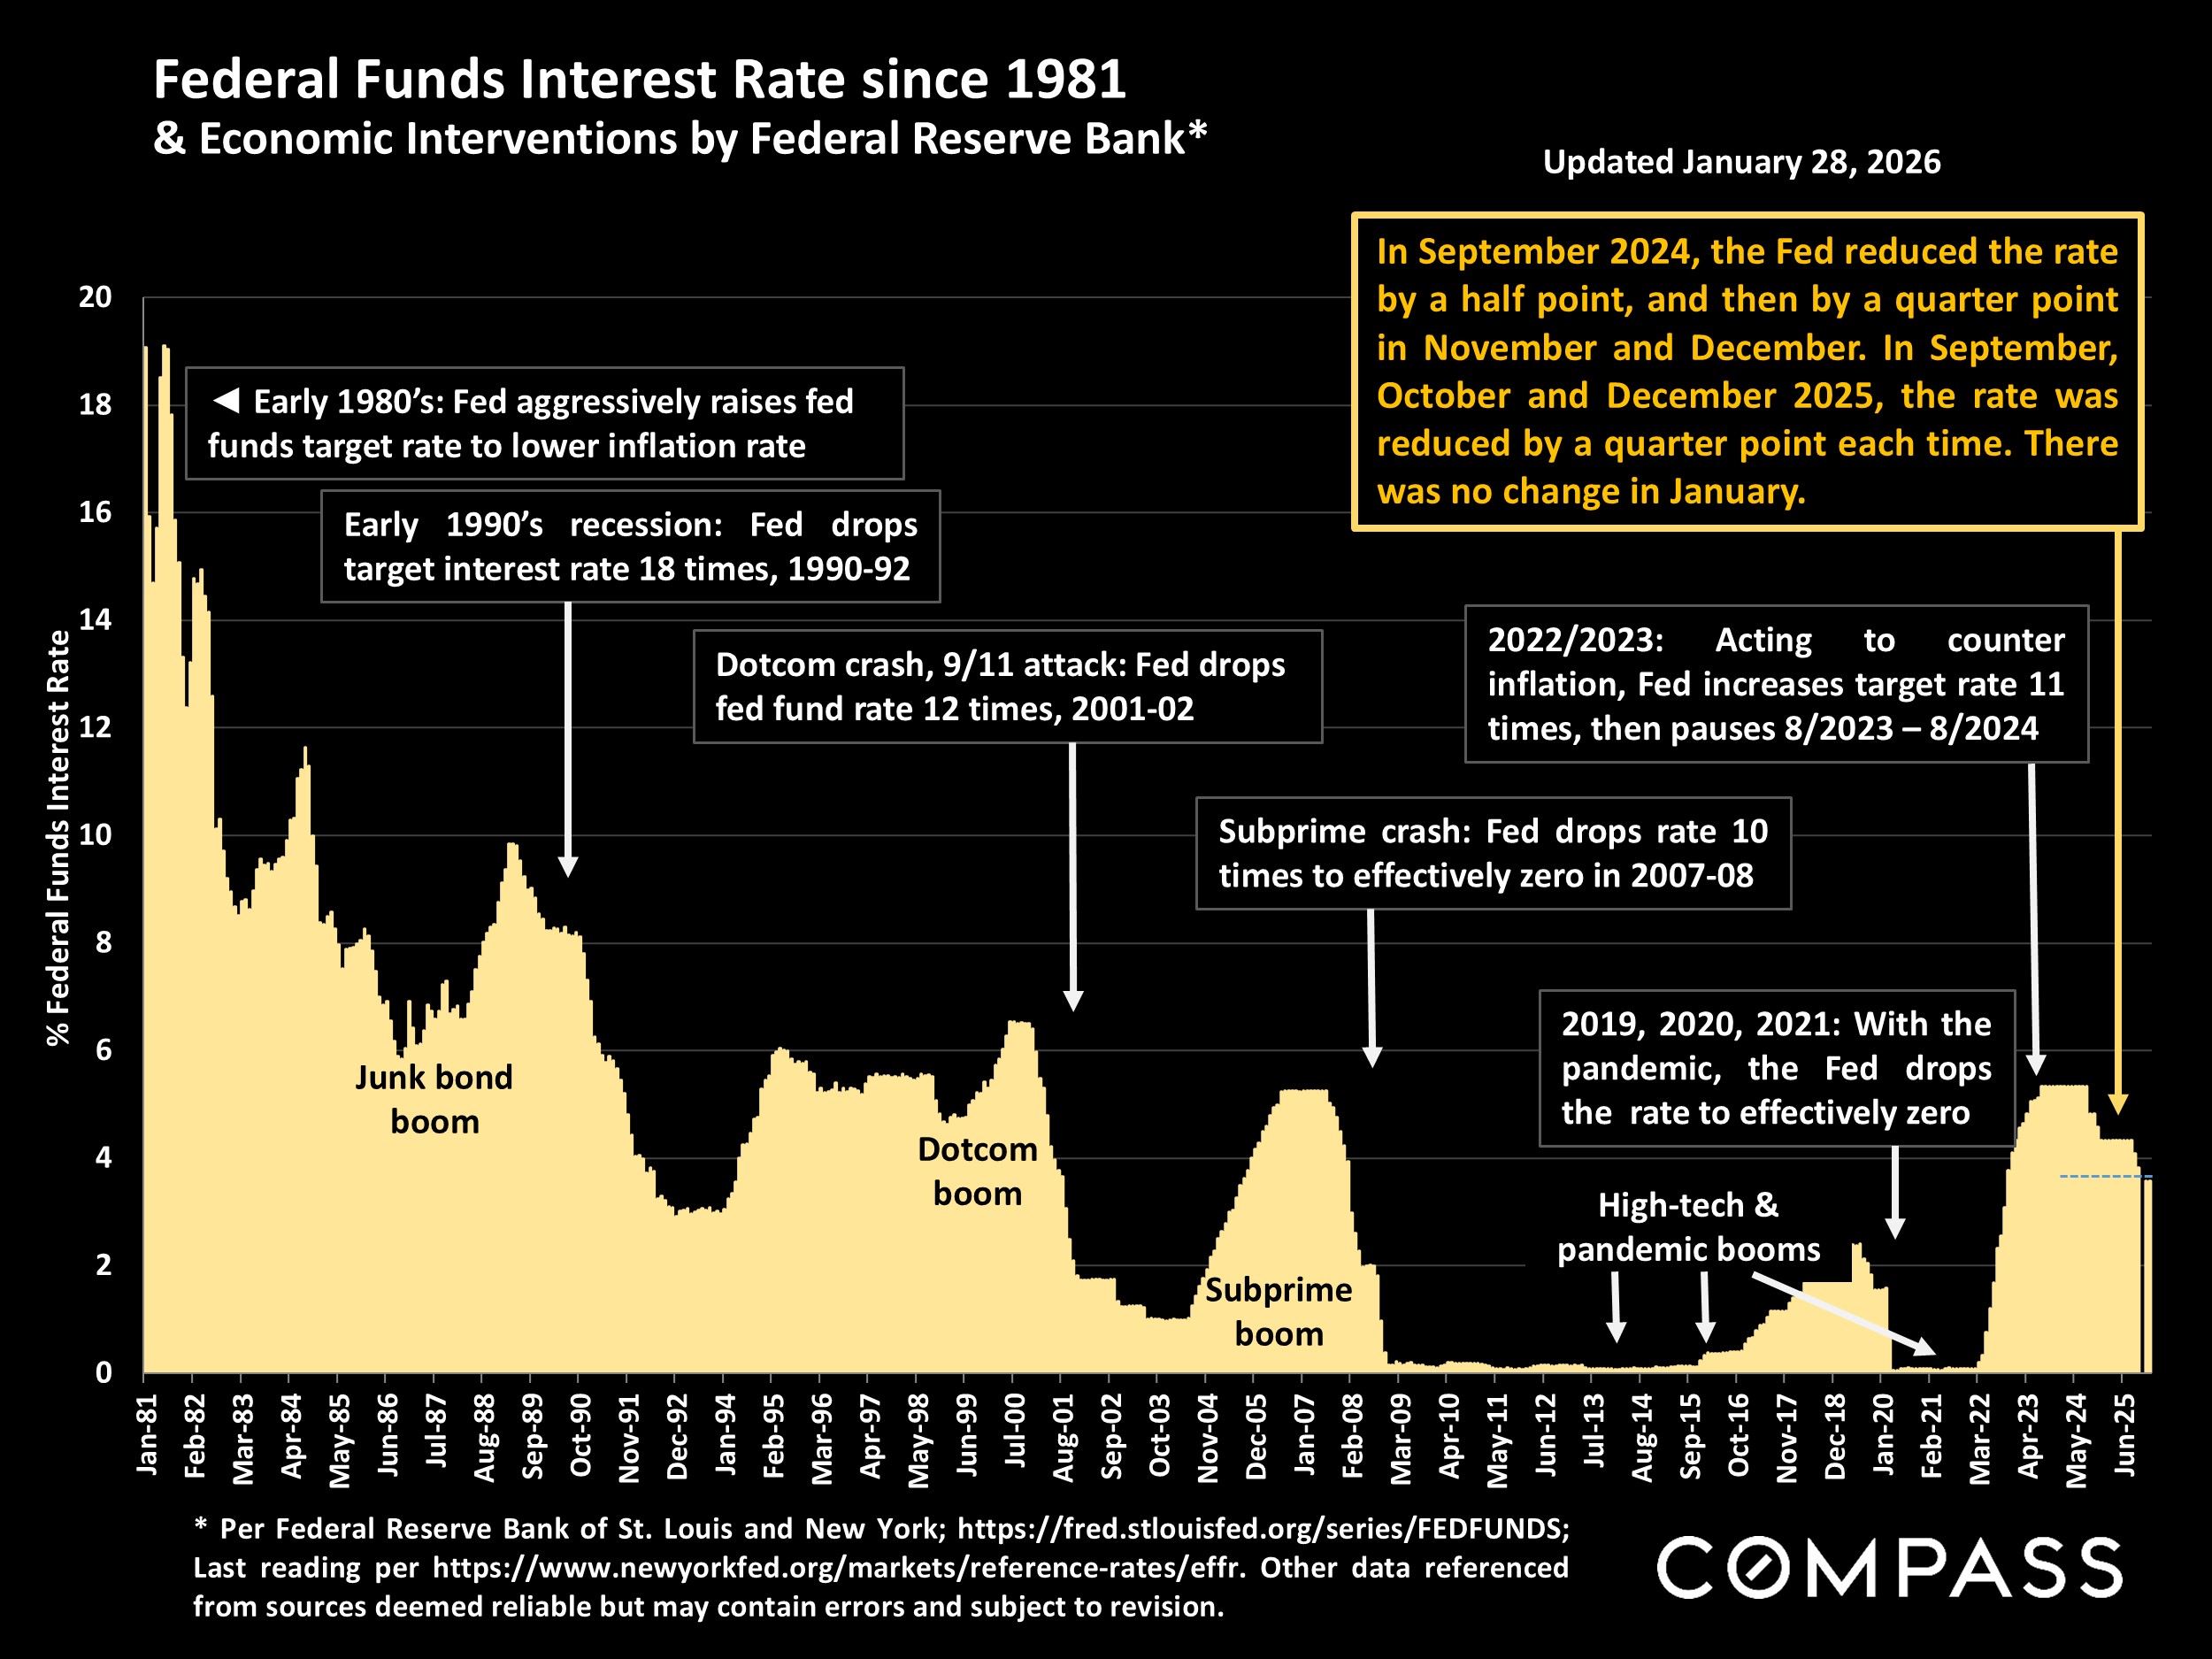
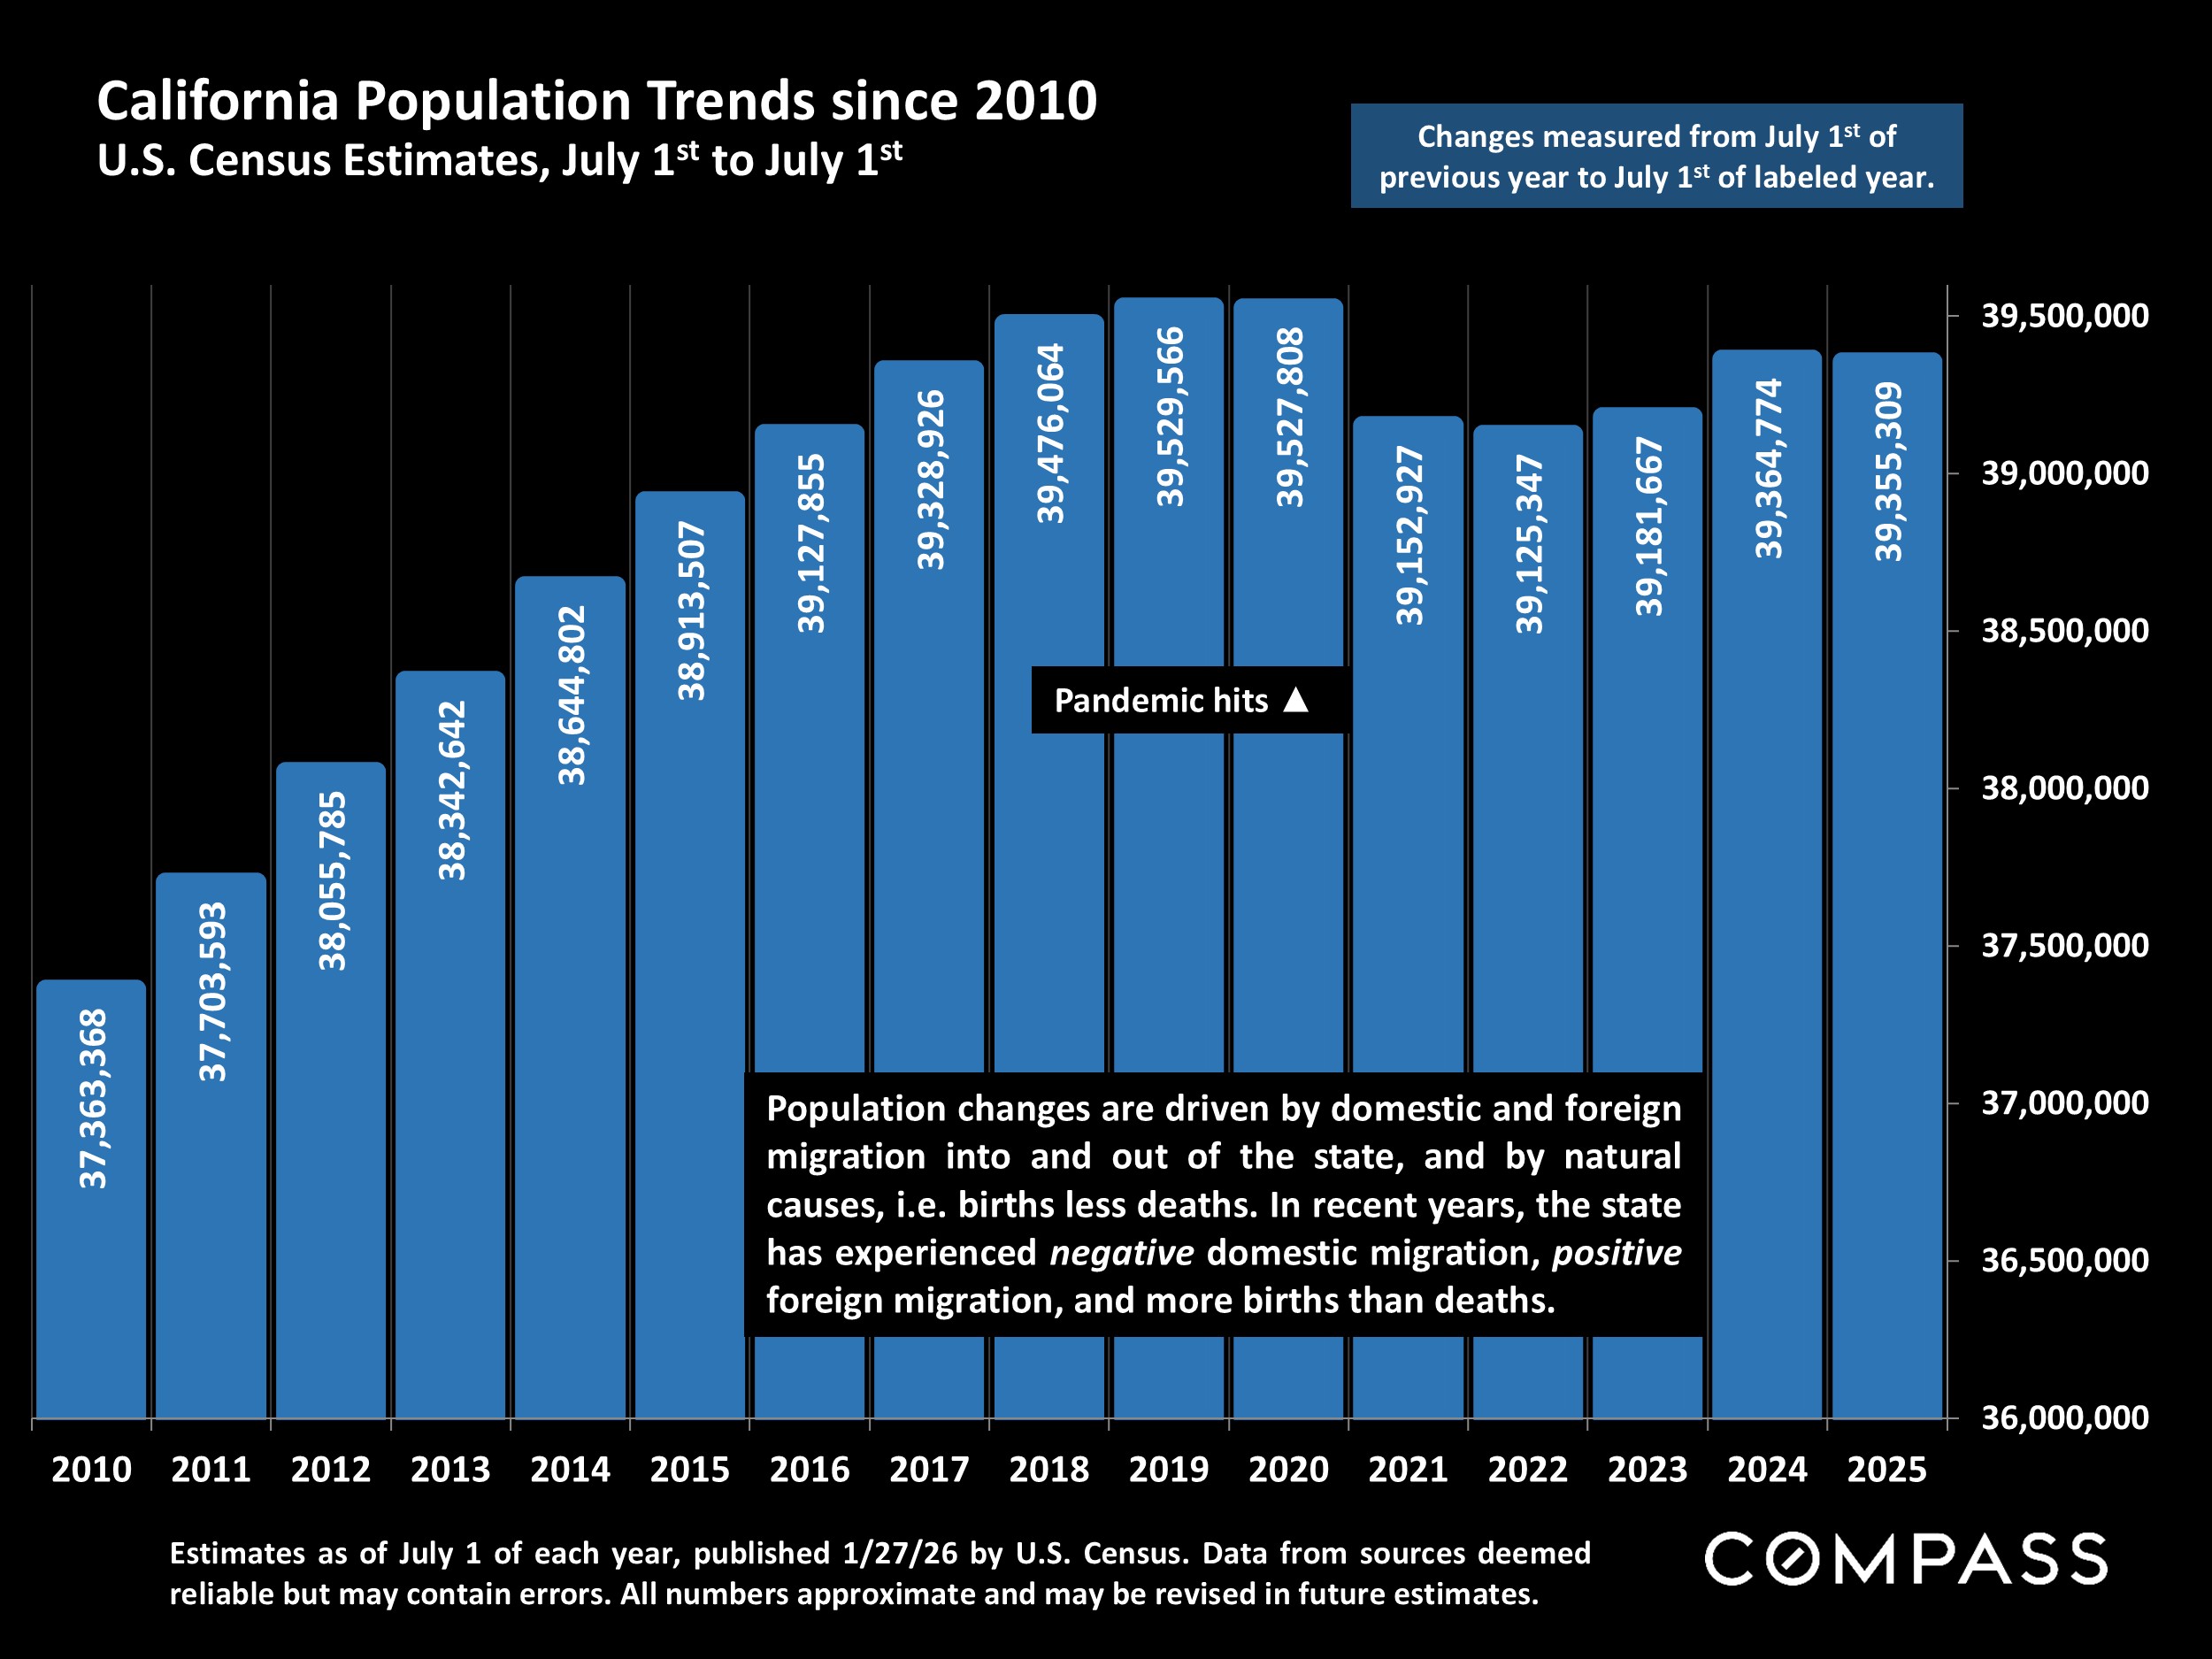
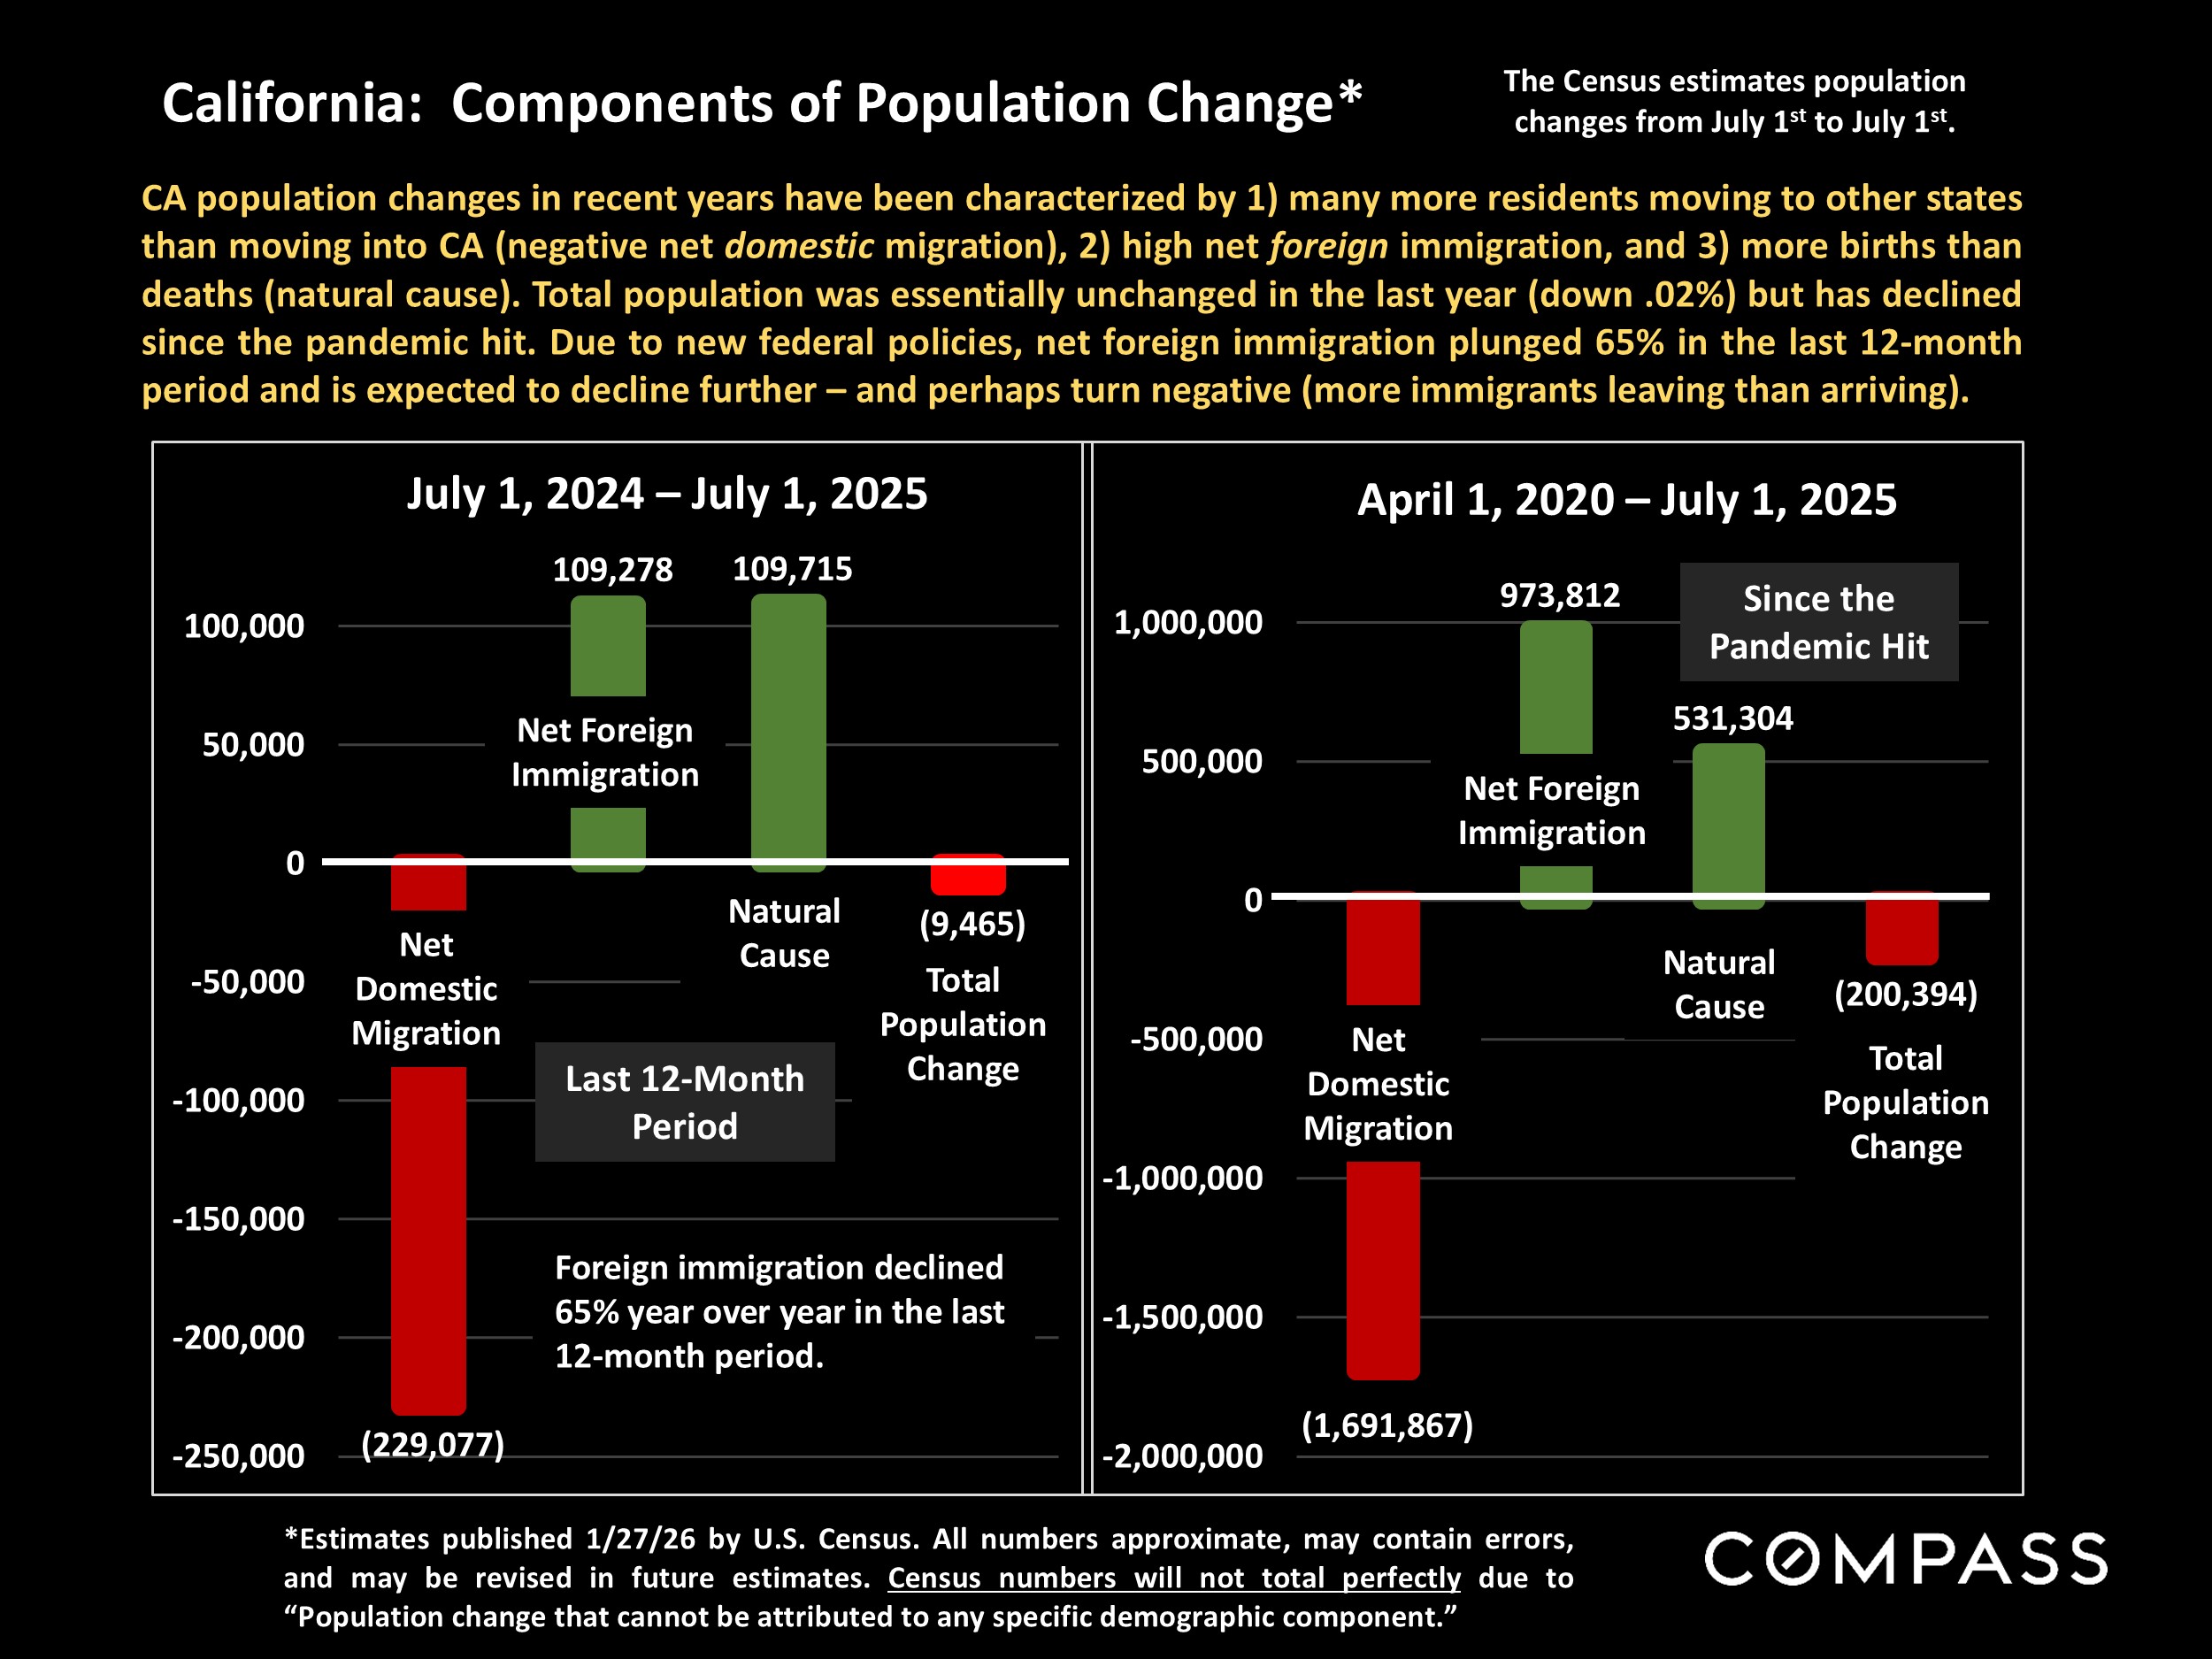
Interest rates are near multi-year lows and stock markets, though recently volatile, remain at or not too far off all-time highs. Al boom wealth is gradually spreading through the Bay Area. Though national consumer confidence remains low and employment concerns continue, they don't appear to be seriously impacting the Bay Area. As has been the case in the past 2 years, more affluent buyers seem poised to play an outsized role in demand - and Marin is one of the most affluent counties in the country. With these factors in mind, and barring new political/economic shocks, we anticipate an early and heated spring market.

Mortgage Interest Rates in 2023-2026 TD 30-Year Conforming Fixed-Rate Loans, Weekly Average Readings*Financial Markets, 2025 - 2026 YTD Percentage Increases in S&P 500 & Nasdaq since 1/2/25Venture Capital Raised in 2025 In Billions of Dollars, by City/Region*Marin County Home Price Trends since 1990 Monthly Median House Sales Price, 3-Month RollingMedian House Sales Price Appreciation Marin County:% Change in Annual Median Sales Price*Marin County House Value Trends since 2005 3-Month-Rolling Median Dollar per Square Foot Values*Marin County Condo Price Trends since 2005 3-Month Rolling Median Condo Sales PriceNew Listings Coming on Market Marin County Market Dynamics & Seasonality*Marin County Homes Market Active & Coming-Soon Listings on 1st of Month*Number of HOUSES for Sale by Bay Area County, as of 2/1/26*Marin County Residential Market Market Dynamics by Price Segment/Property TypeListings Accepting Offers (Going into Contract) Marin County Market Dynamics & SeasonalityPercentage of Listings Accepting Offers (Going into Contract) Marin County: Absorption Rate by MonthMonths Supply of Inventory (MSI) - of Active Listings on Market Marin County Real Estate Market since 2018, 3-Month Rolling AverageMonthly Sales Volume,Marin County Market Dynamics & SeasonalityMarin County Higher Price & Luxury Home Sales by Month Homes Selling for $4 Million+ since 2020Price Reductions on Active Listings Marin County Market Dynamics & SeasonalityOverbidding List Prices in Marin County Percentage of Home Sales Closing over List PriceAverage Sales Price to Original List Price Percentage Marin County Over/Under Bidding: Market Dynamics & SeasonalityMedian Days on Market: Speed of Sale Marin County: Market Dynamics & SeasonalityFederal Funds Interest Rate since 1981 & Economic Interventions by Federal Reserve Bank*Economic Policy Uncertainty Index* By Month since January 2000California Population Trends since 2010 U.S. Census Estimates, July 1st to July 1stCalifornia: Components of Population Change*California 2024 Migration Trends*San Francisco Bay Area Unemployment Rates Selected Bay Area Counties, since 2019Federal Government Employment by Month since January 2012*Bitcoin Price By Day since March 7, 2024U.S. 2025 Billion-Dollar Weather & Climate Disasters

Want to learn more about Bay Area market trends?

Let’s connect! With relationships and networks across the city, there are a variety of ways I can help you make informed real estate decisions. Call, email, or text – I’m here to help.


Contact