
July 15, 2024
Marin: July 2024 Market Stats
By Compass
Report Highlights
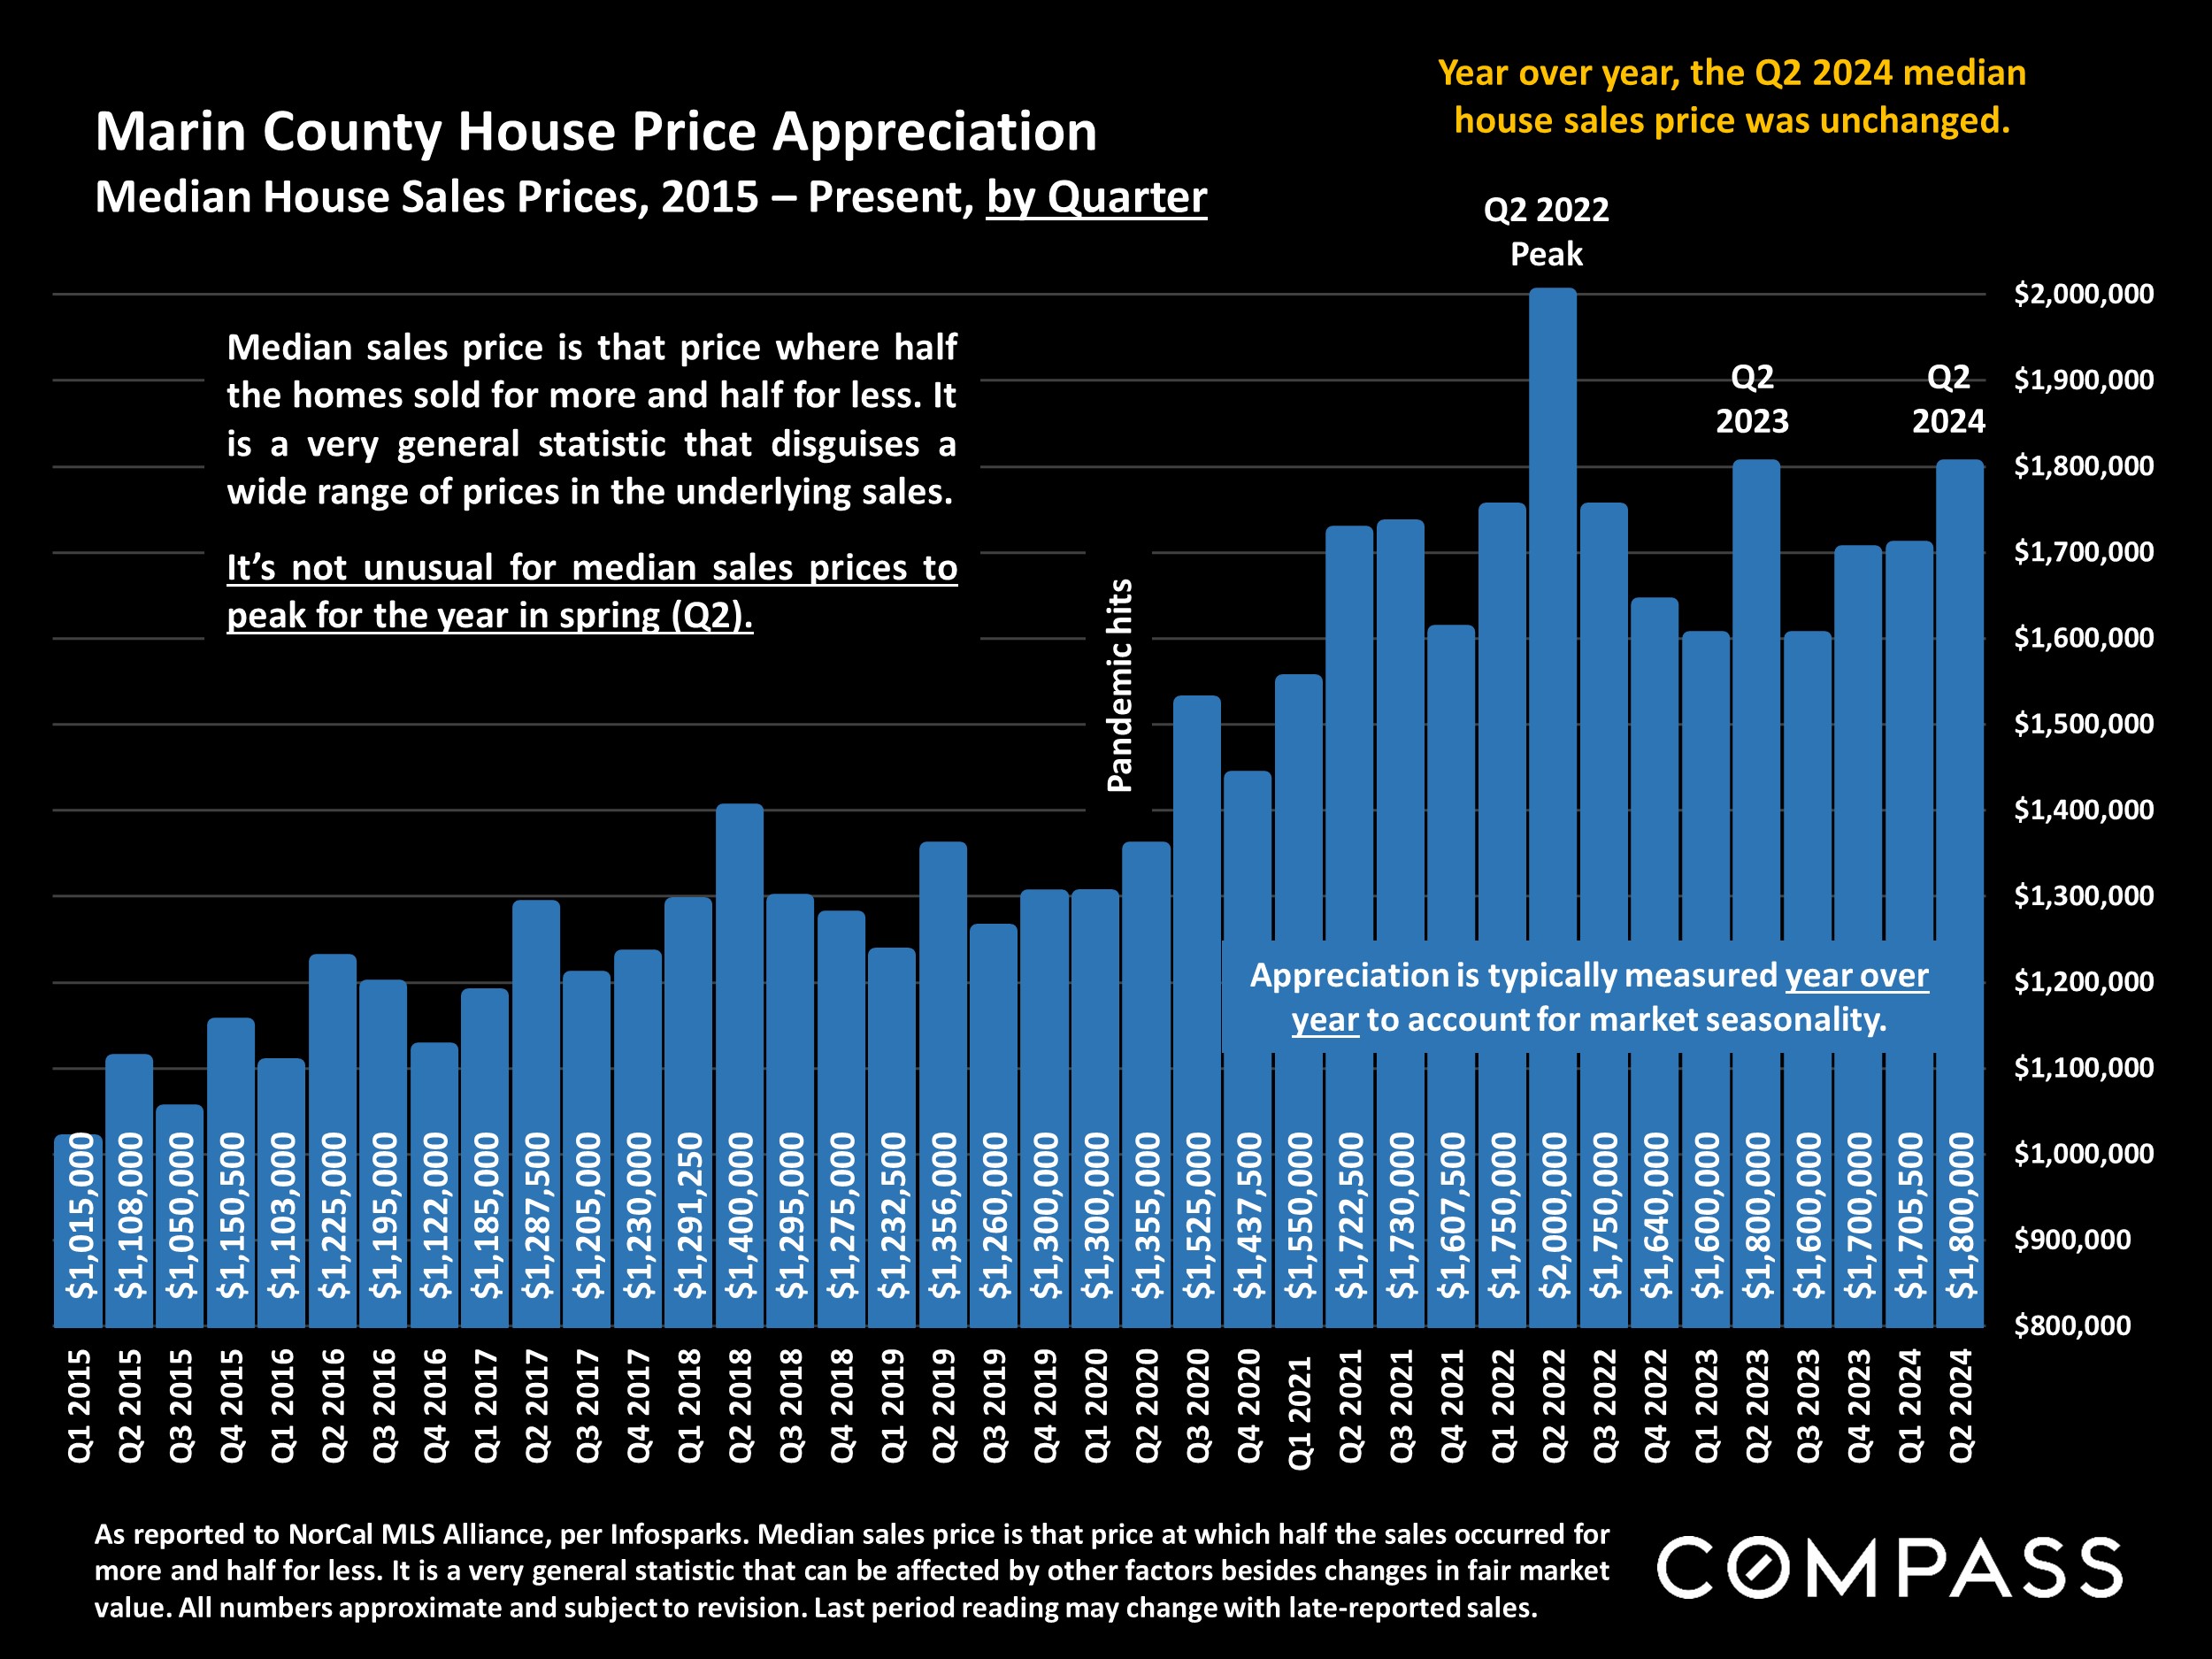
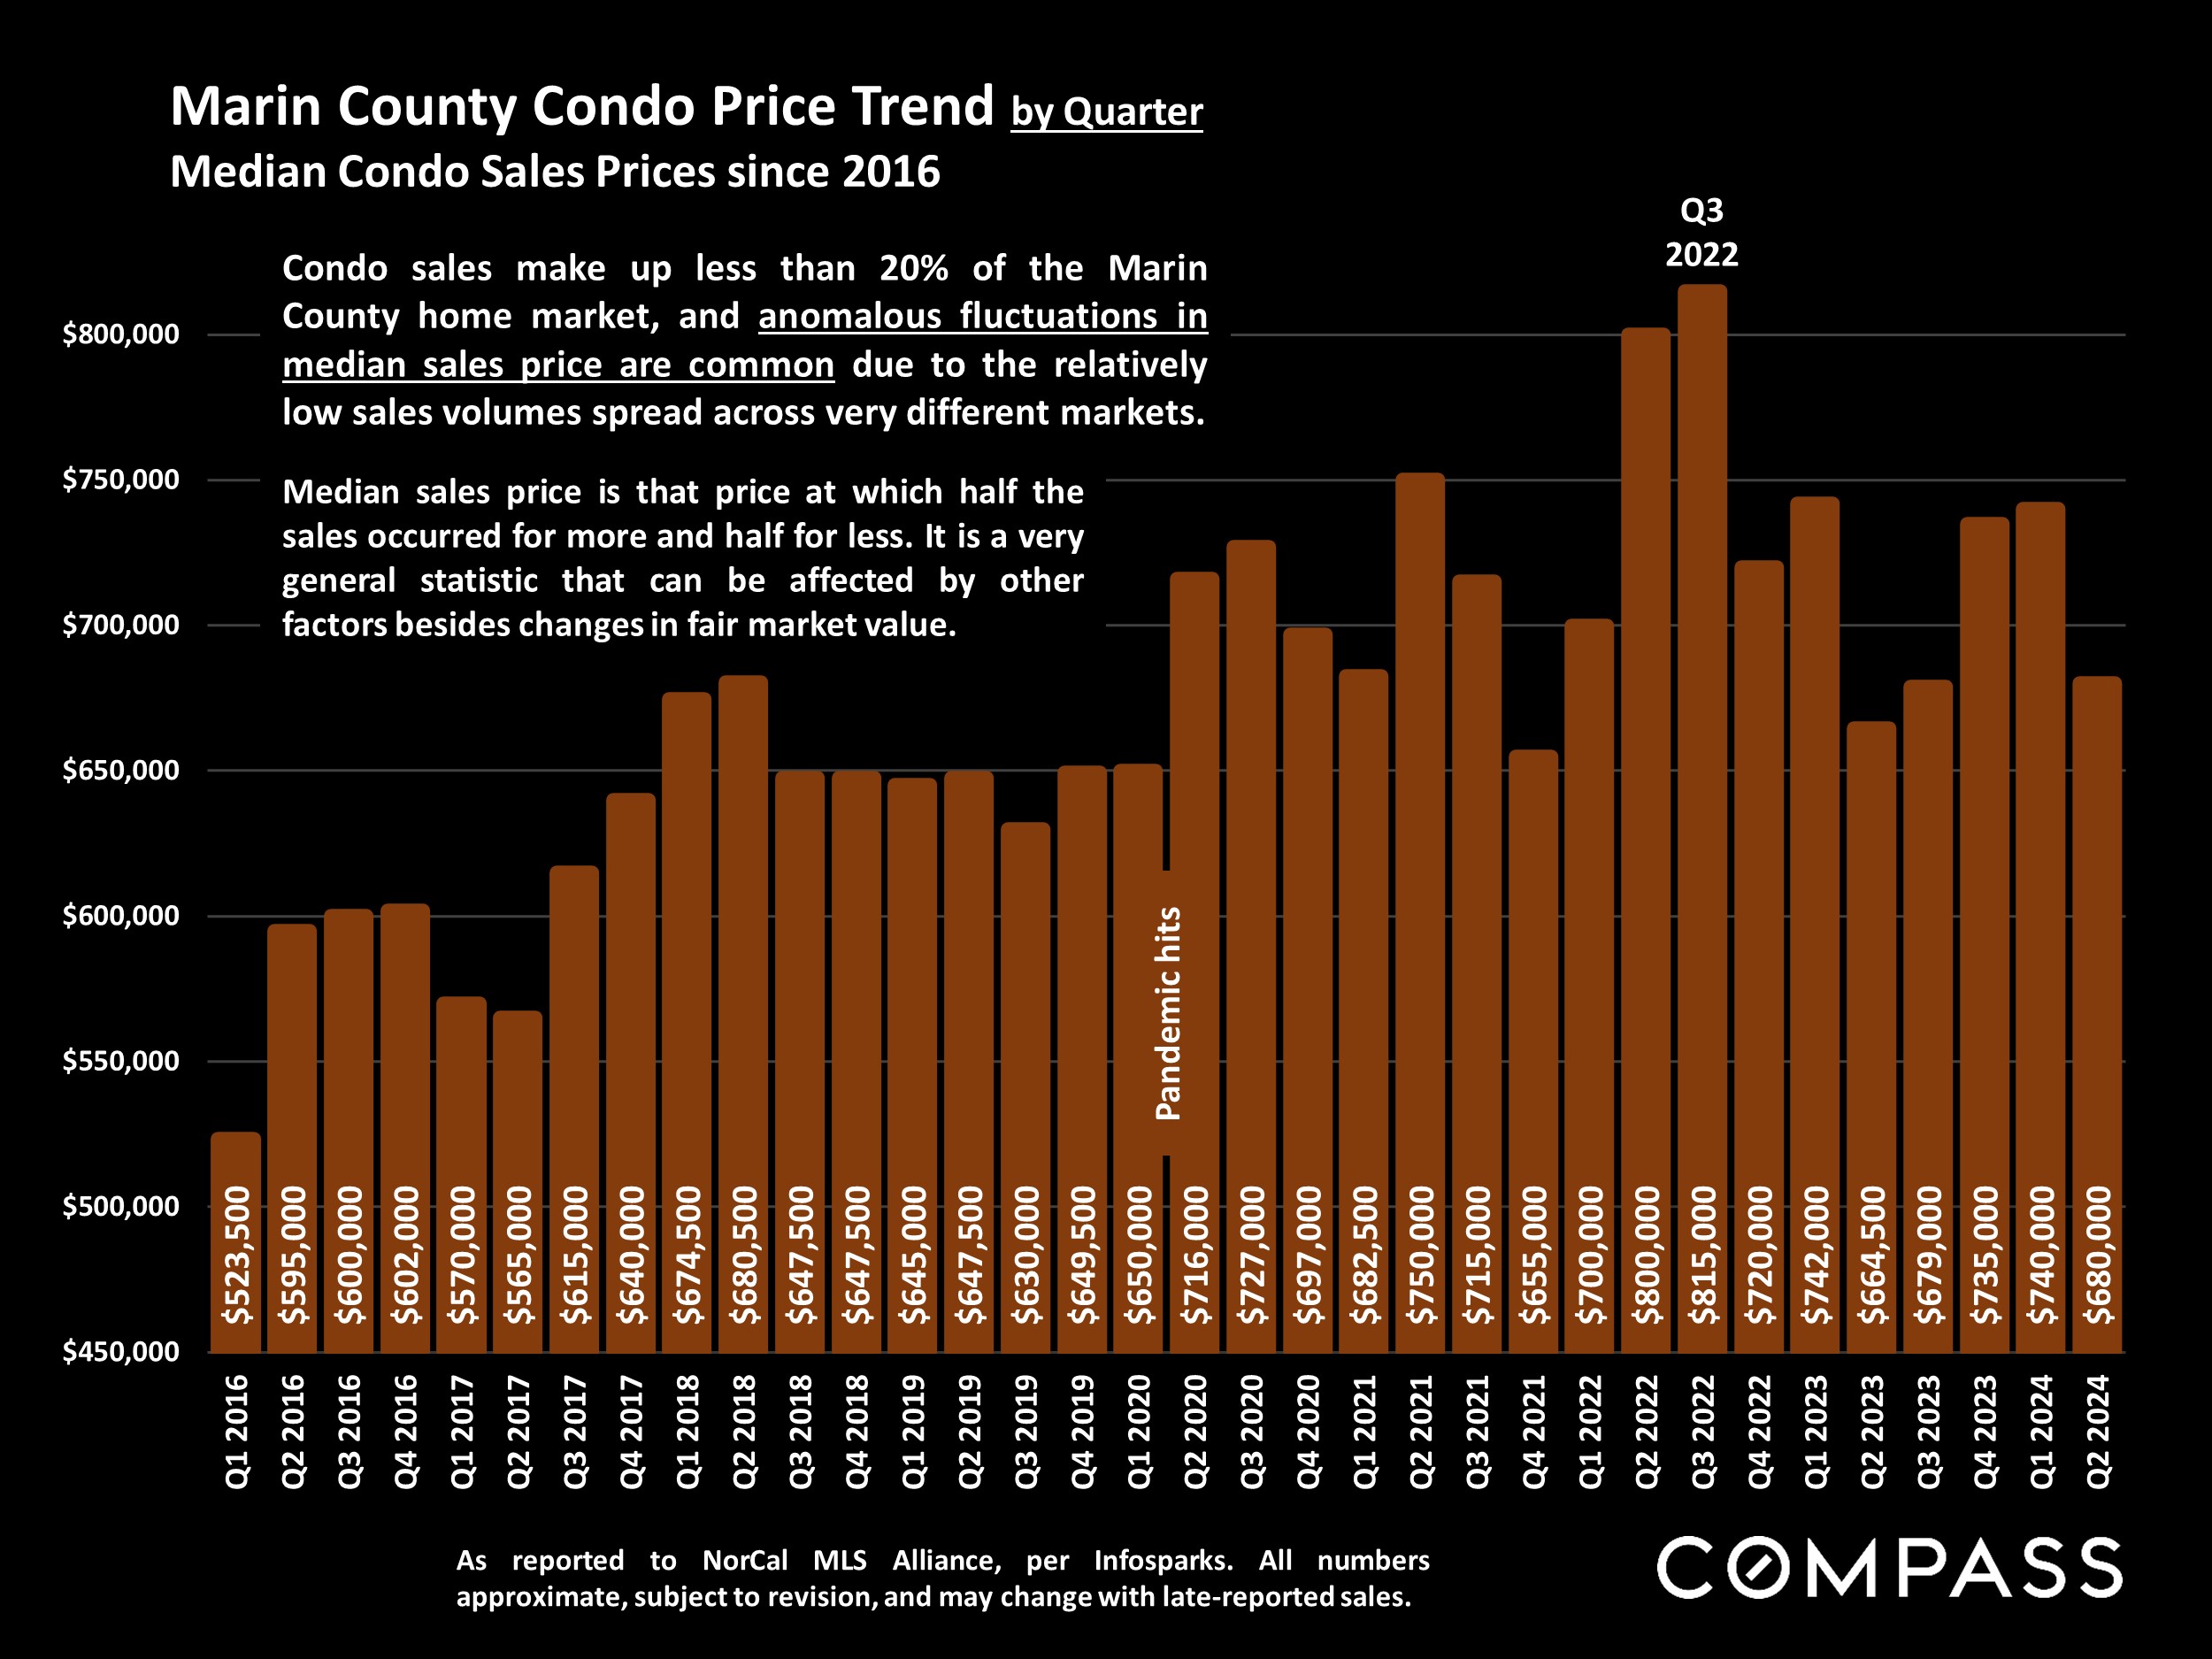
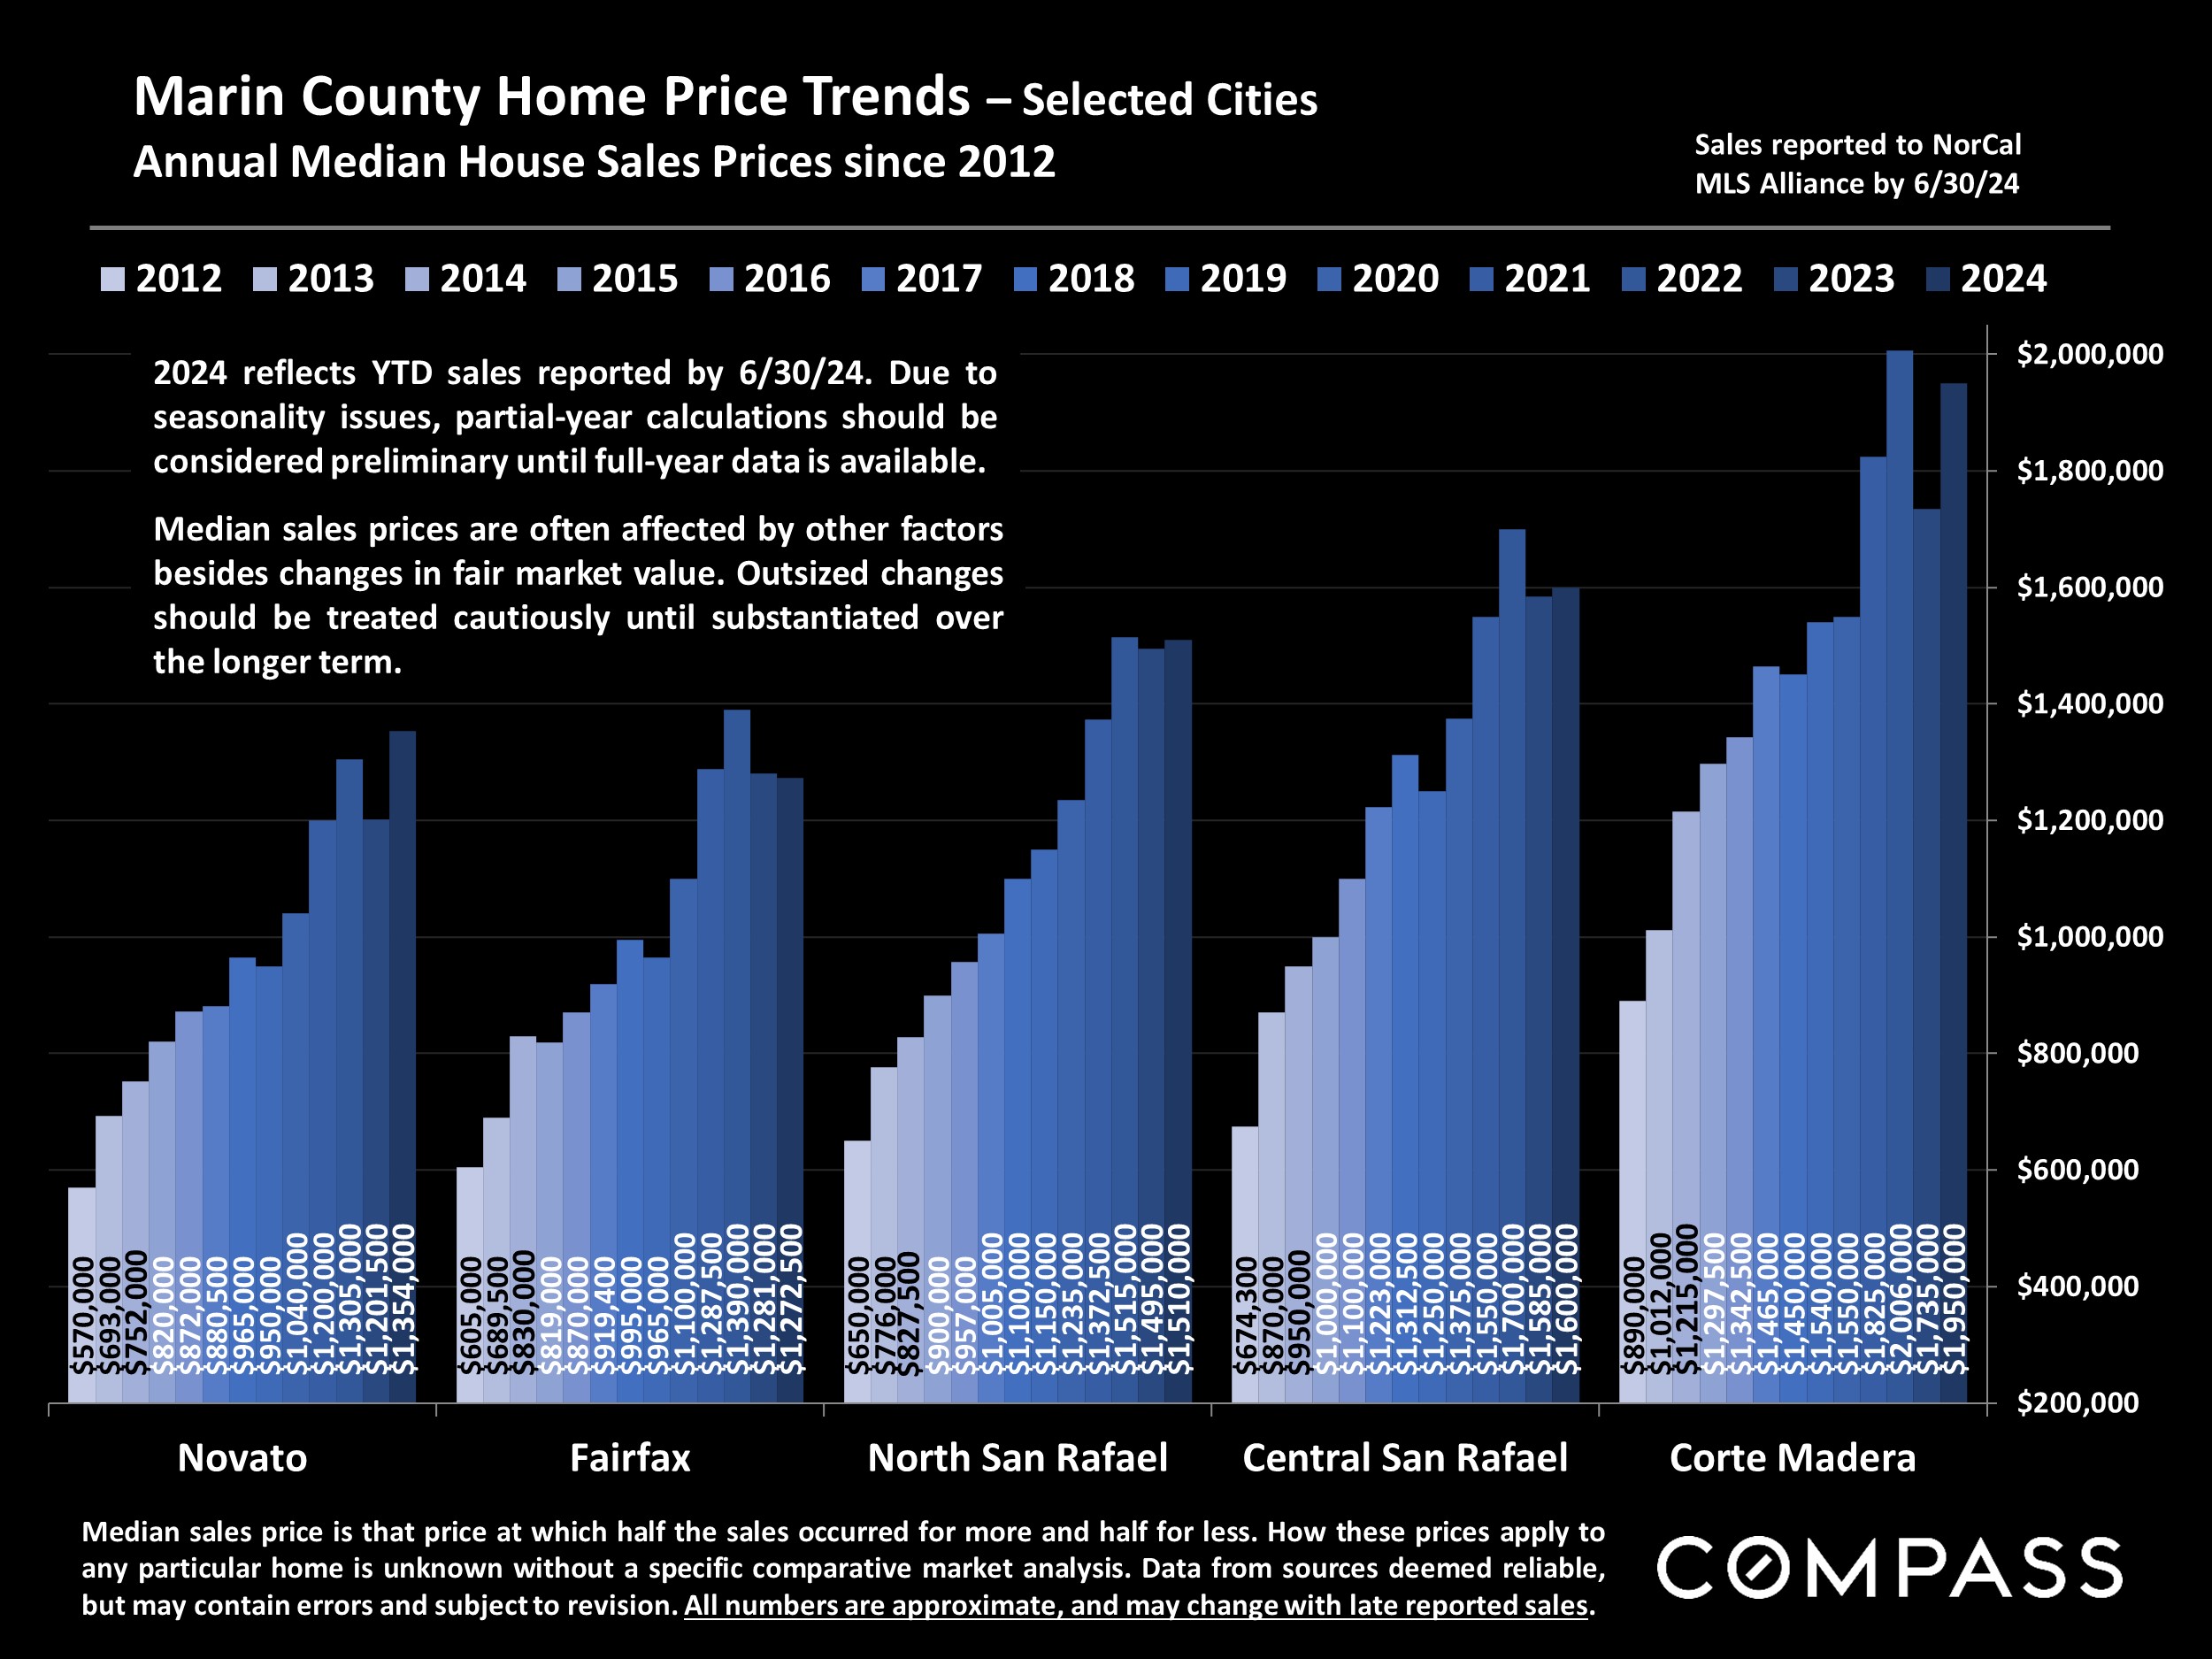
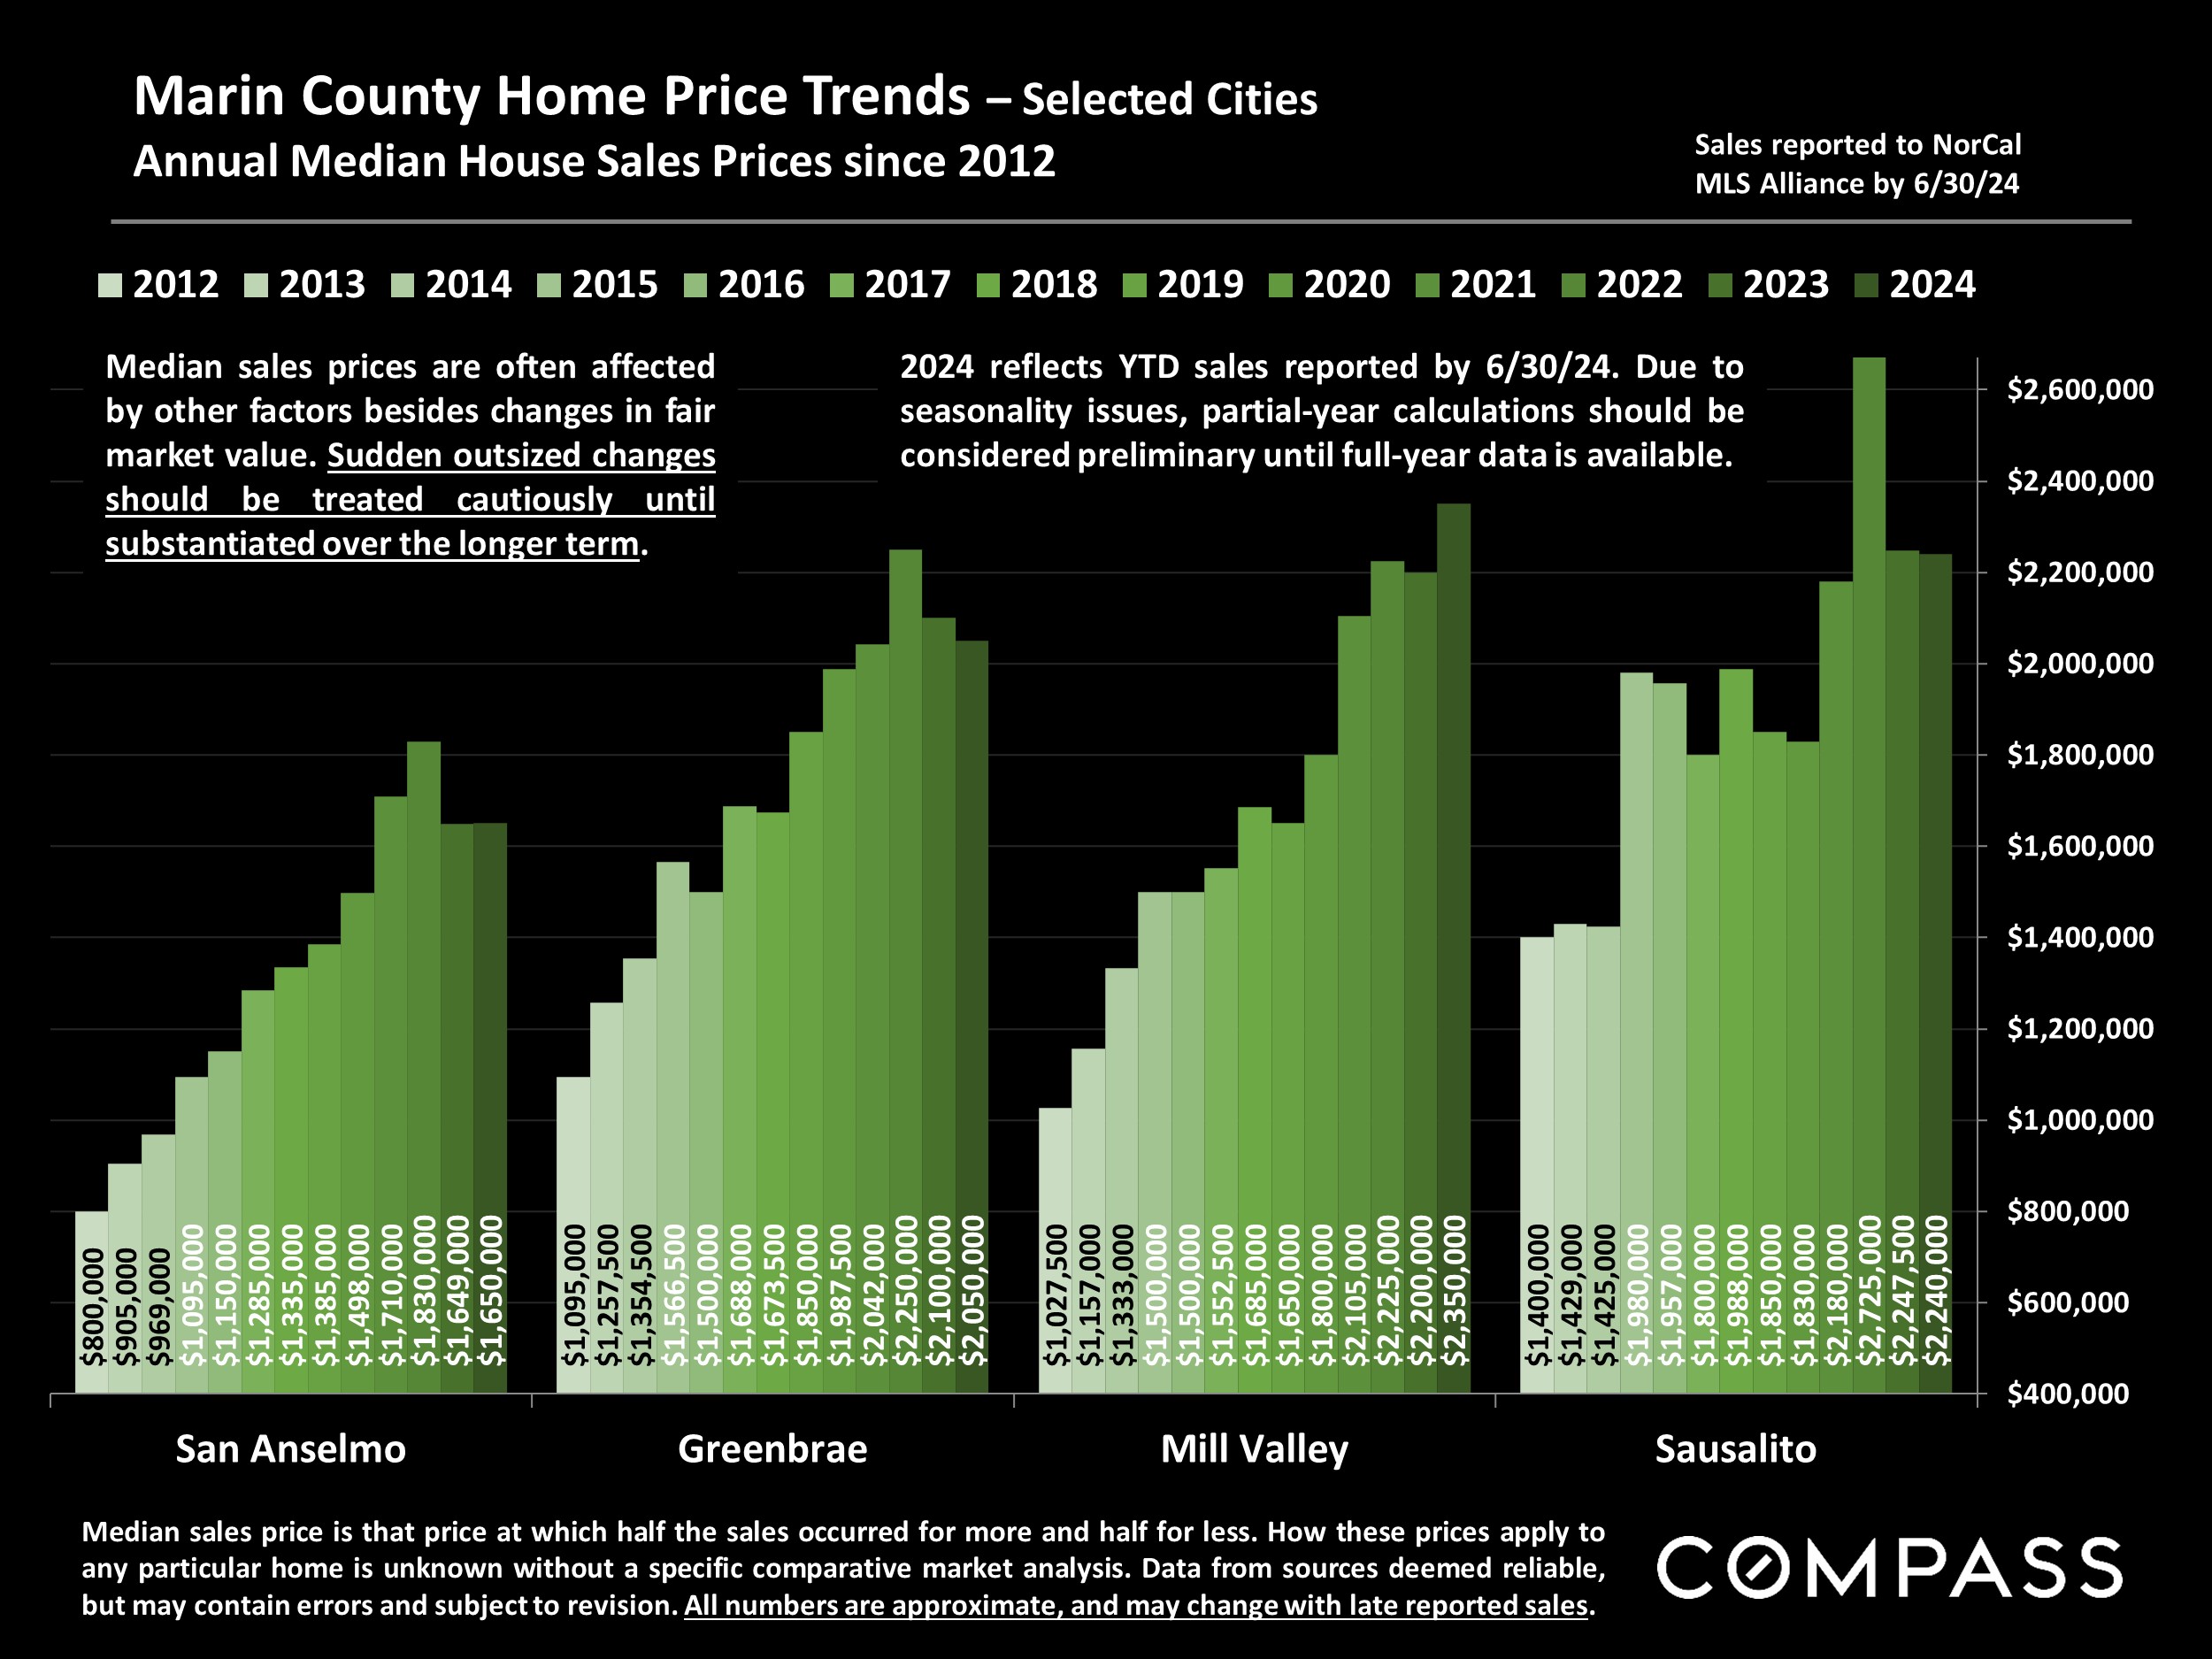
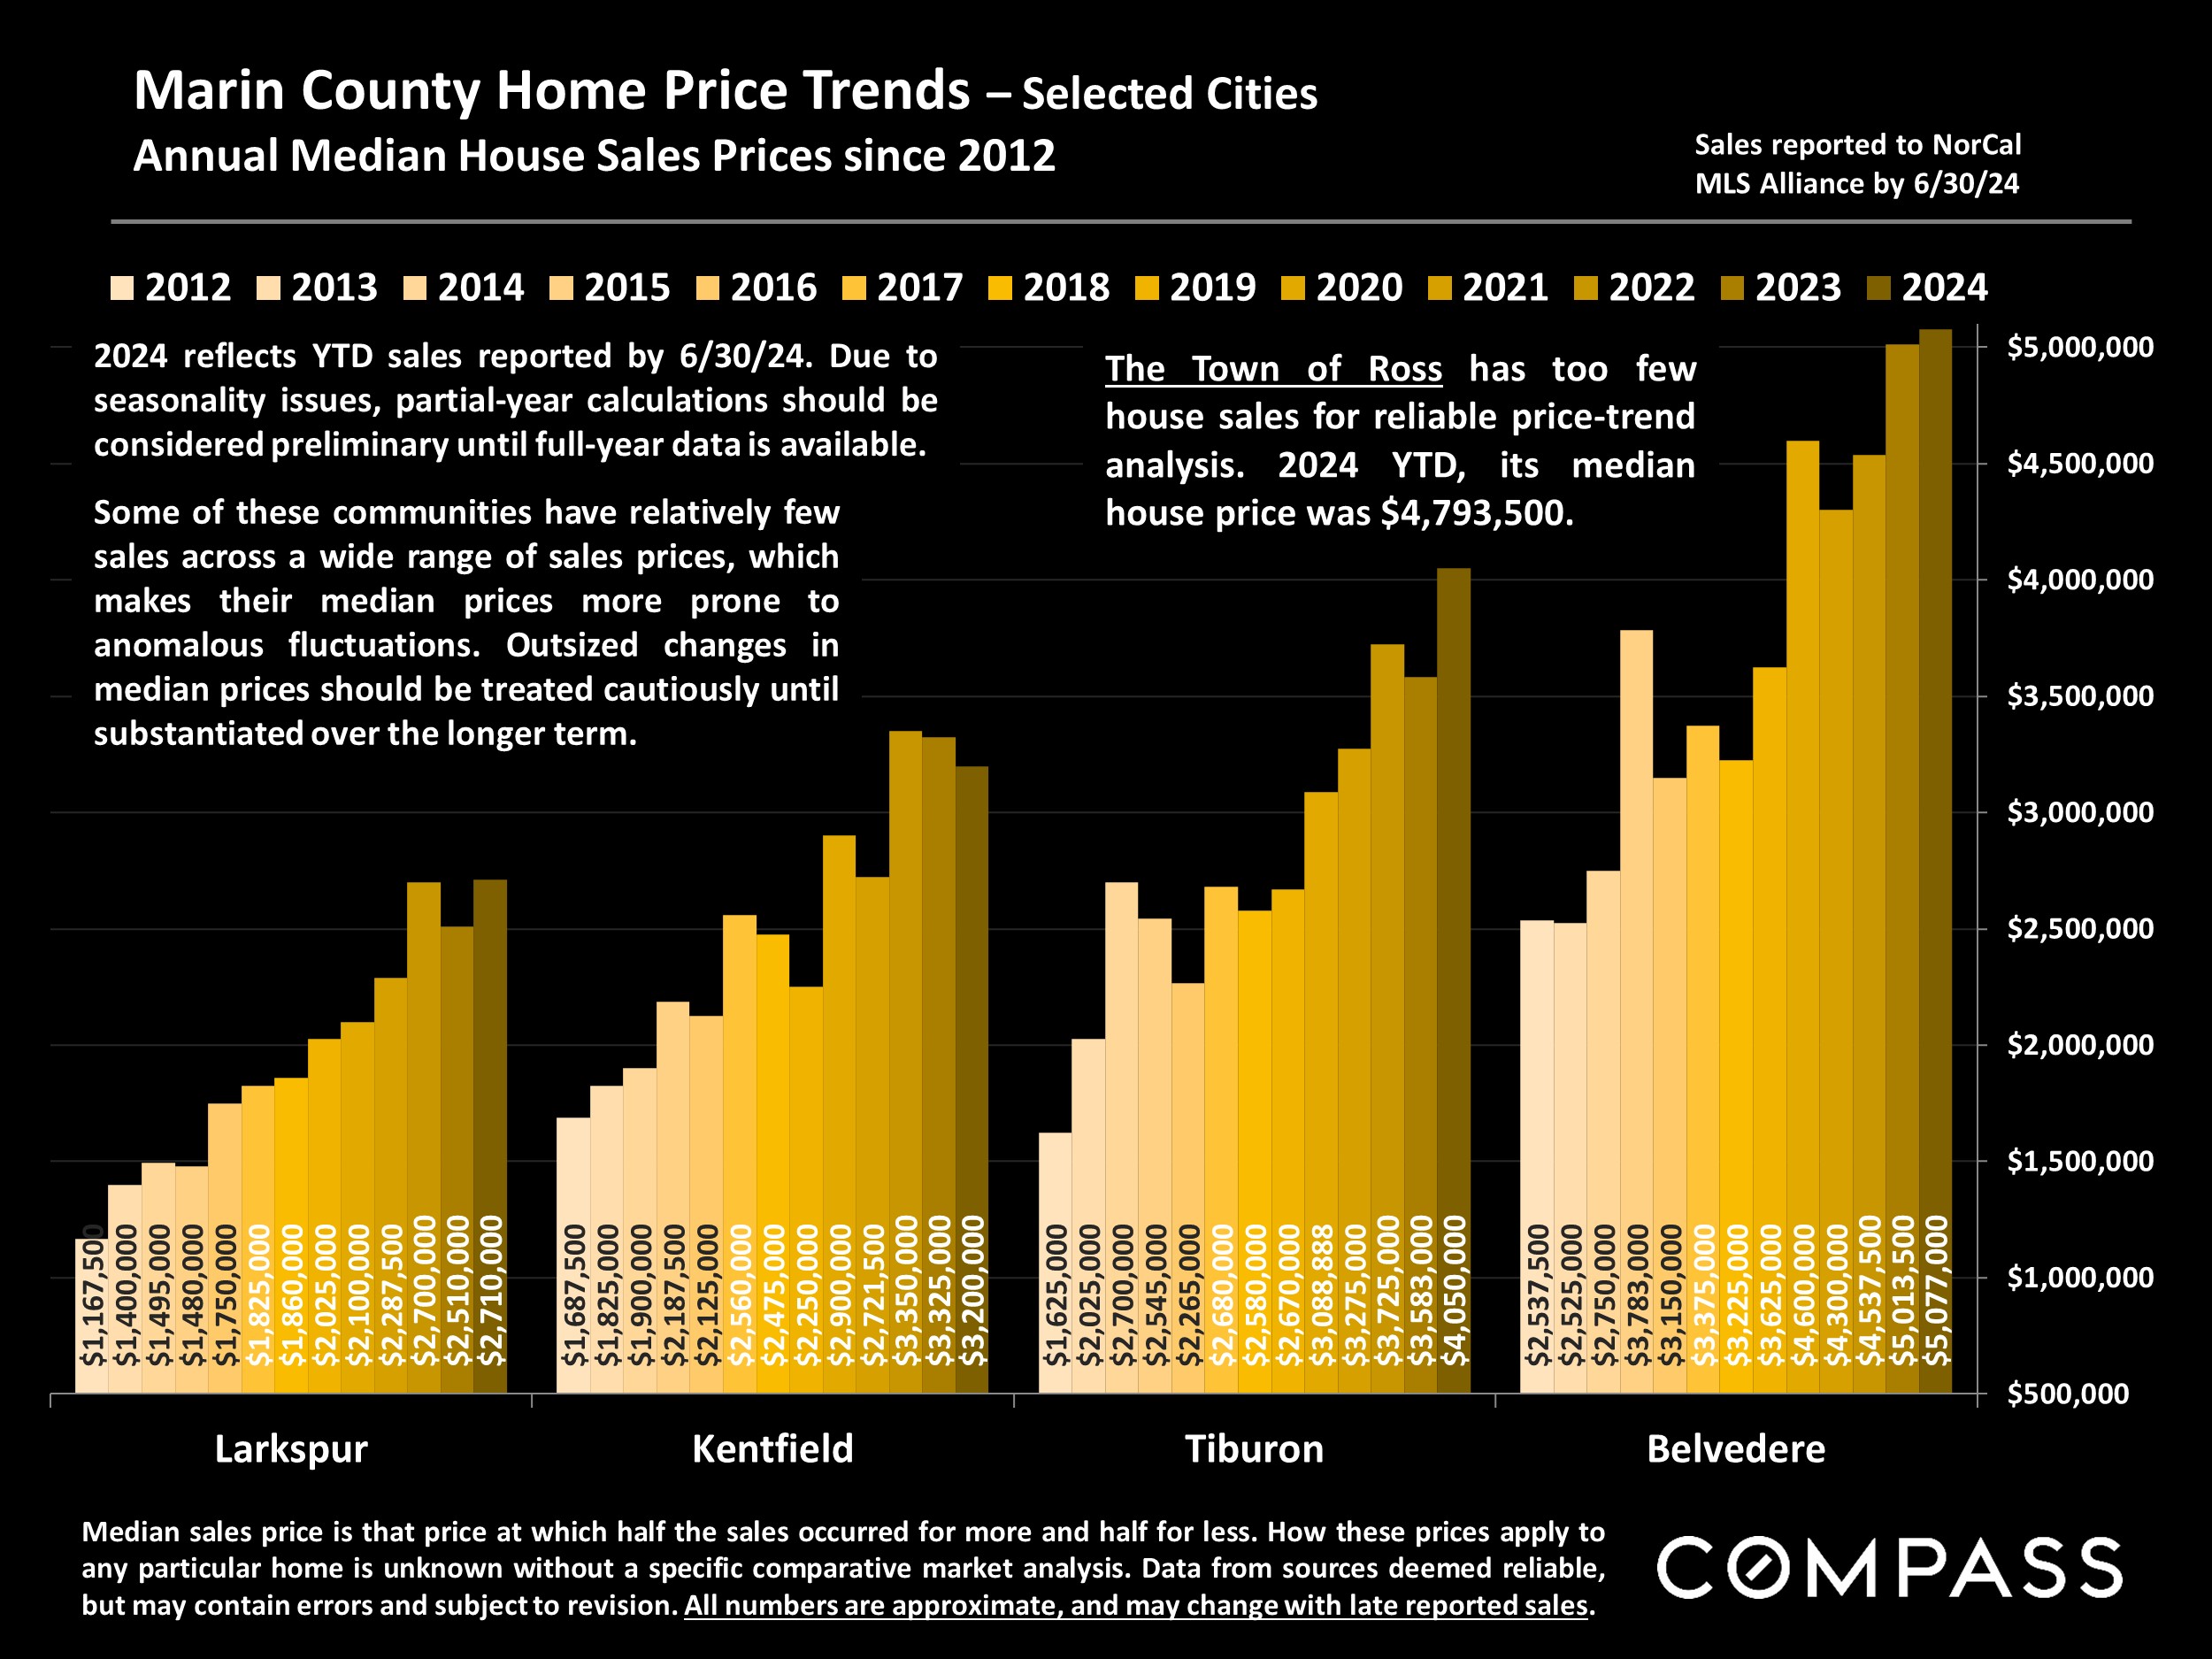
- The Marin median house sales price in Q2 2024 was unchanged from Q2 2023. The median condo sales price ticked up slightly.
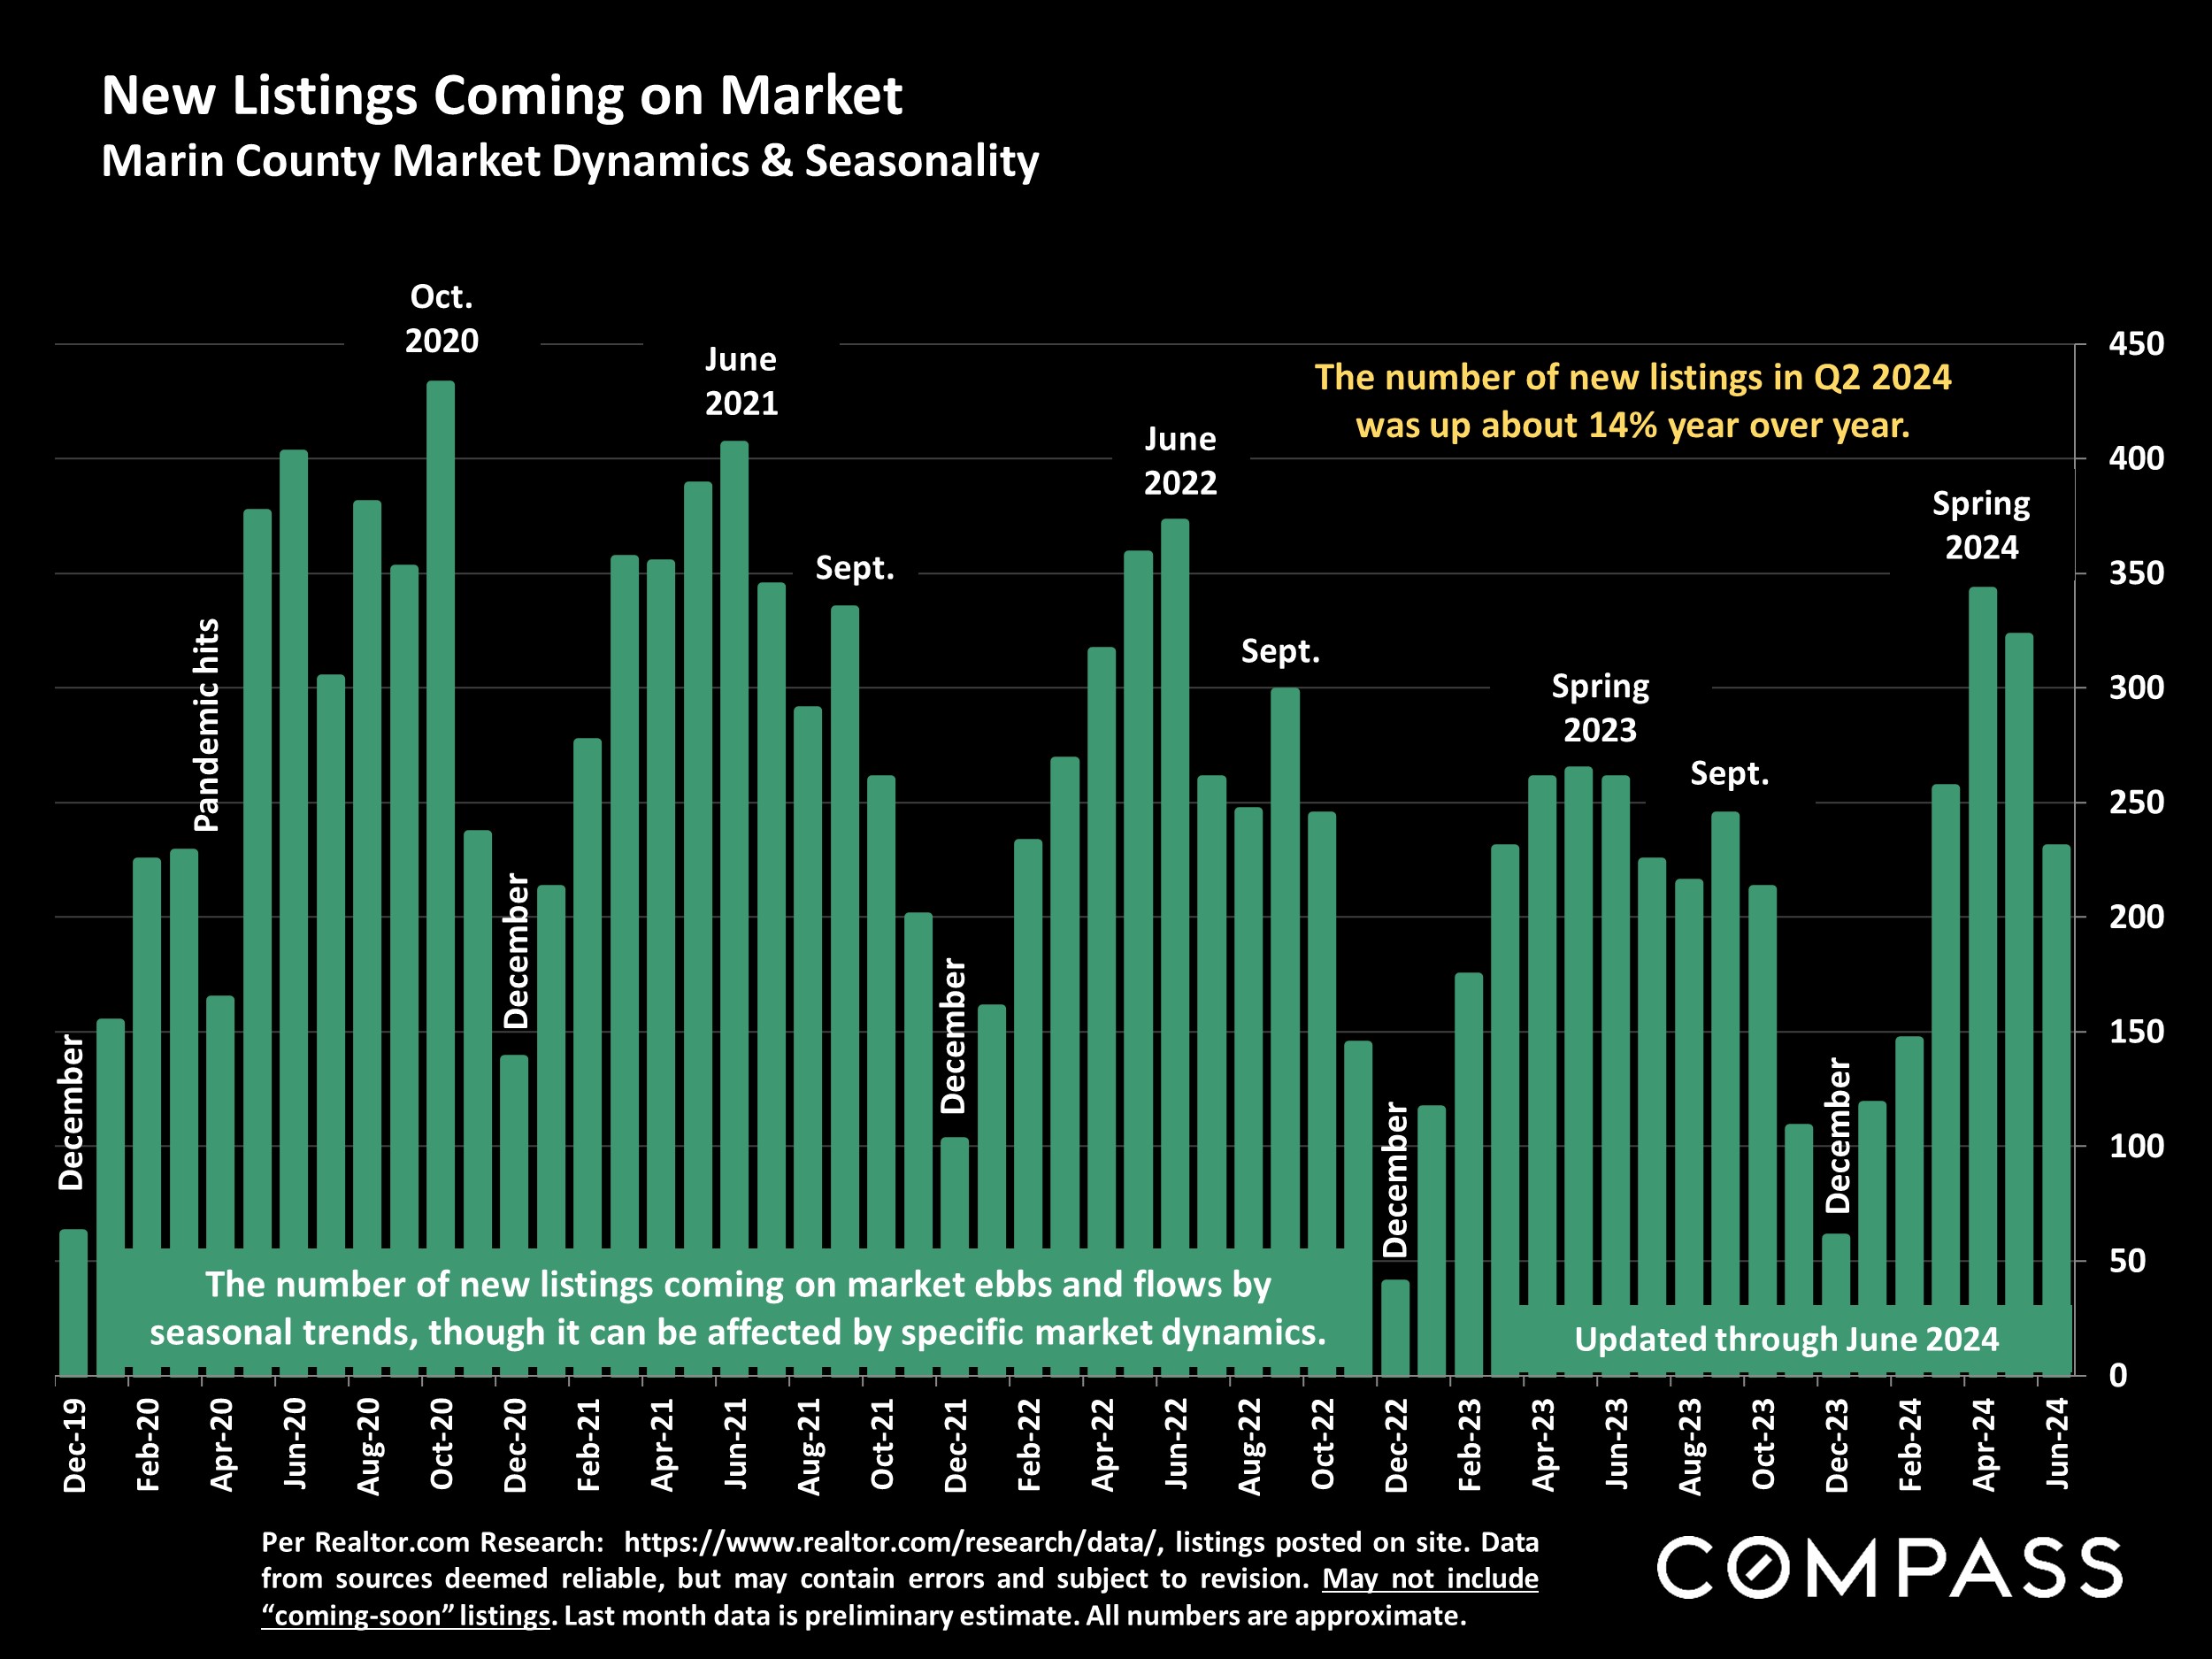
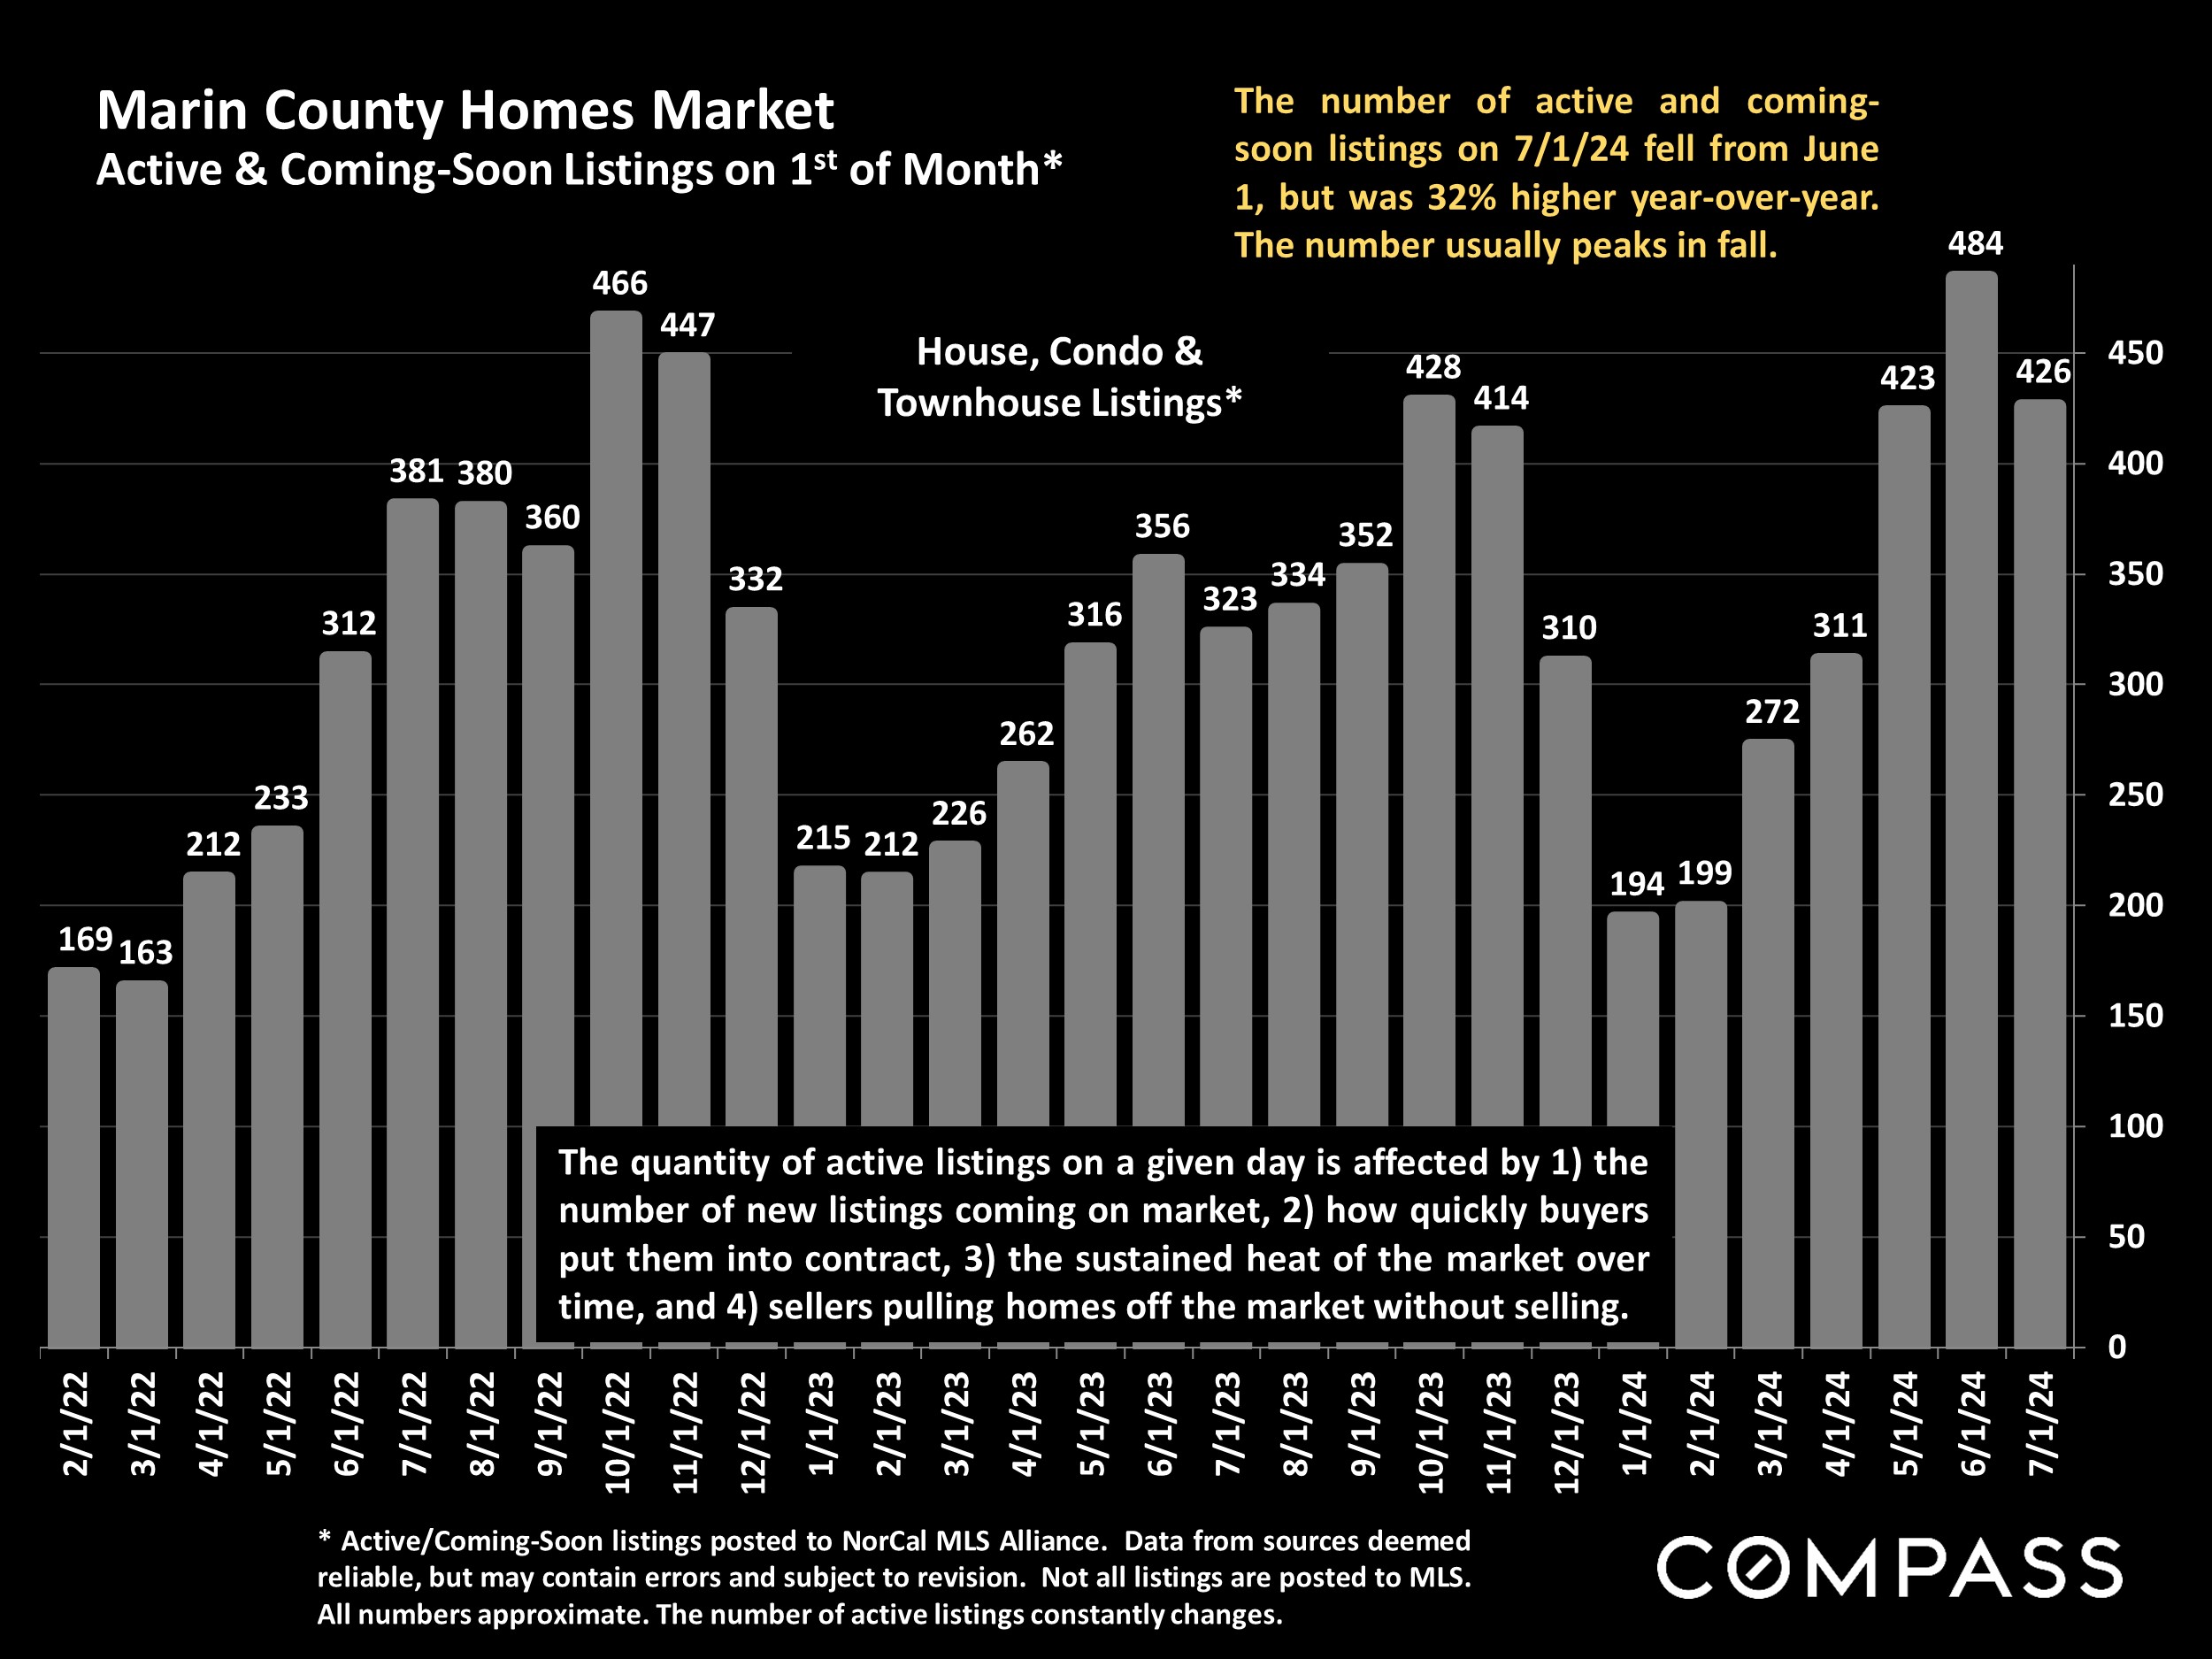
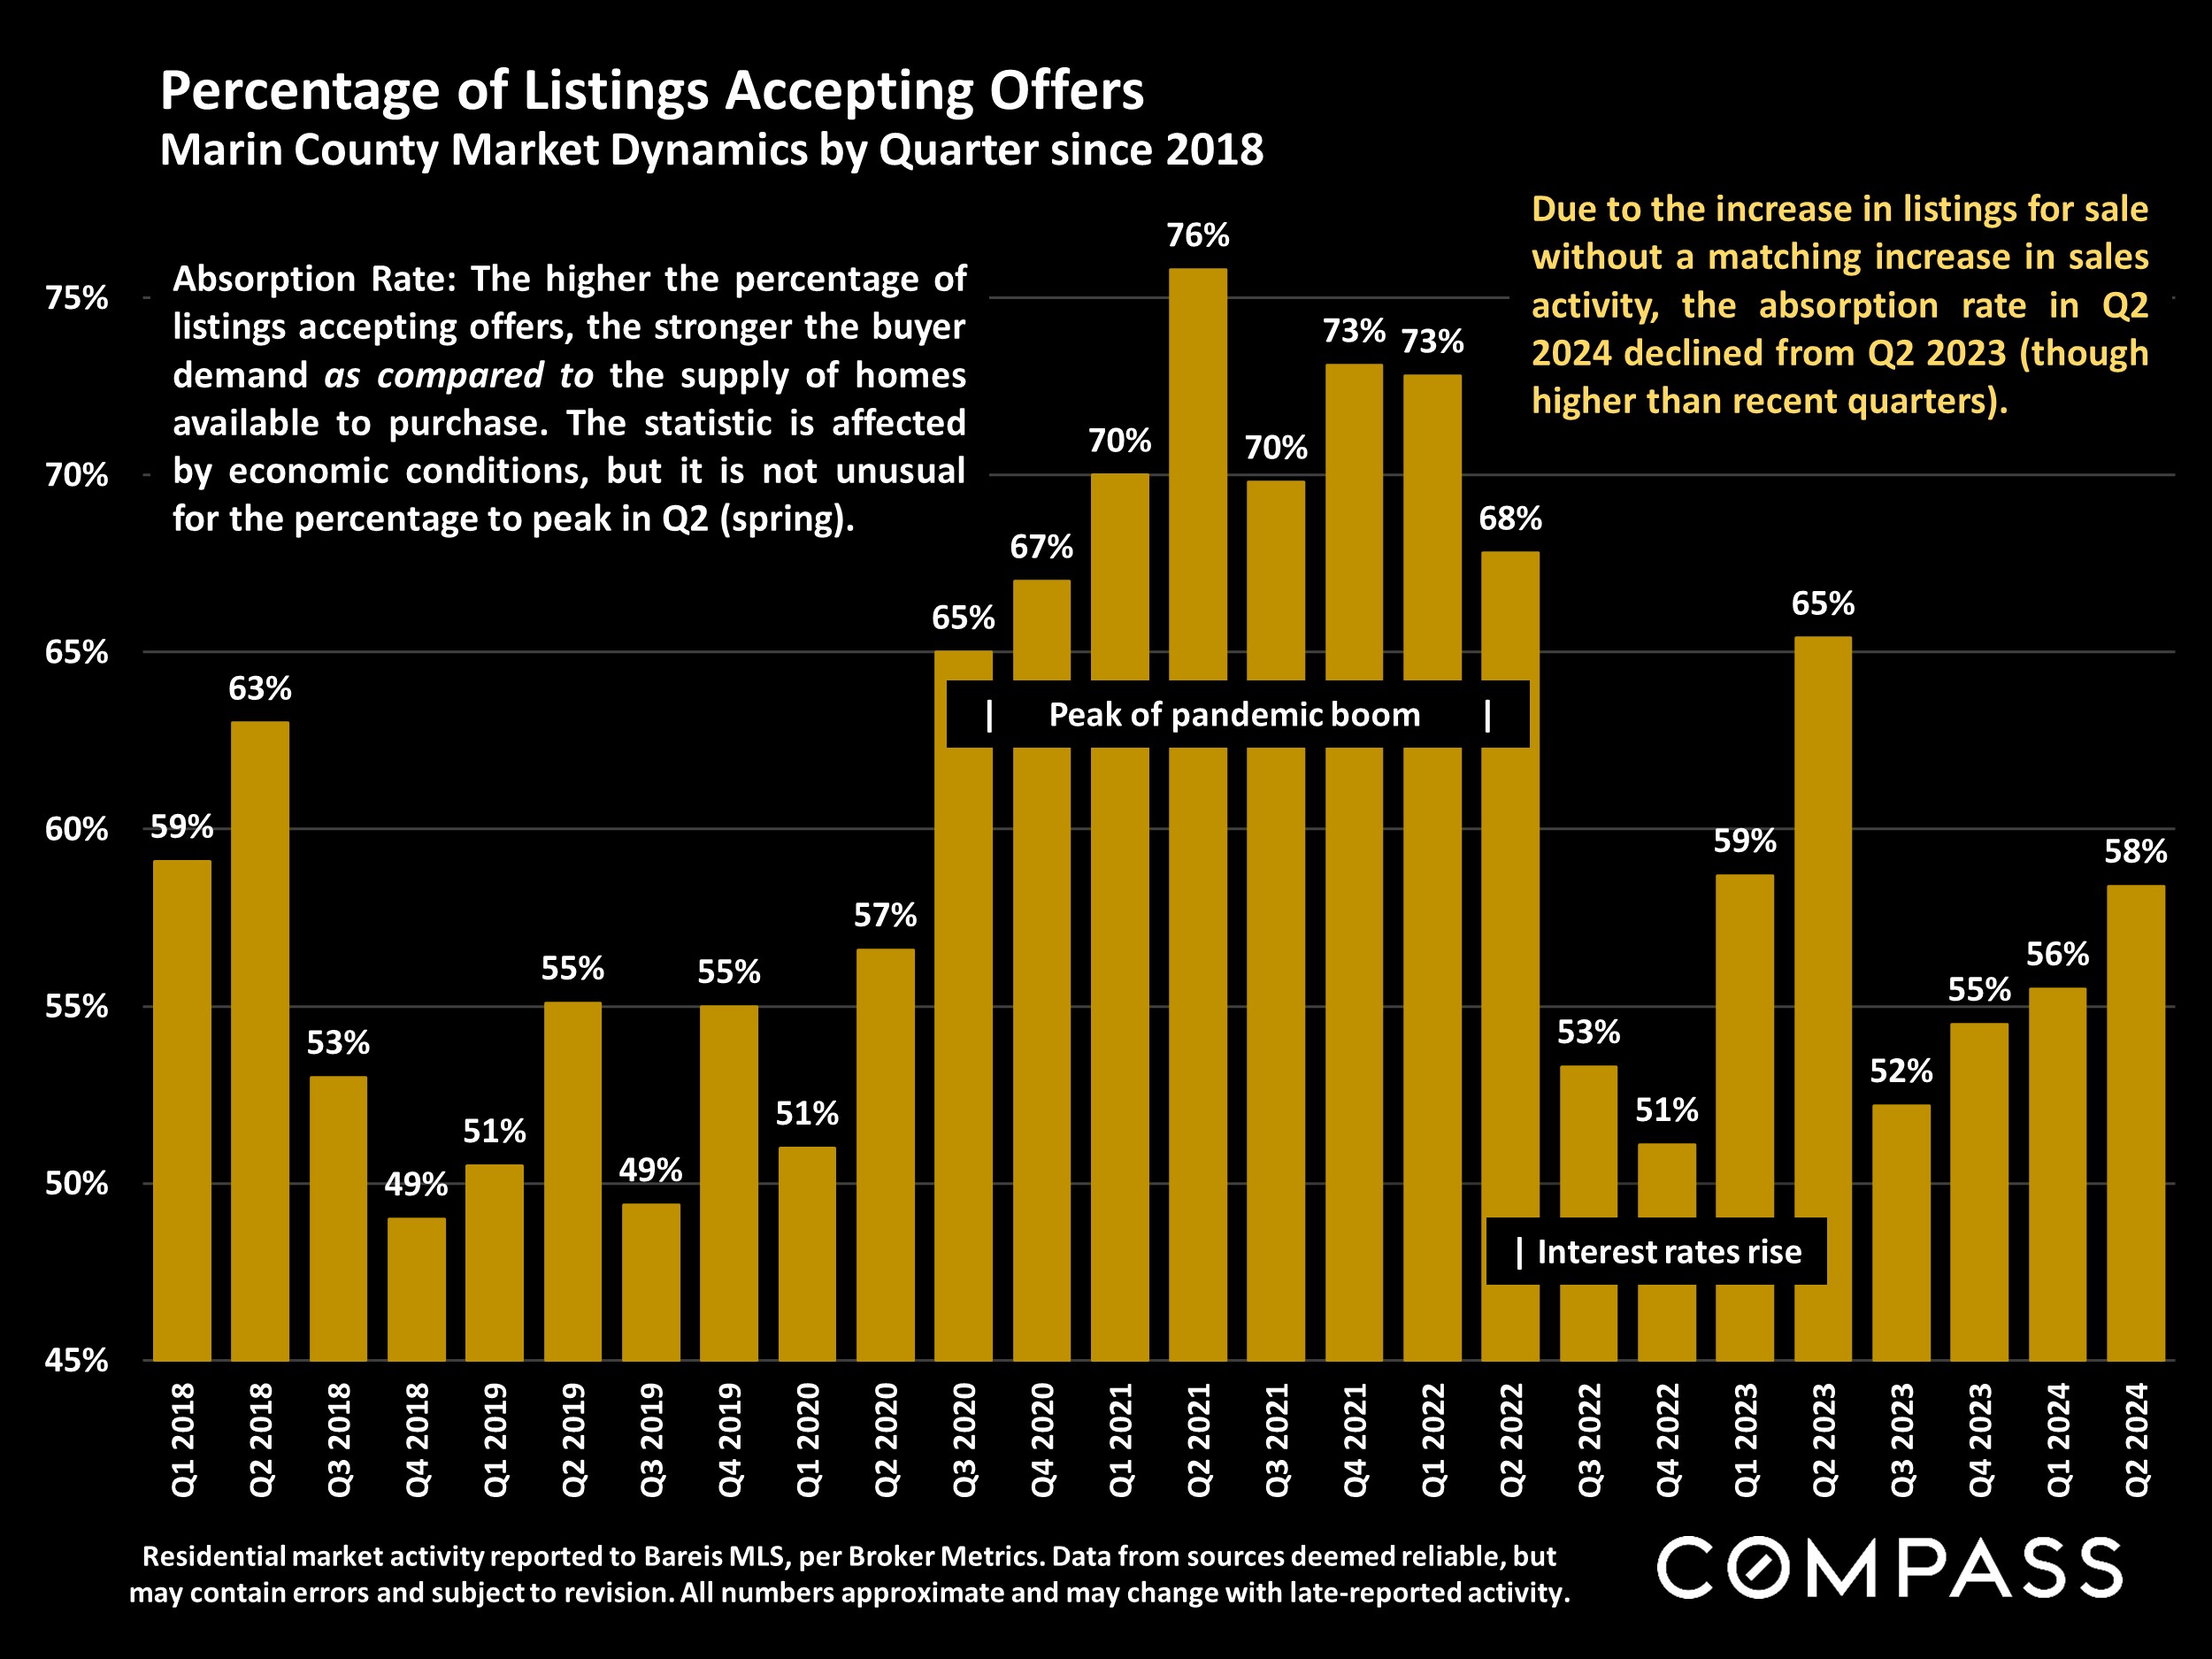
- The number of new listings coming on market in Q2 was up about 14% year over year, and the number of homes for sale on July 1st jumped 32%. Substantial increases in inventory will typically cool the market and moderate home price appreciation if there is not a commensurate rise in sales activity.
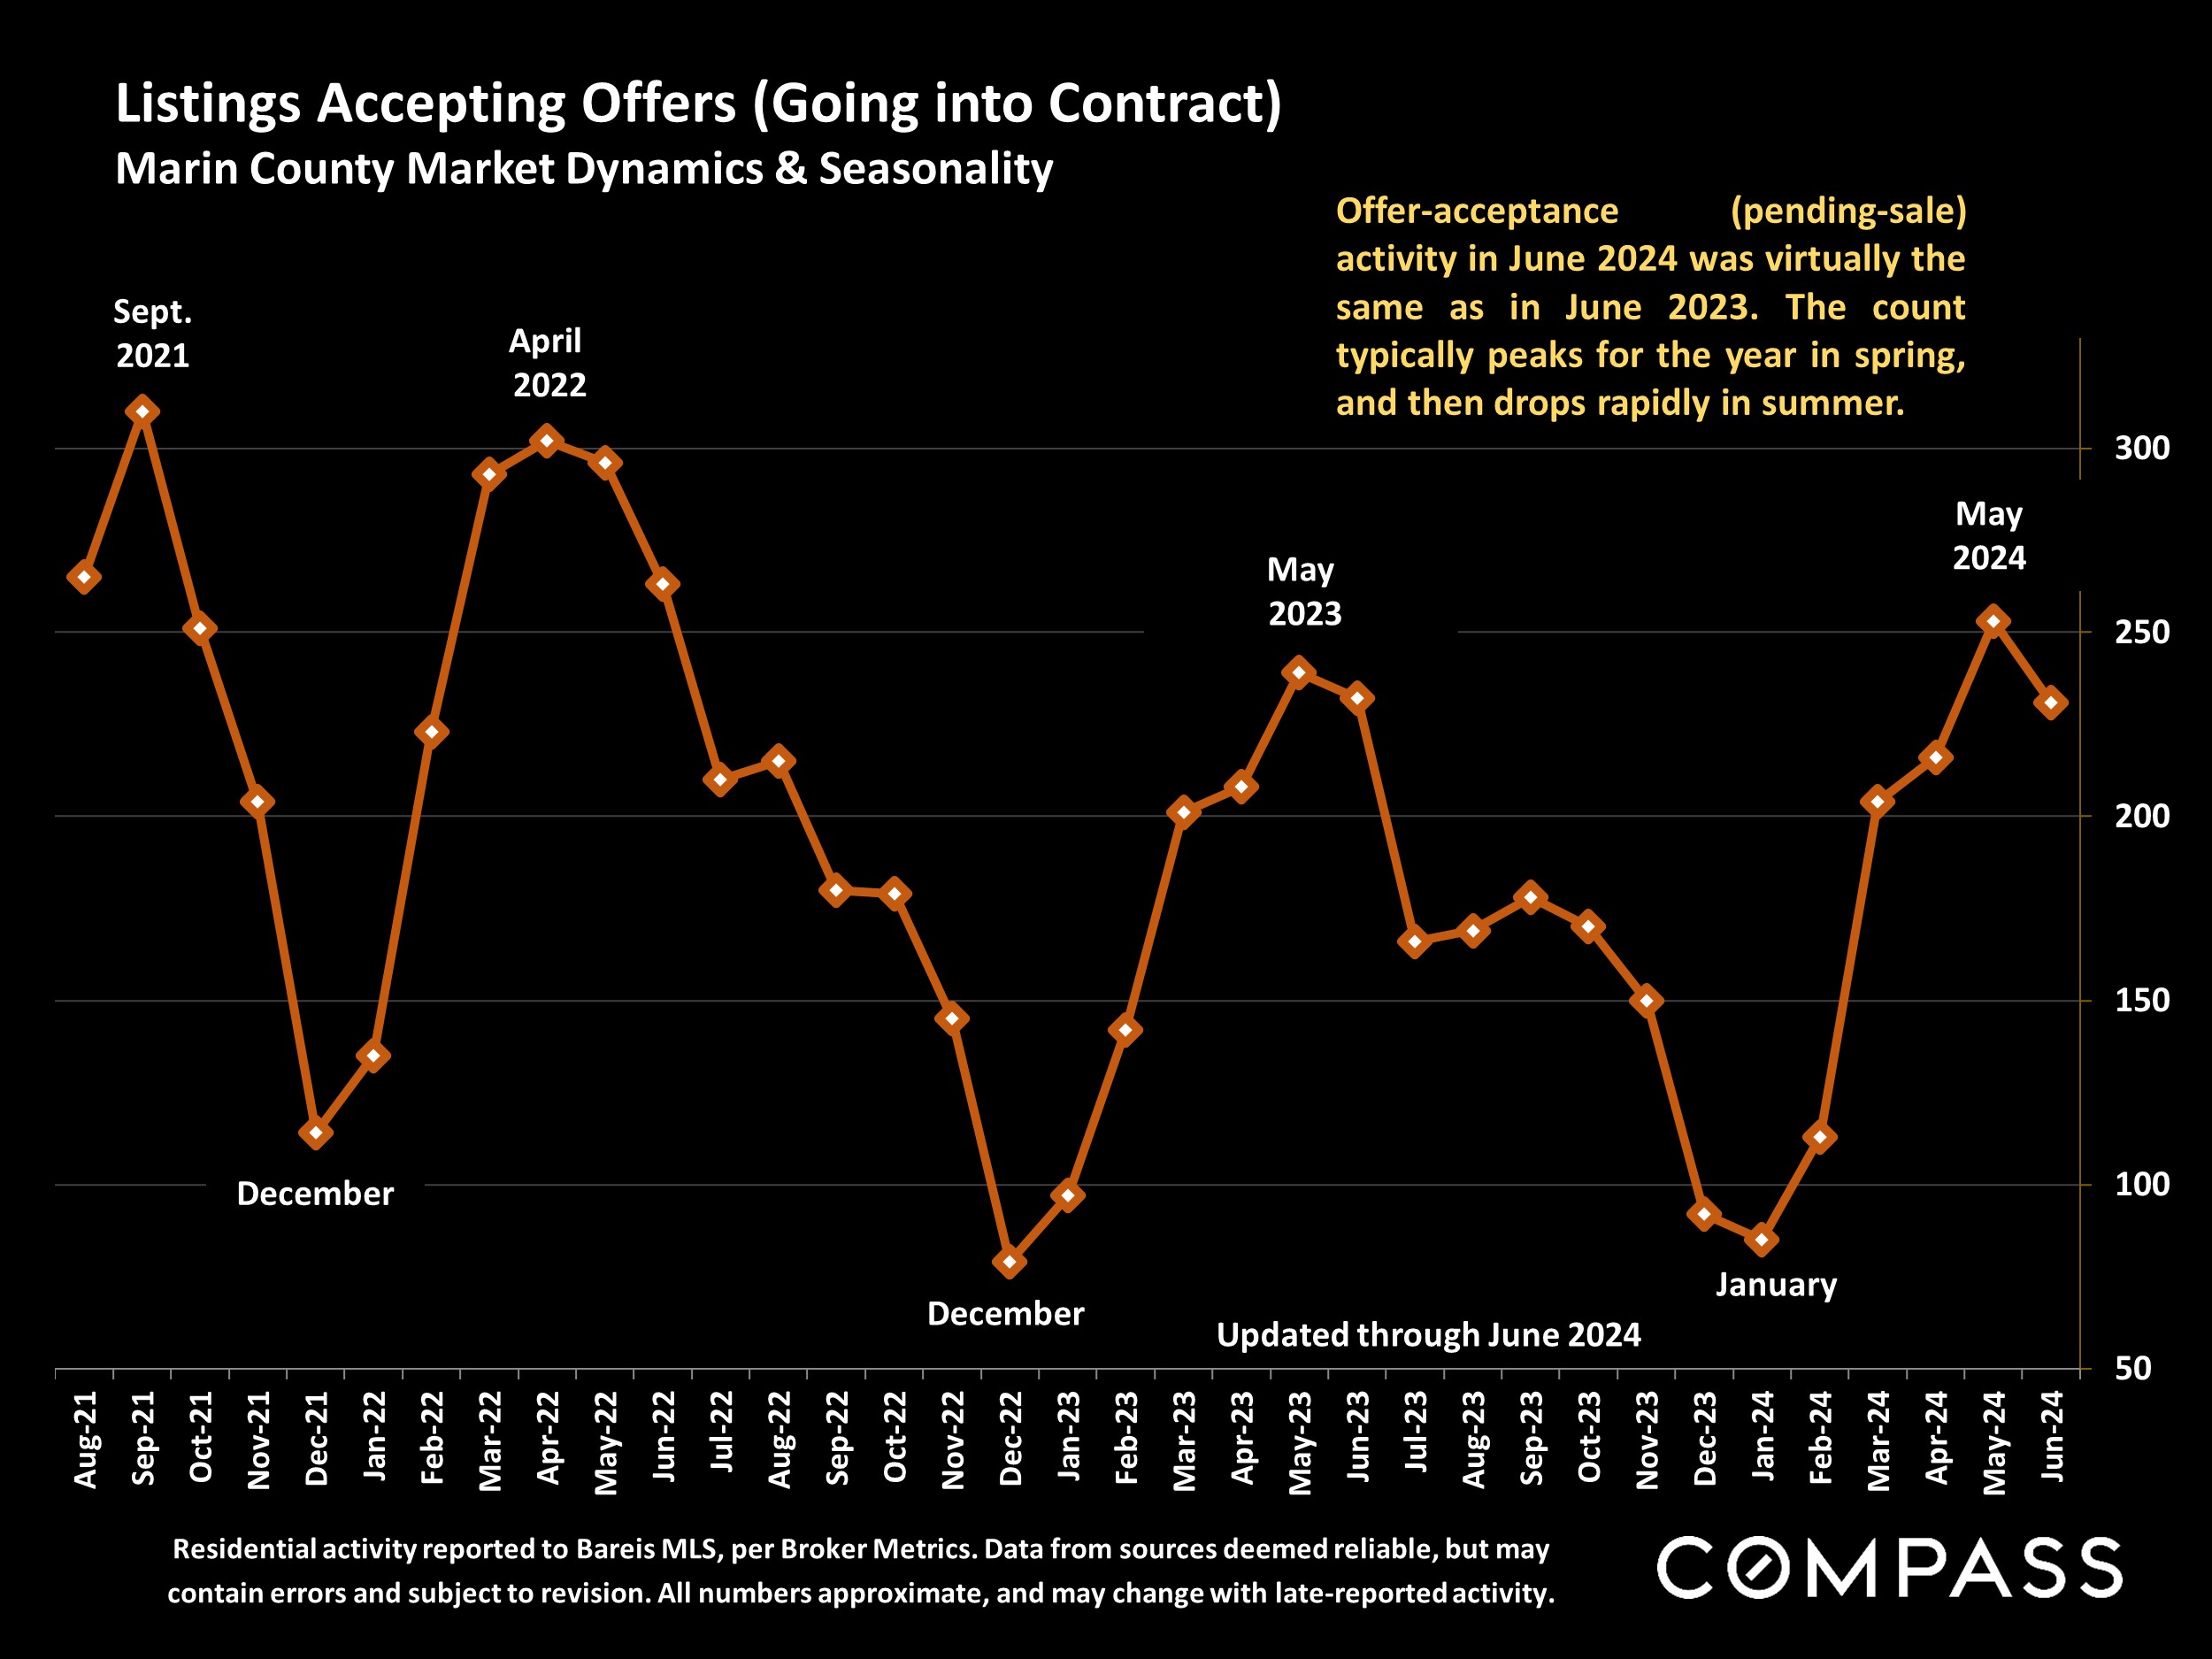
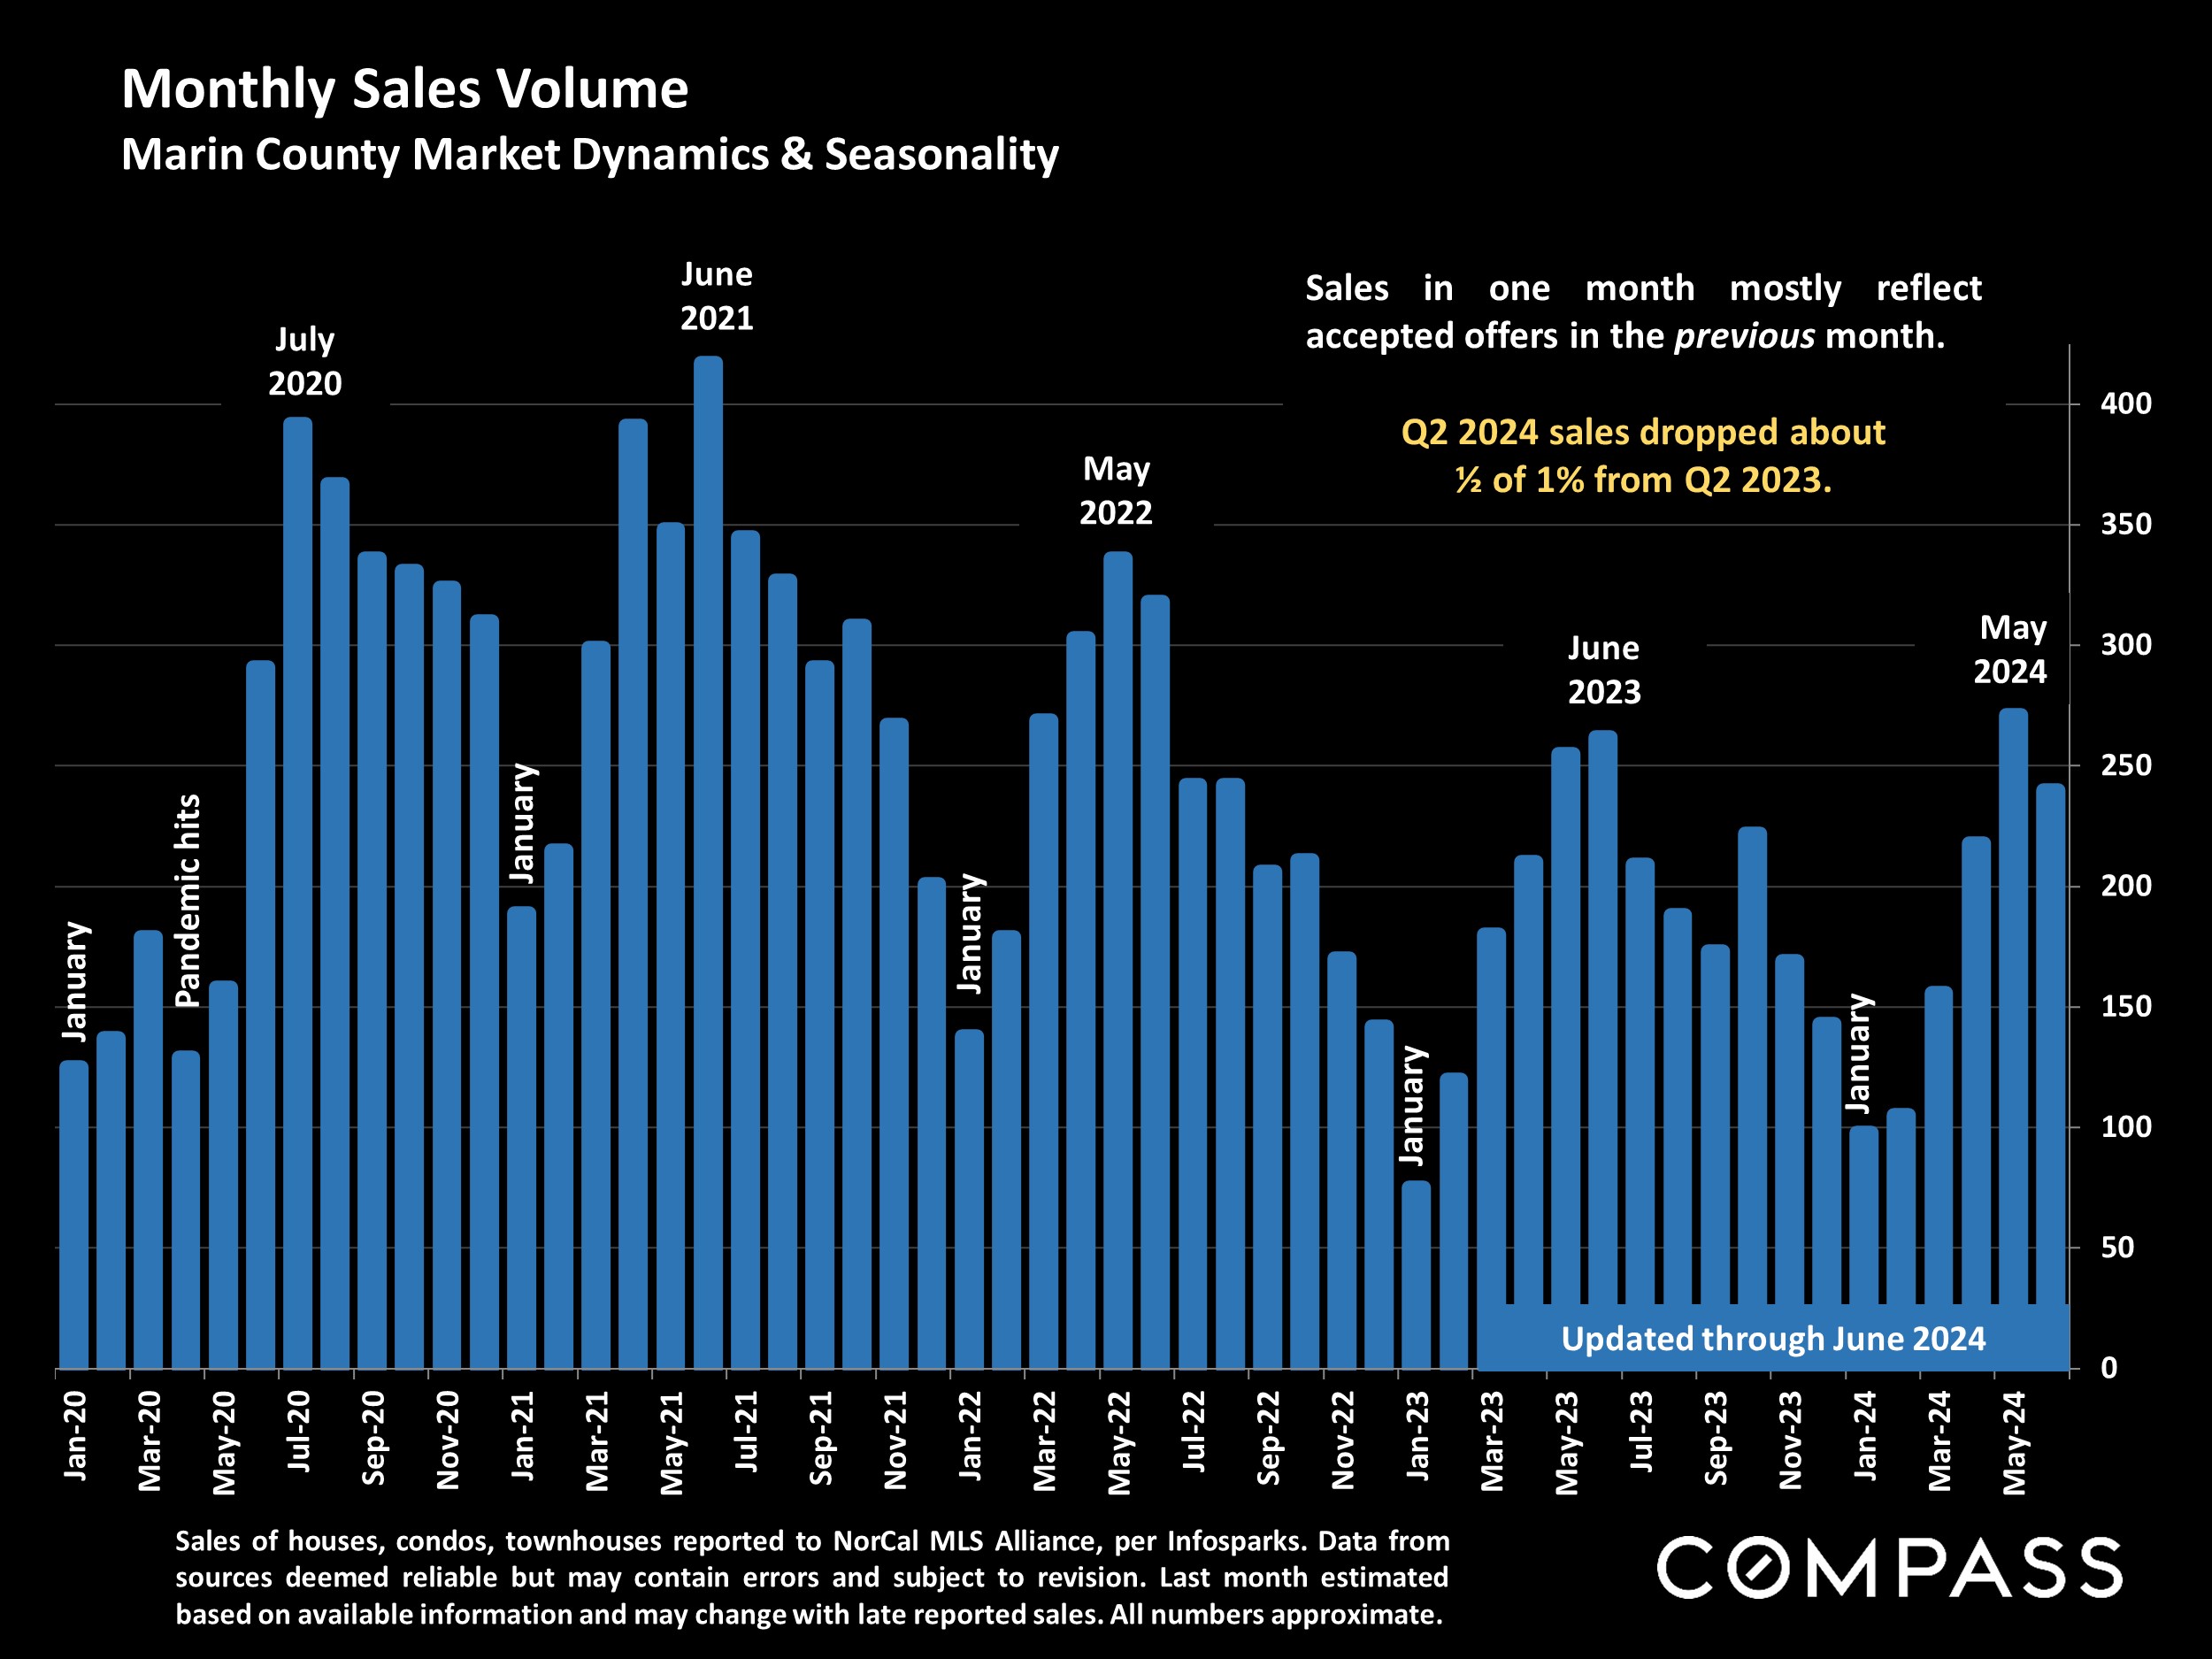
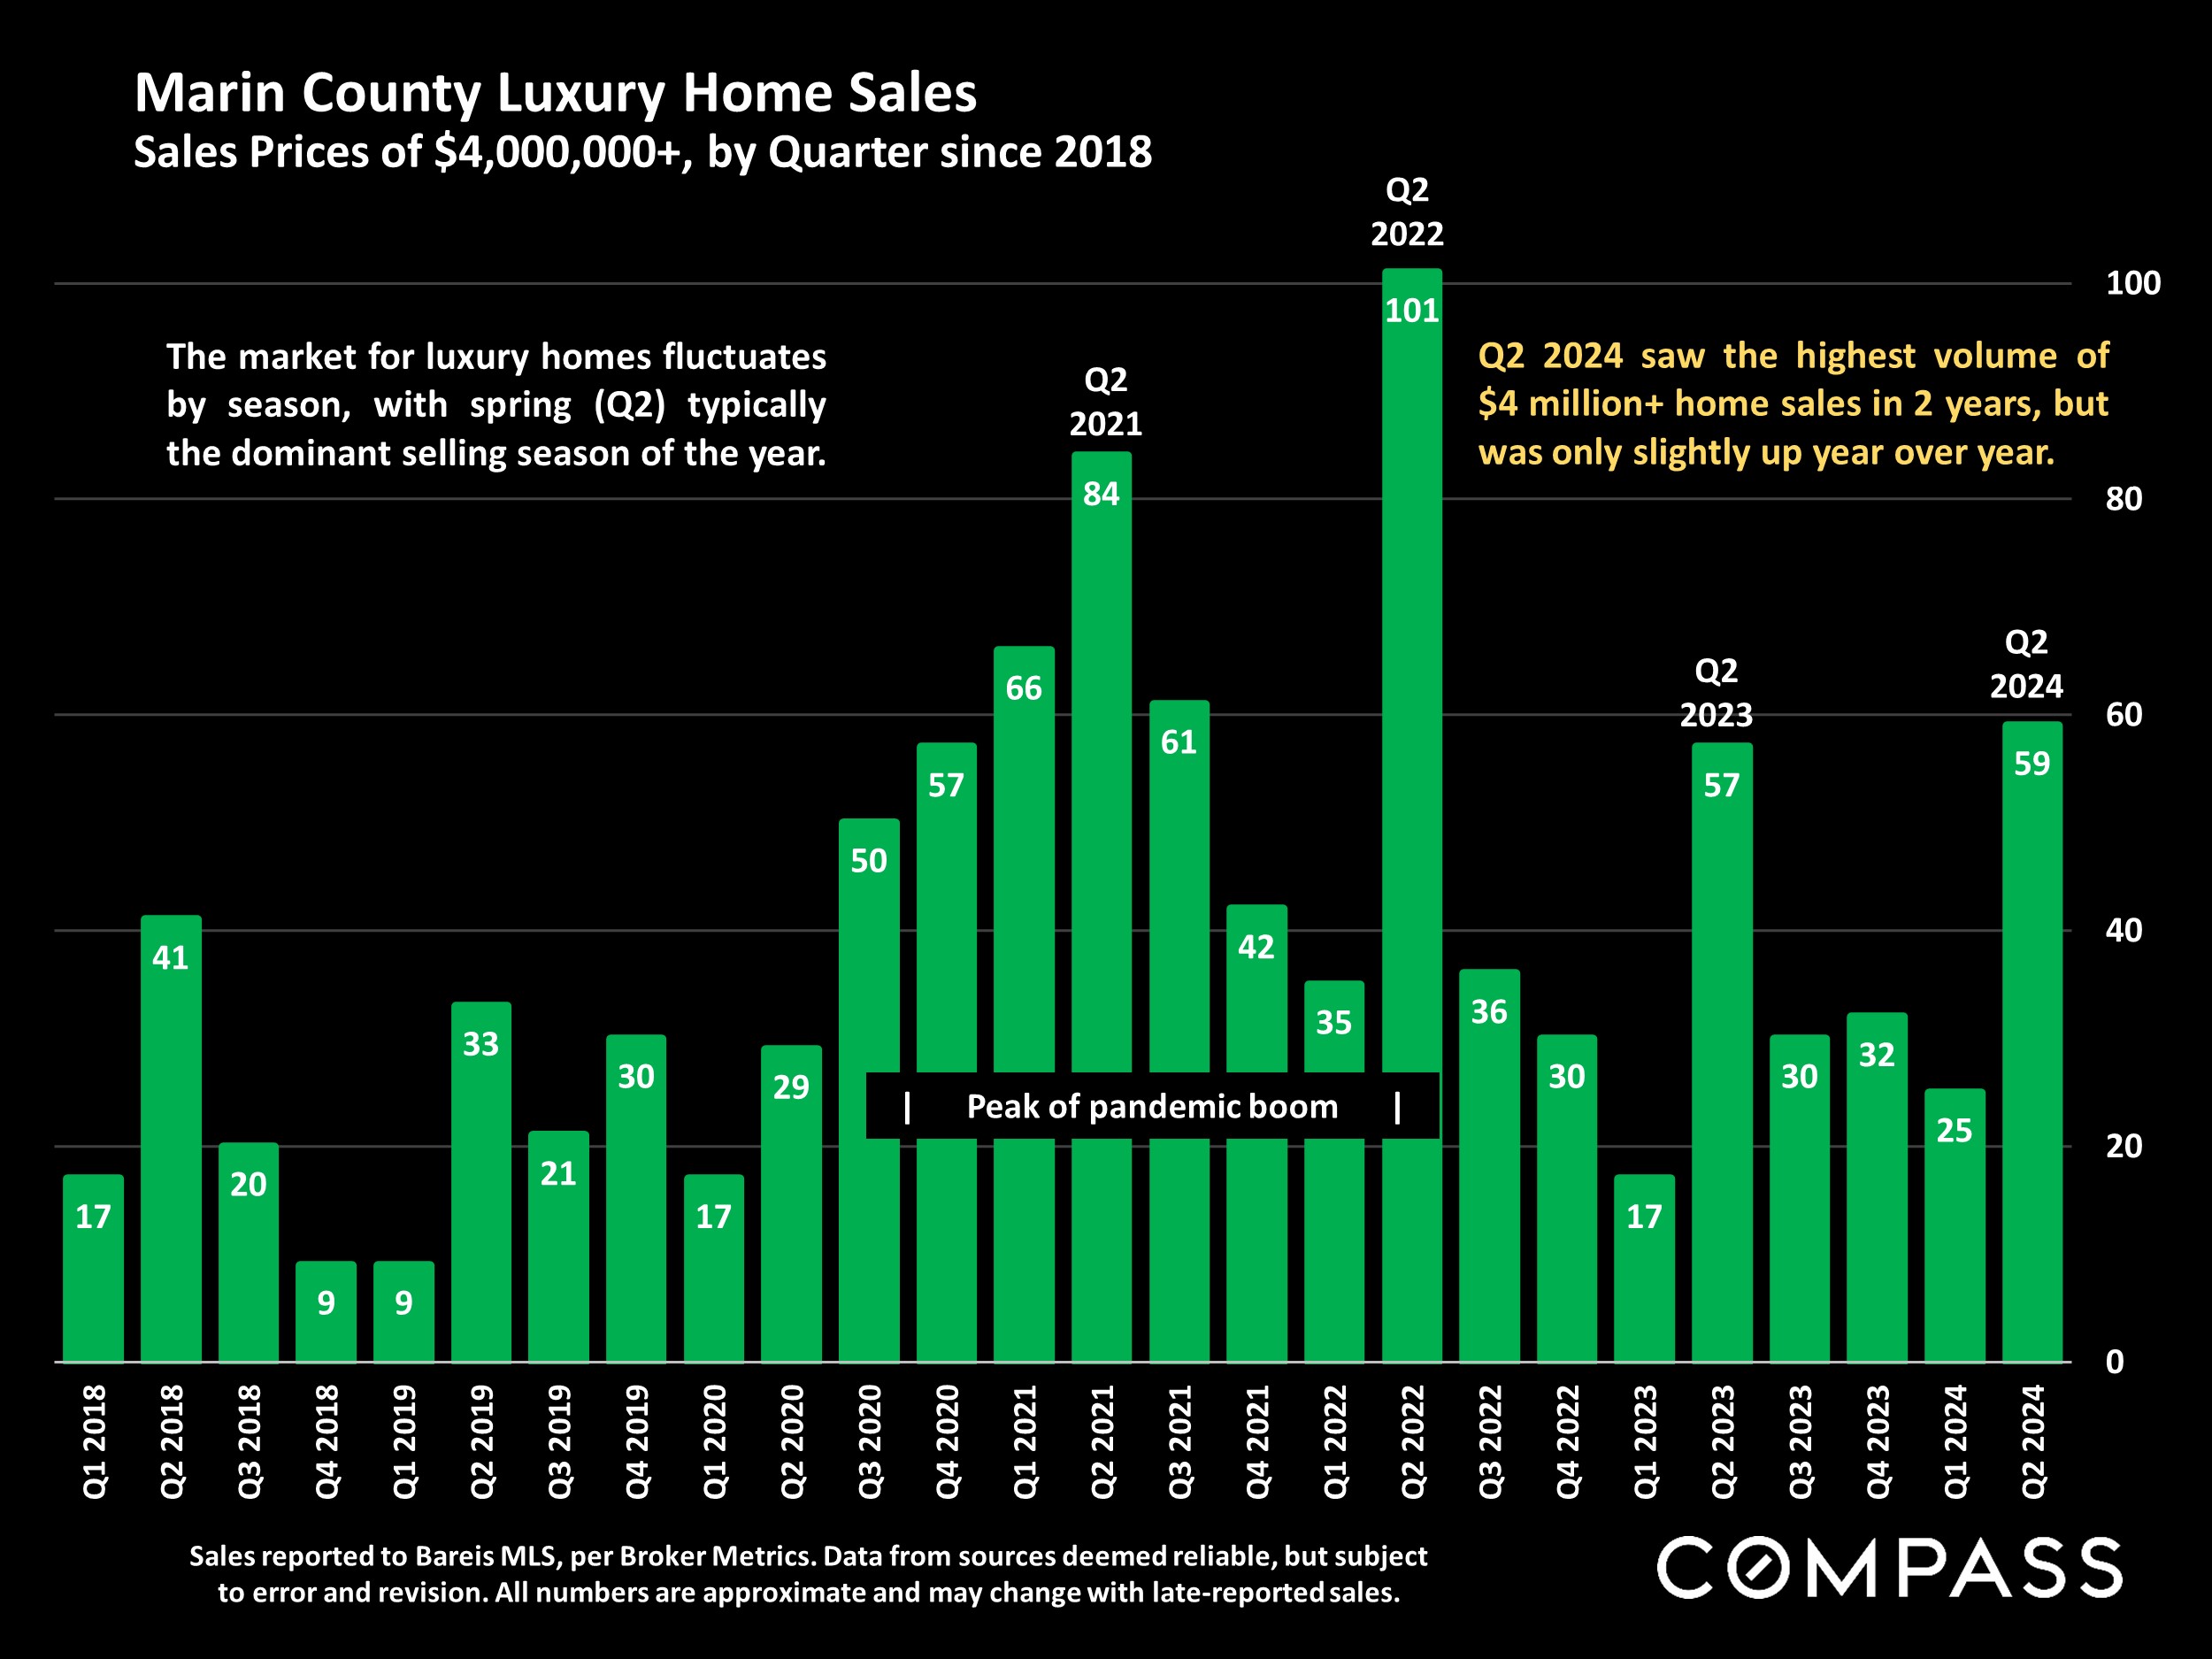
- Q2 home sales declined about ½ of 1% year over year, while homes selling for $4 million+ rose 3.5%: Generally speaking, very affluent households have been playing a larger role in the housing market since late 2023 (when financial markets began their rebound).
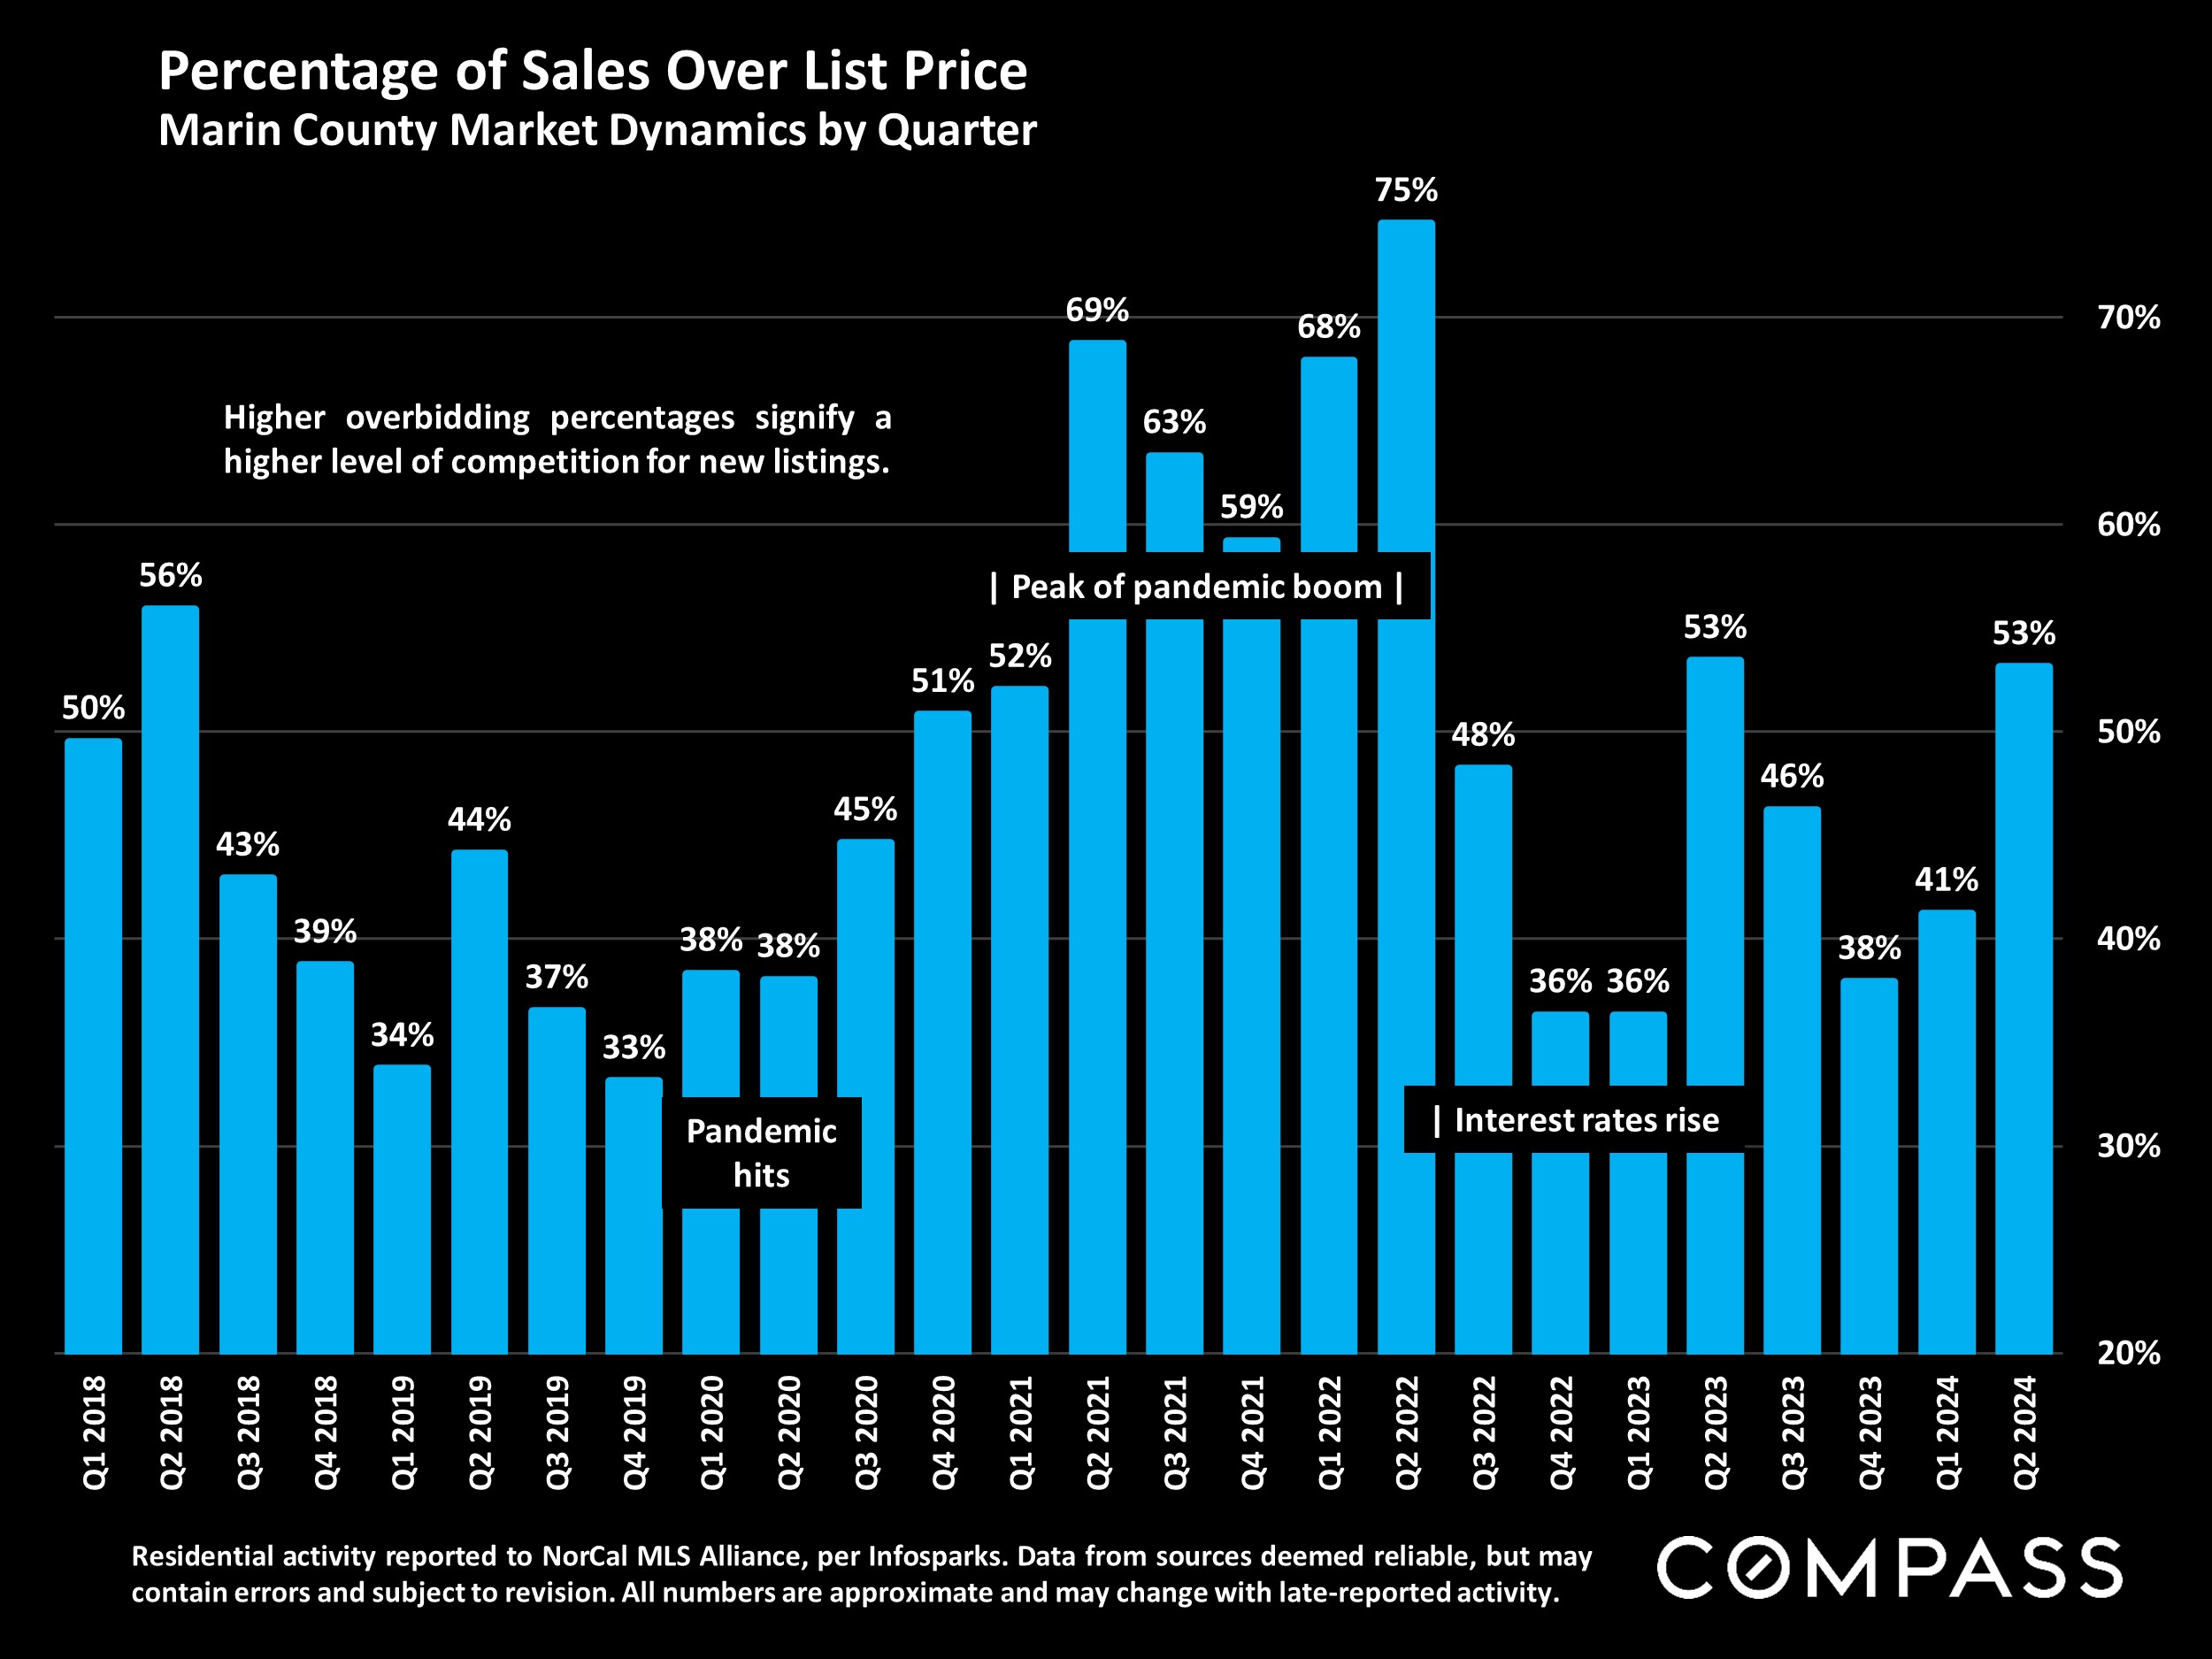
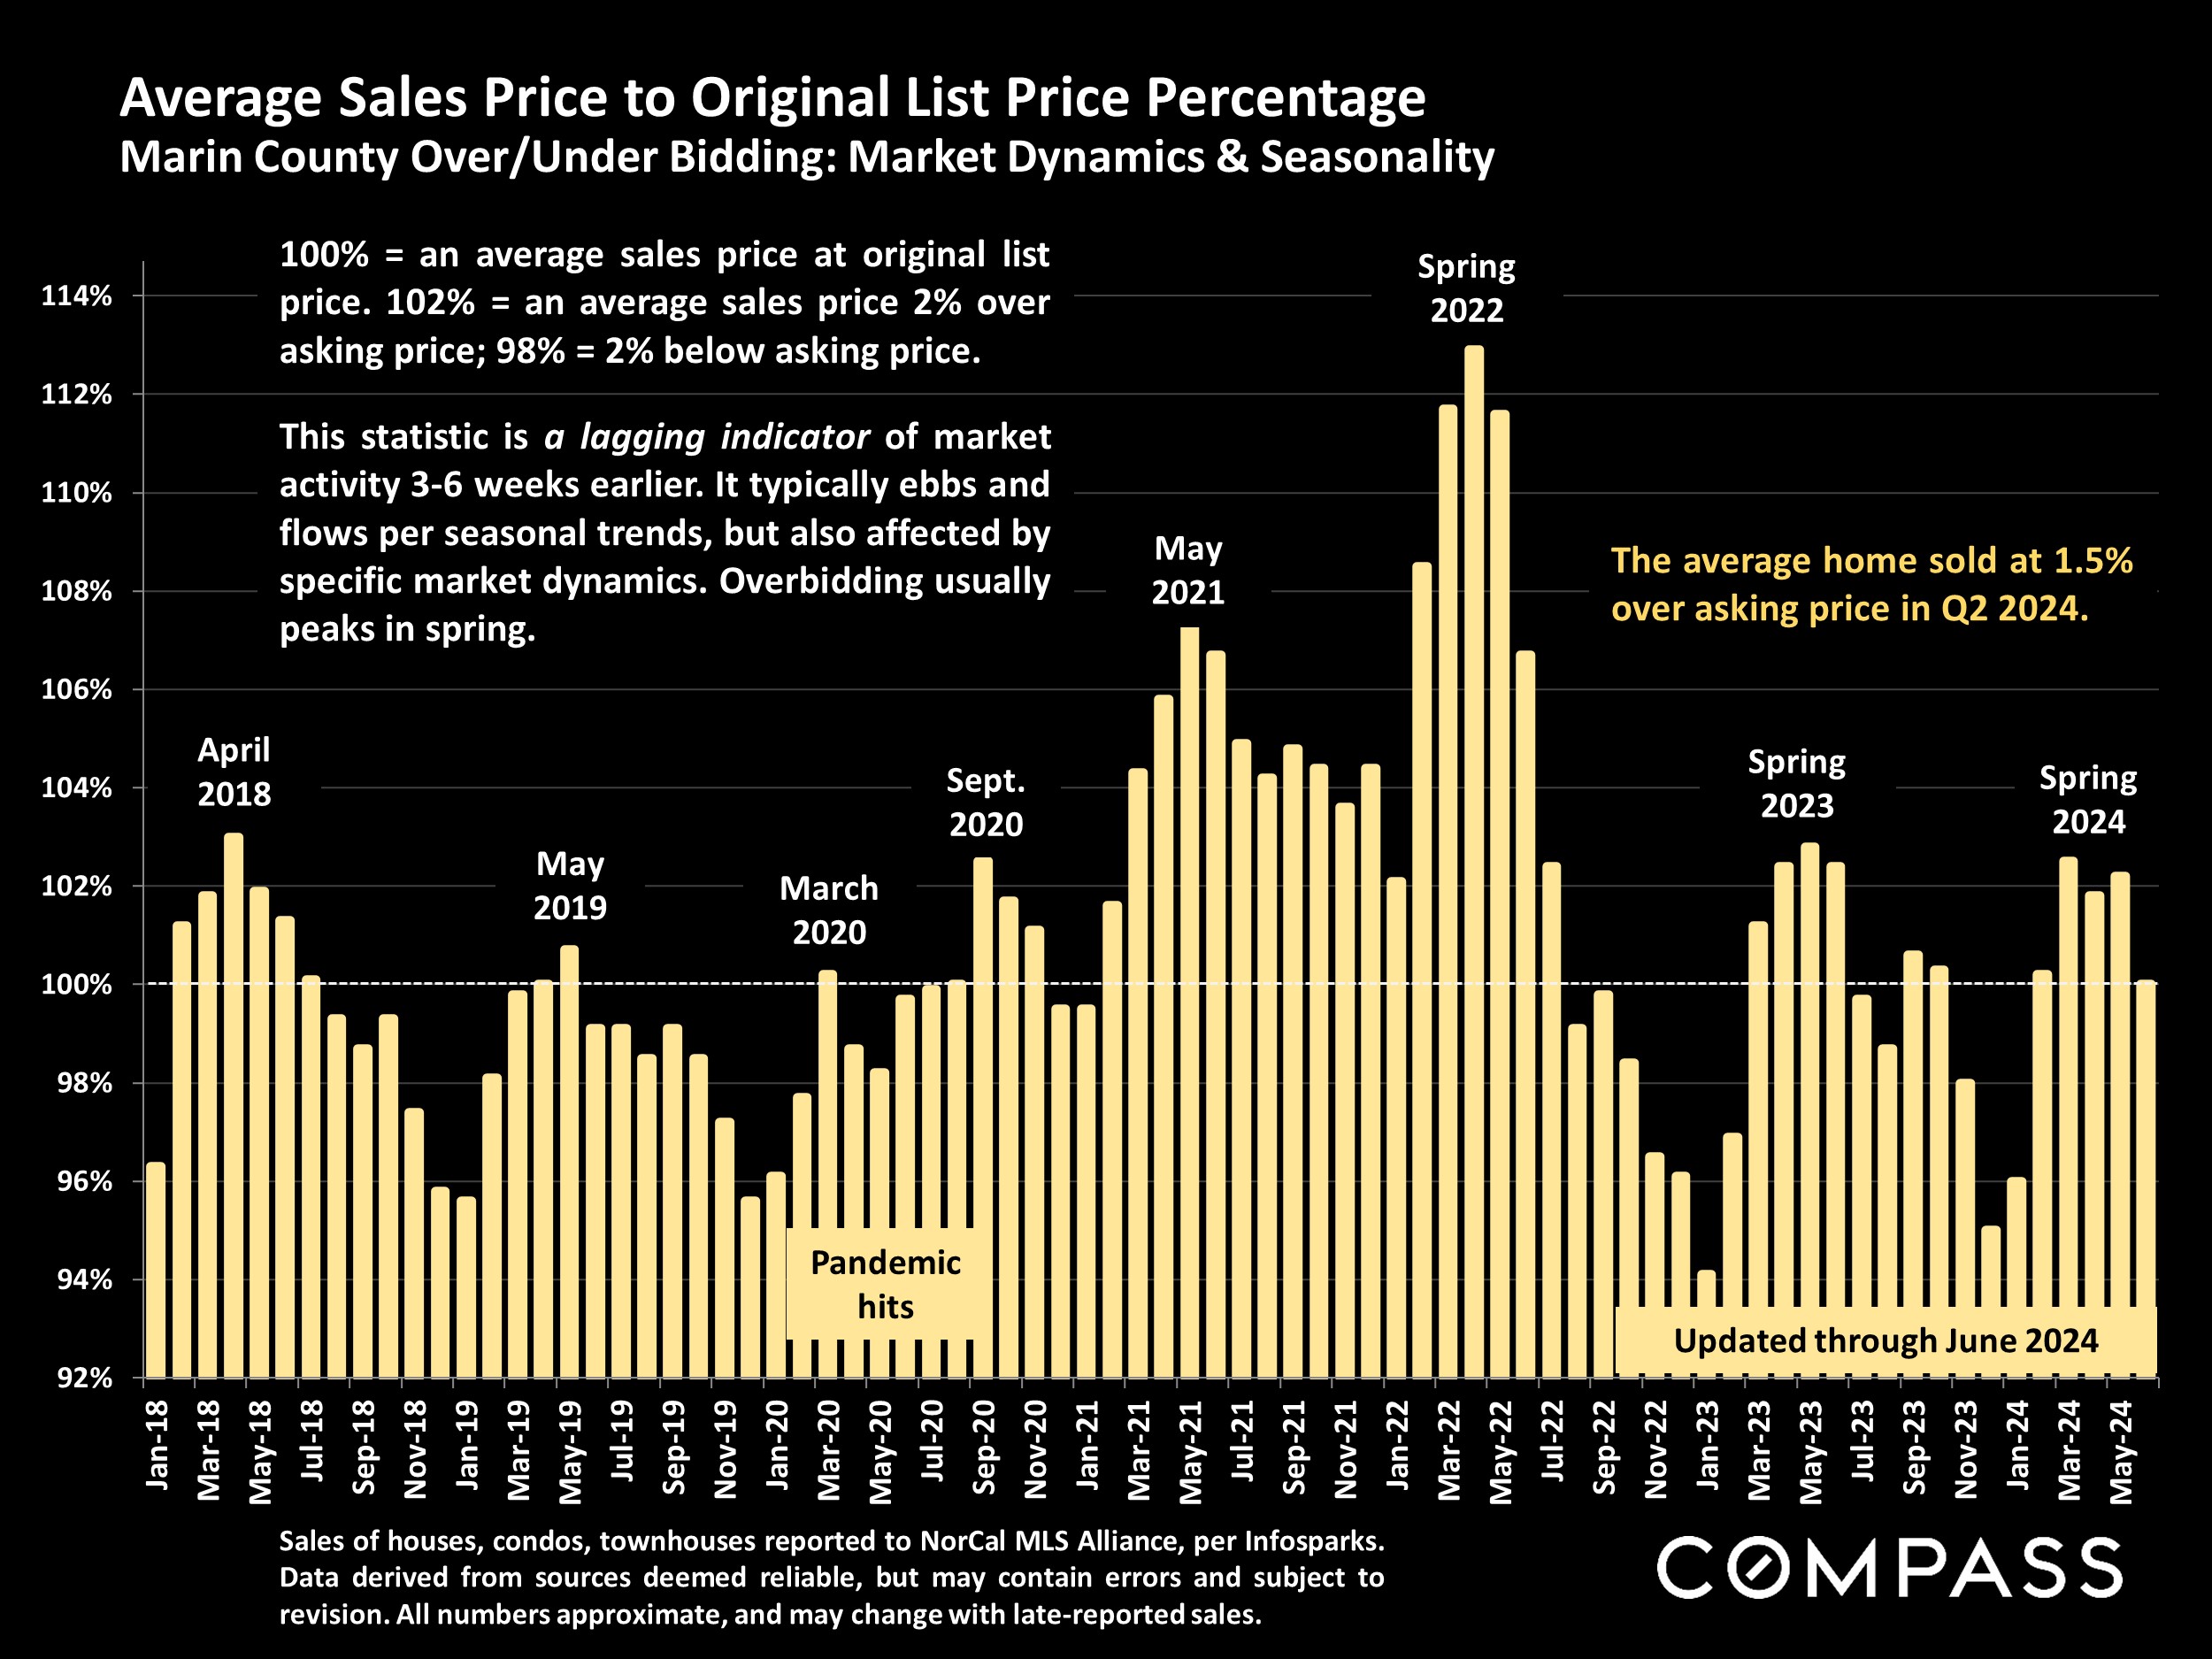
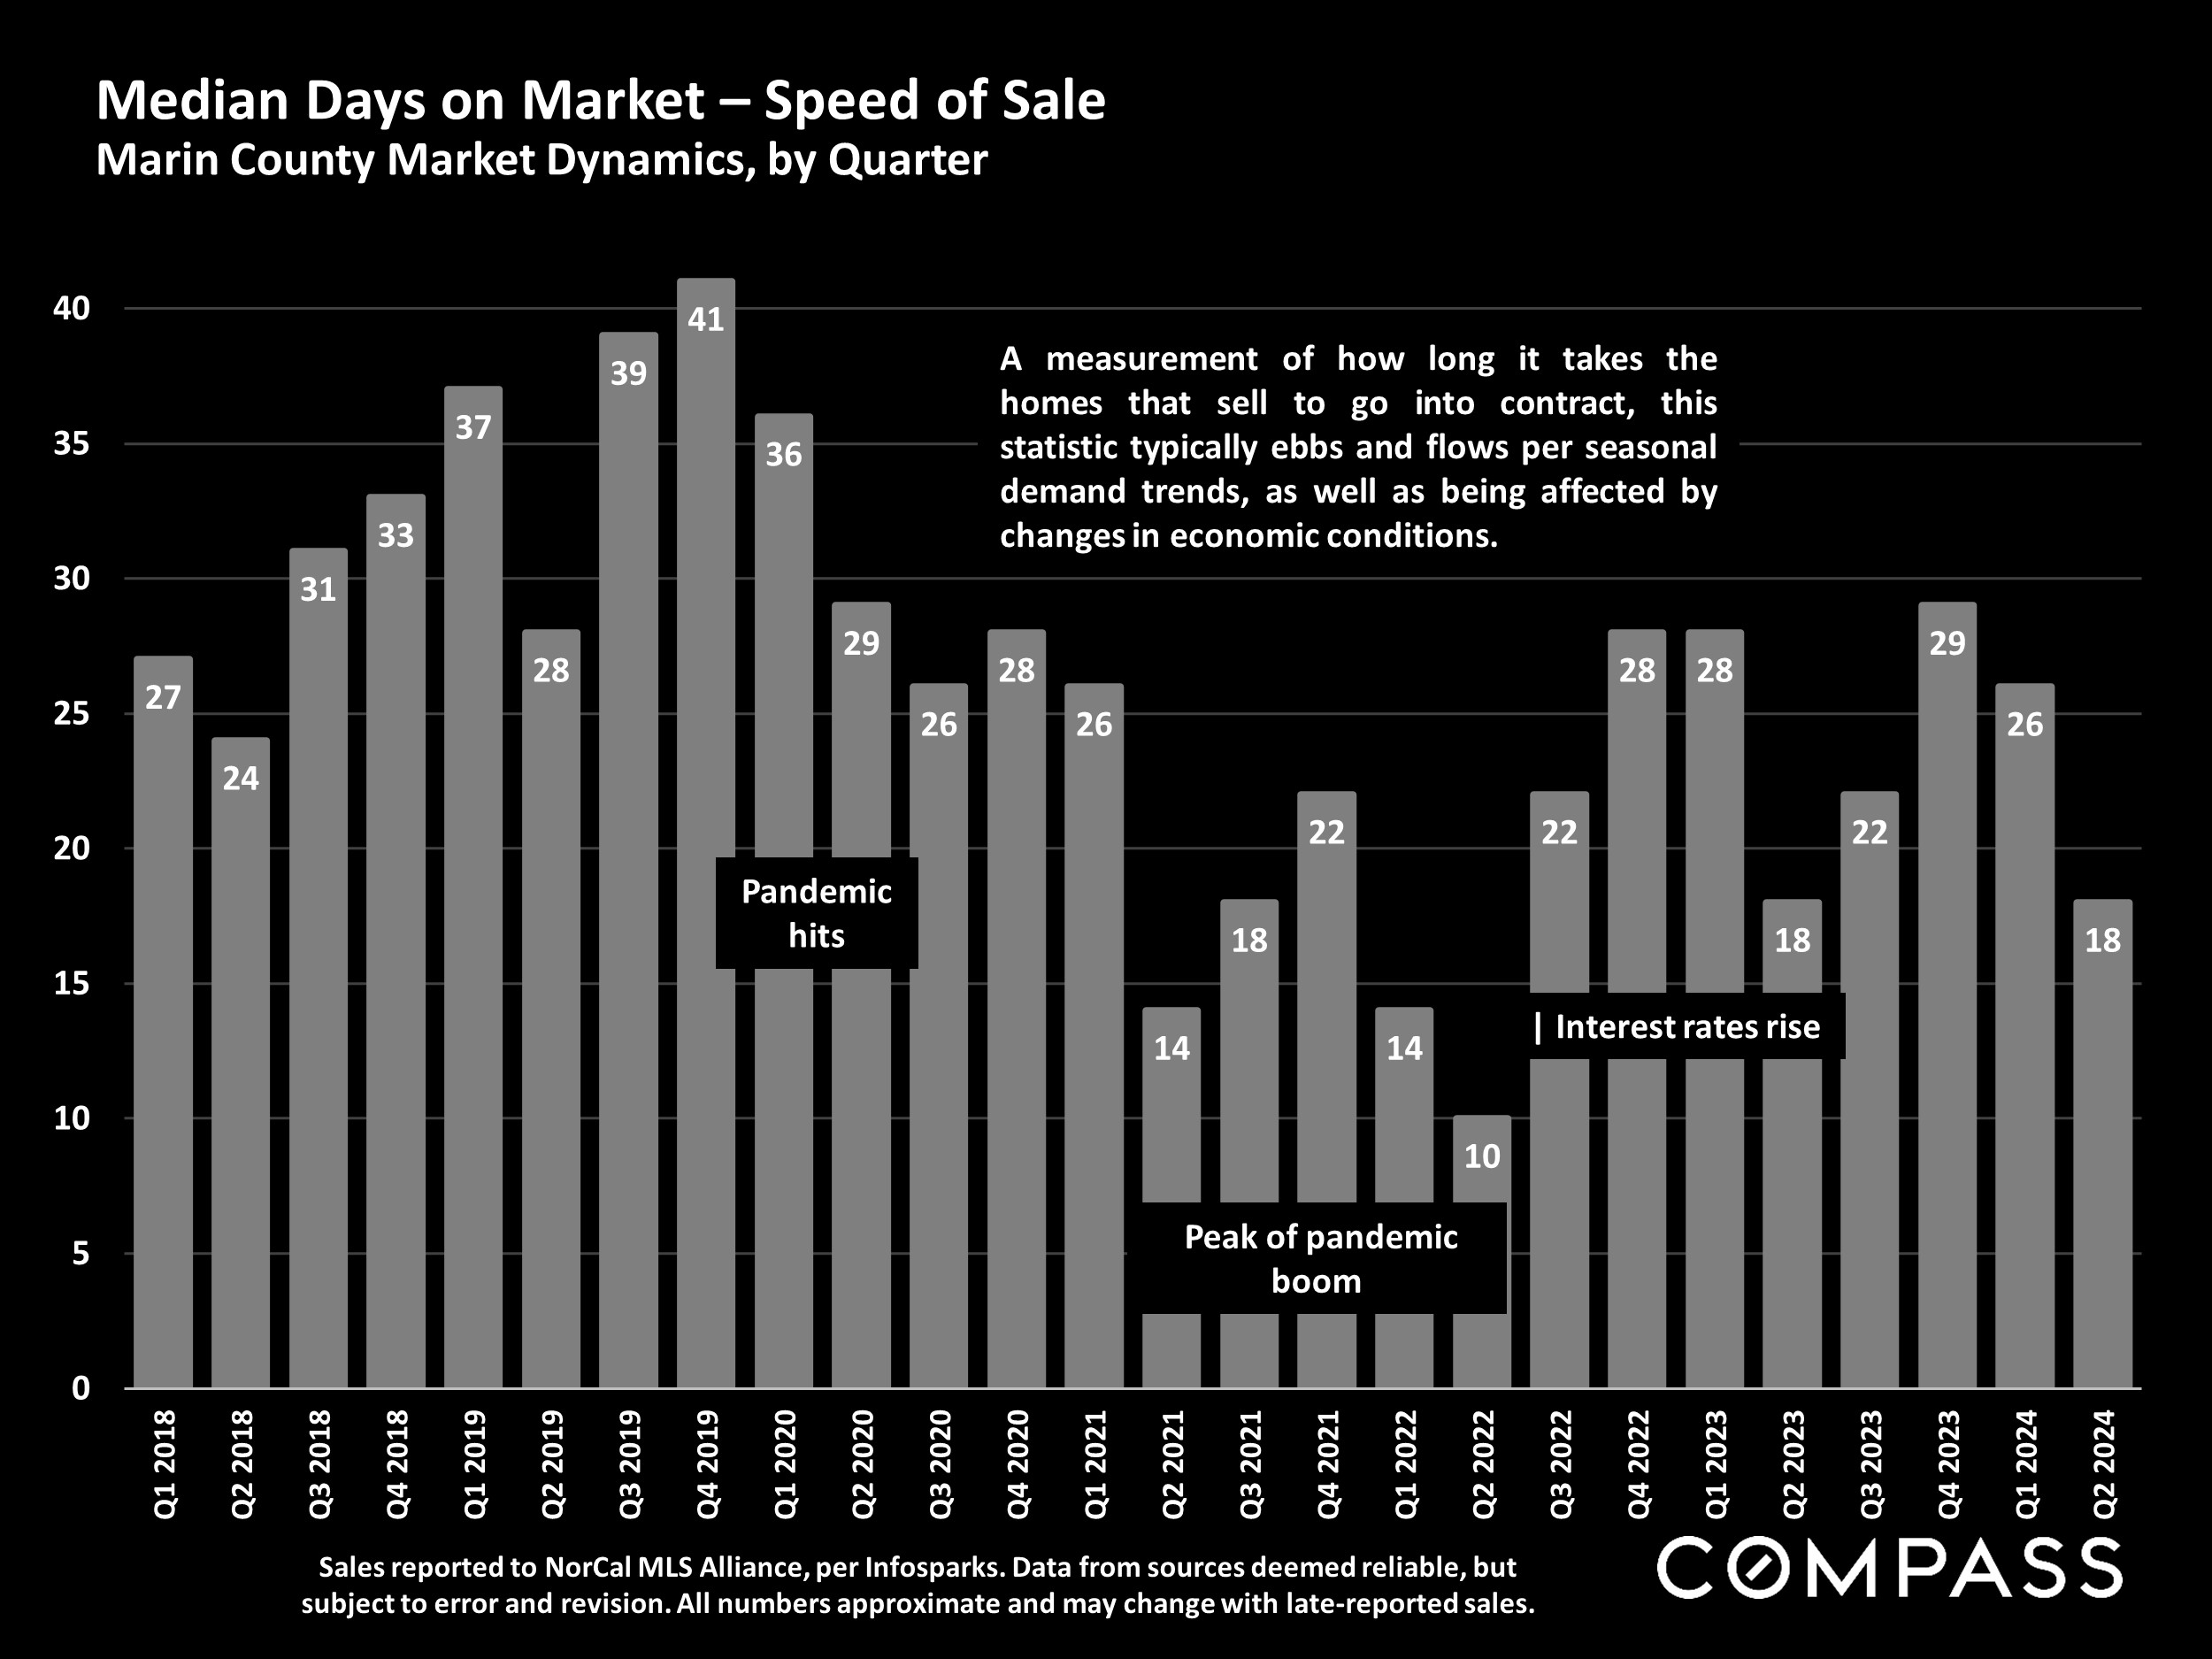
- The average home sale closed for 1.5% over list price in Q2 2024, while median days on the market dropped to it's lowest reading since spring 2023.
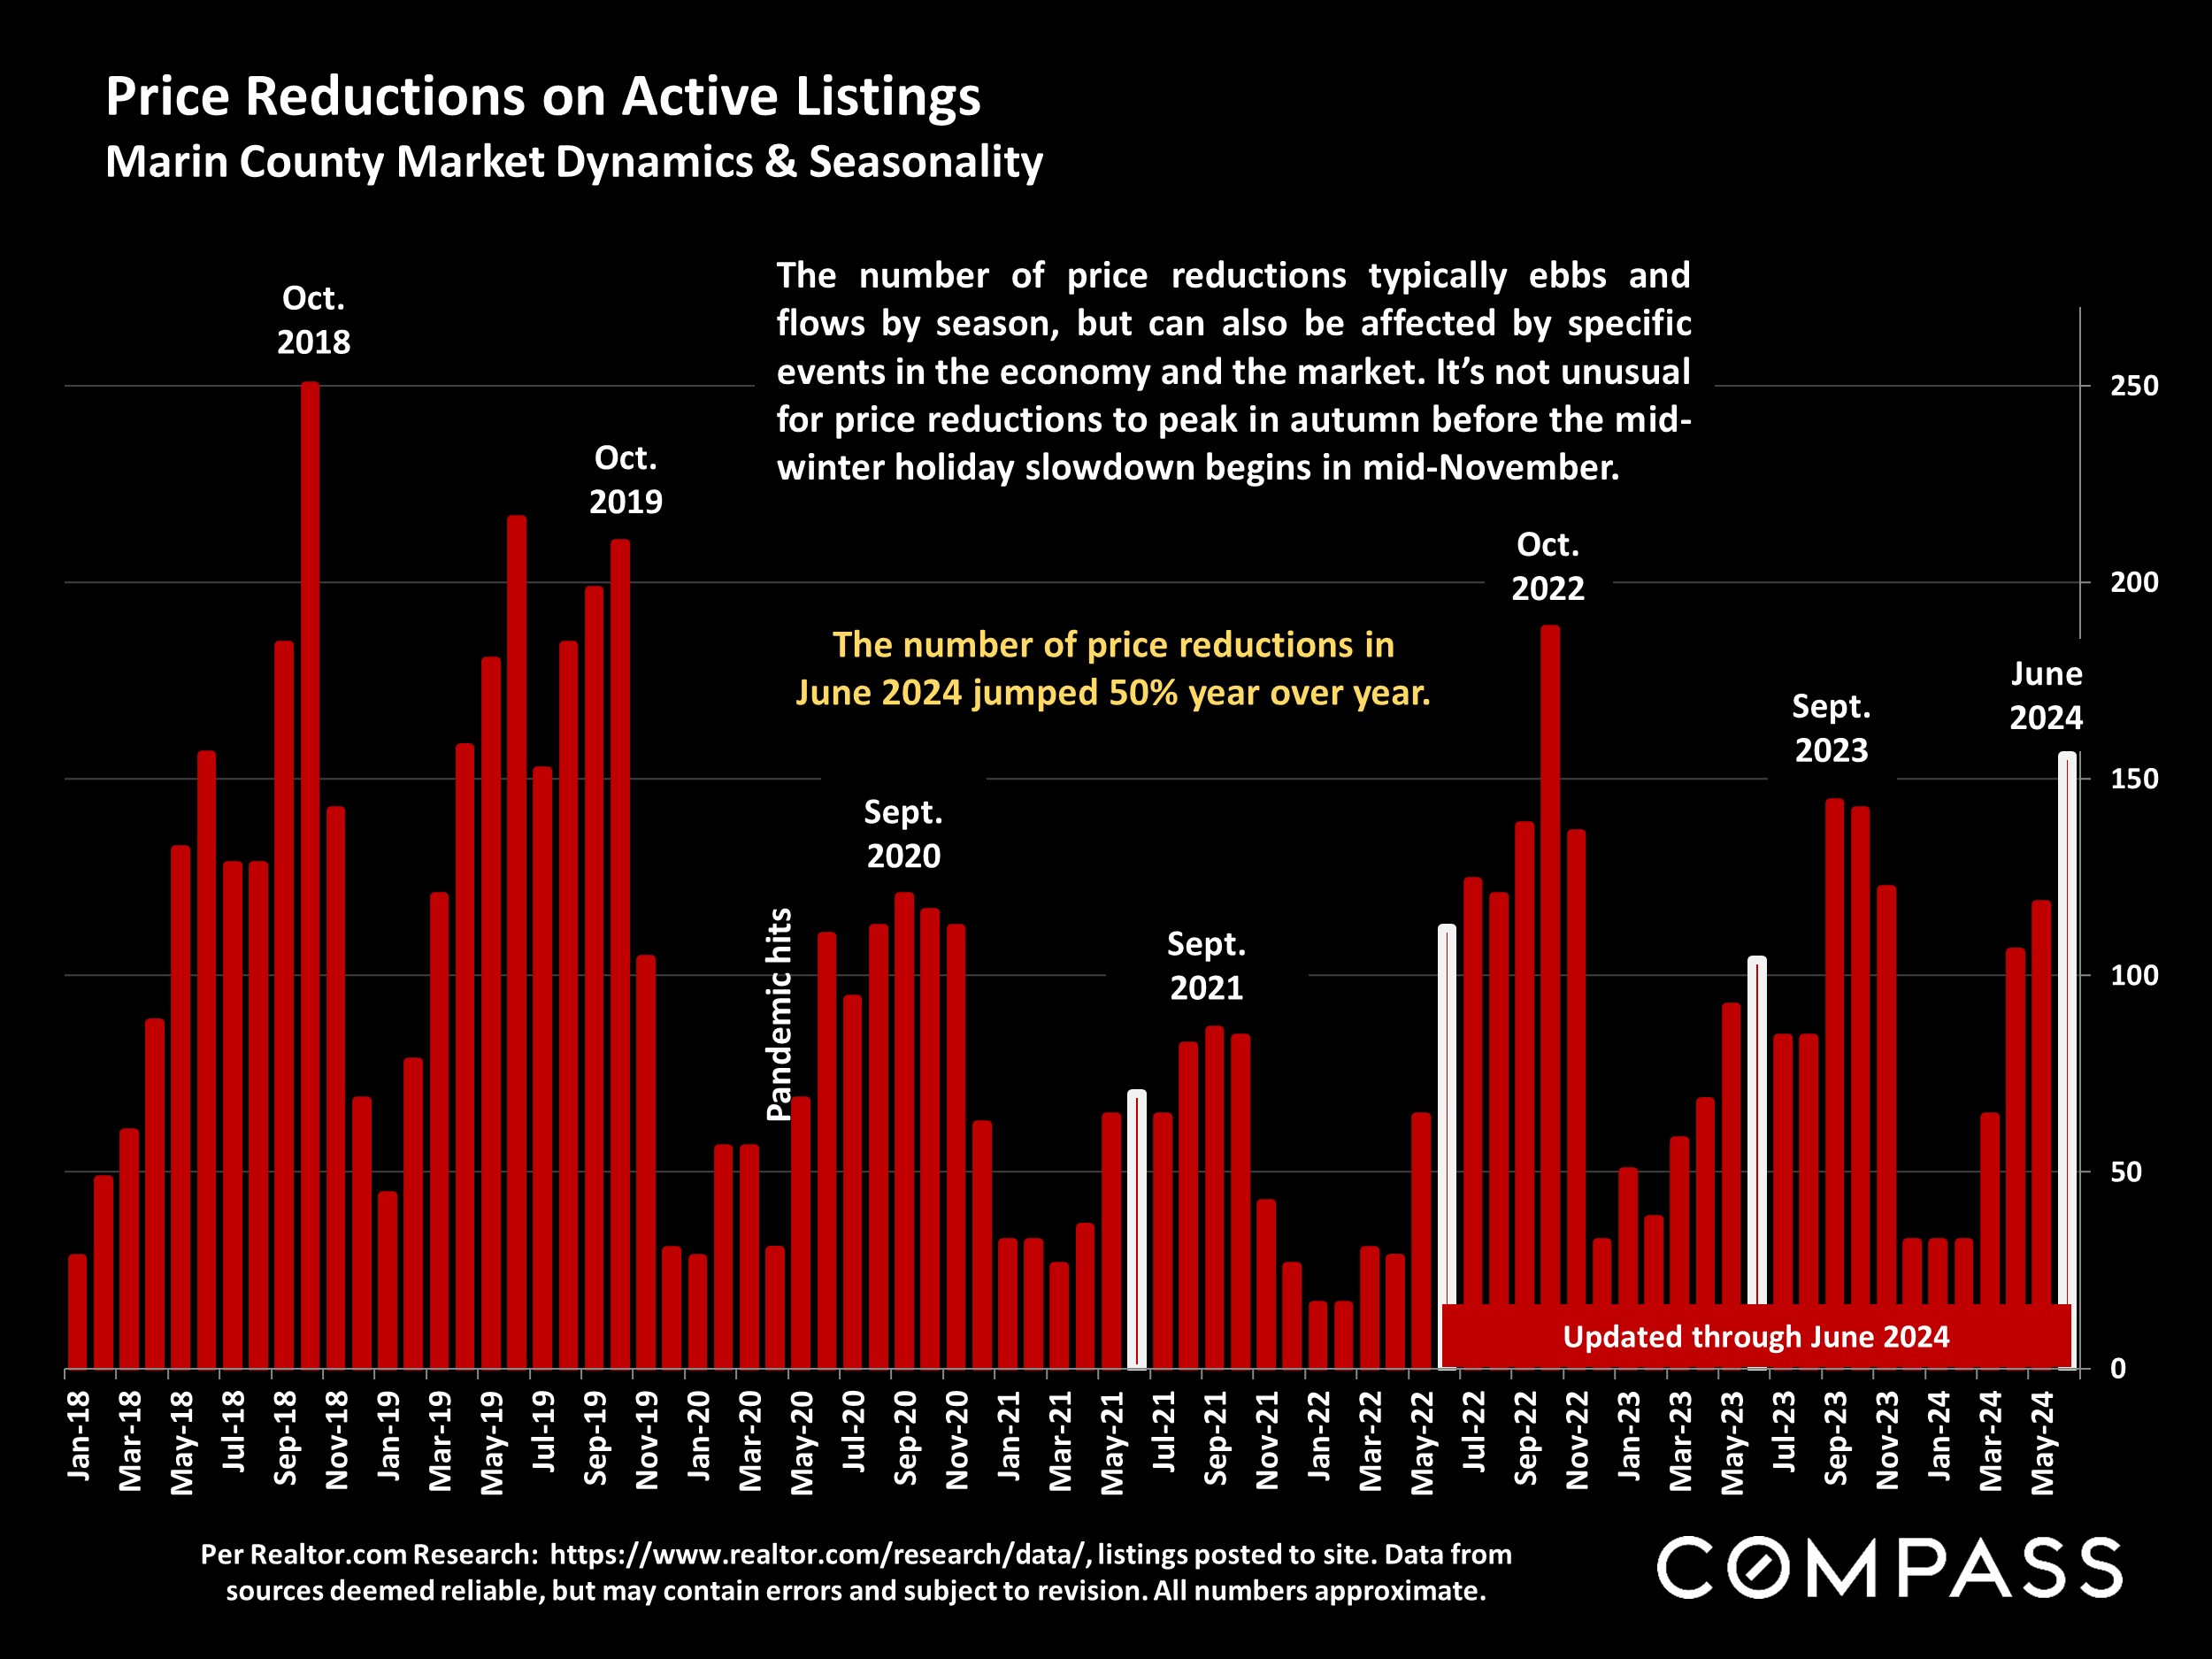
- The number of price reductions in June 2024 leapt 50% year over year, an indication of some sellers having to readjust expectations regarding what buyers are willing to pay.
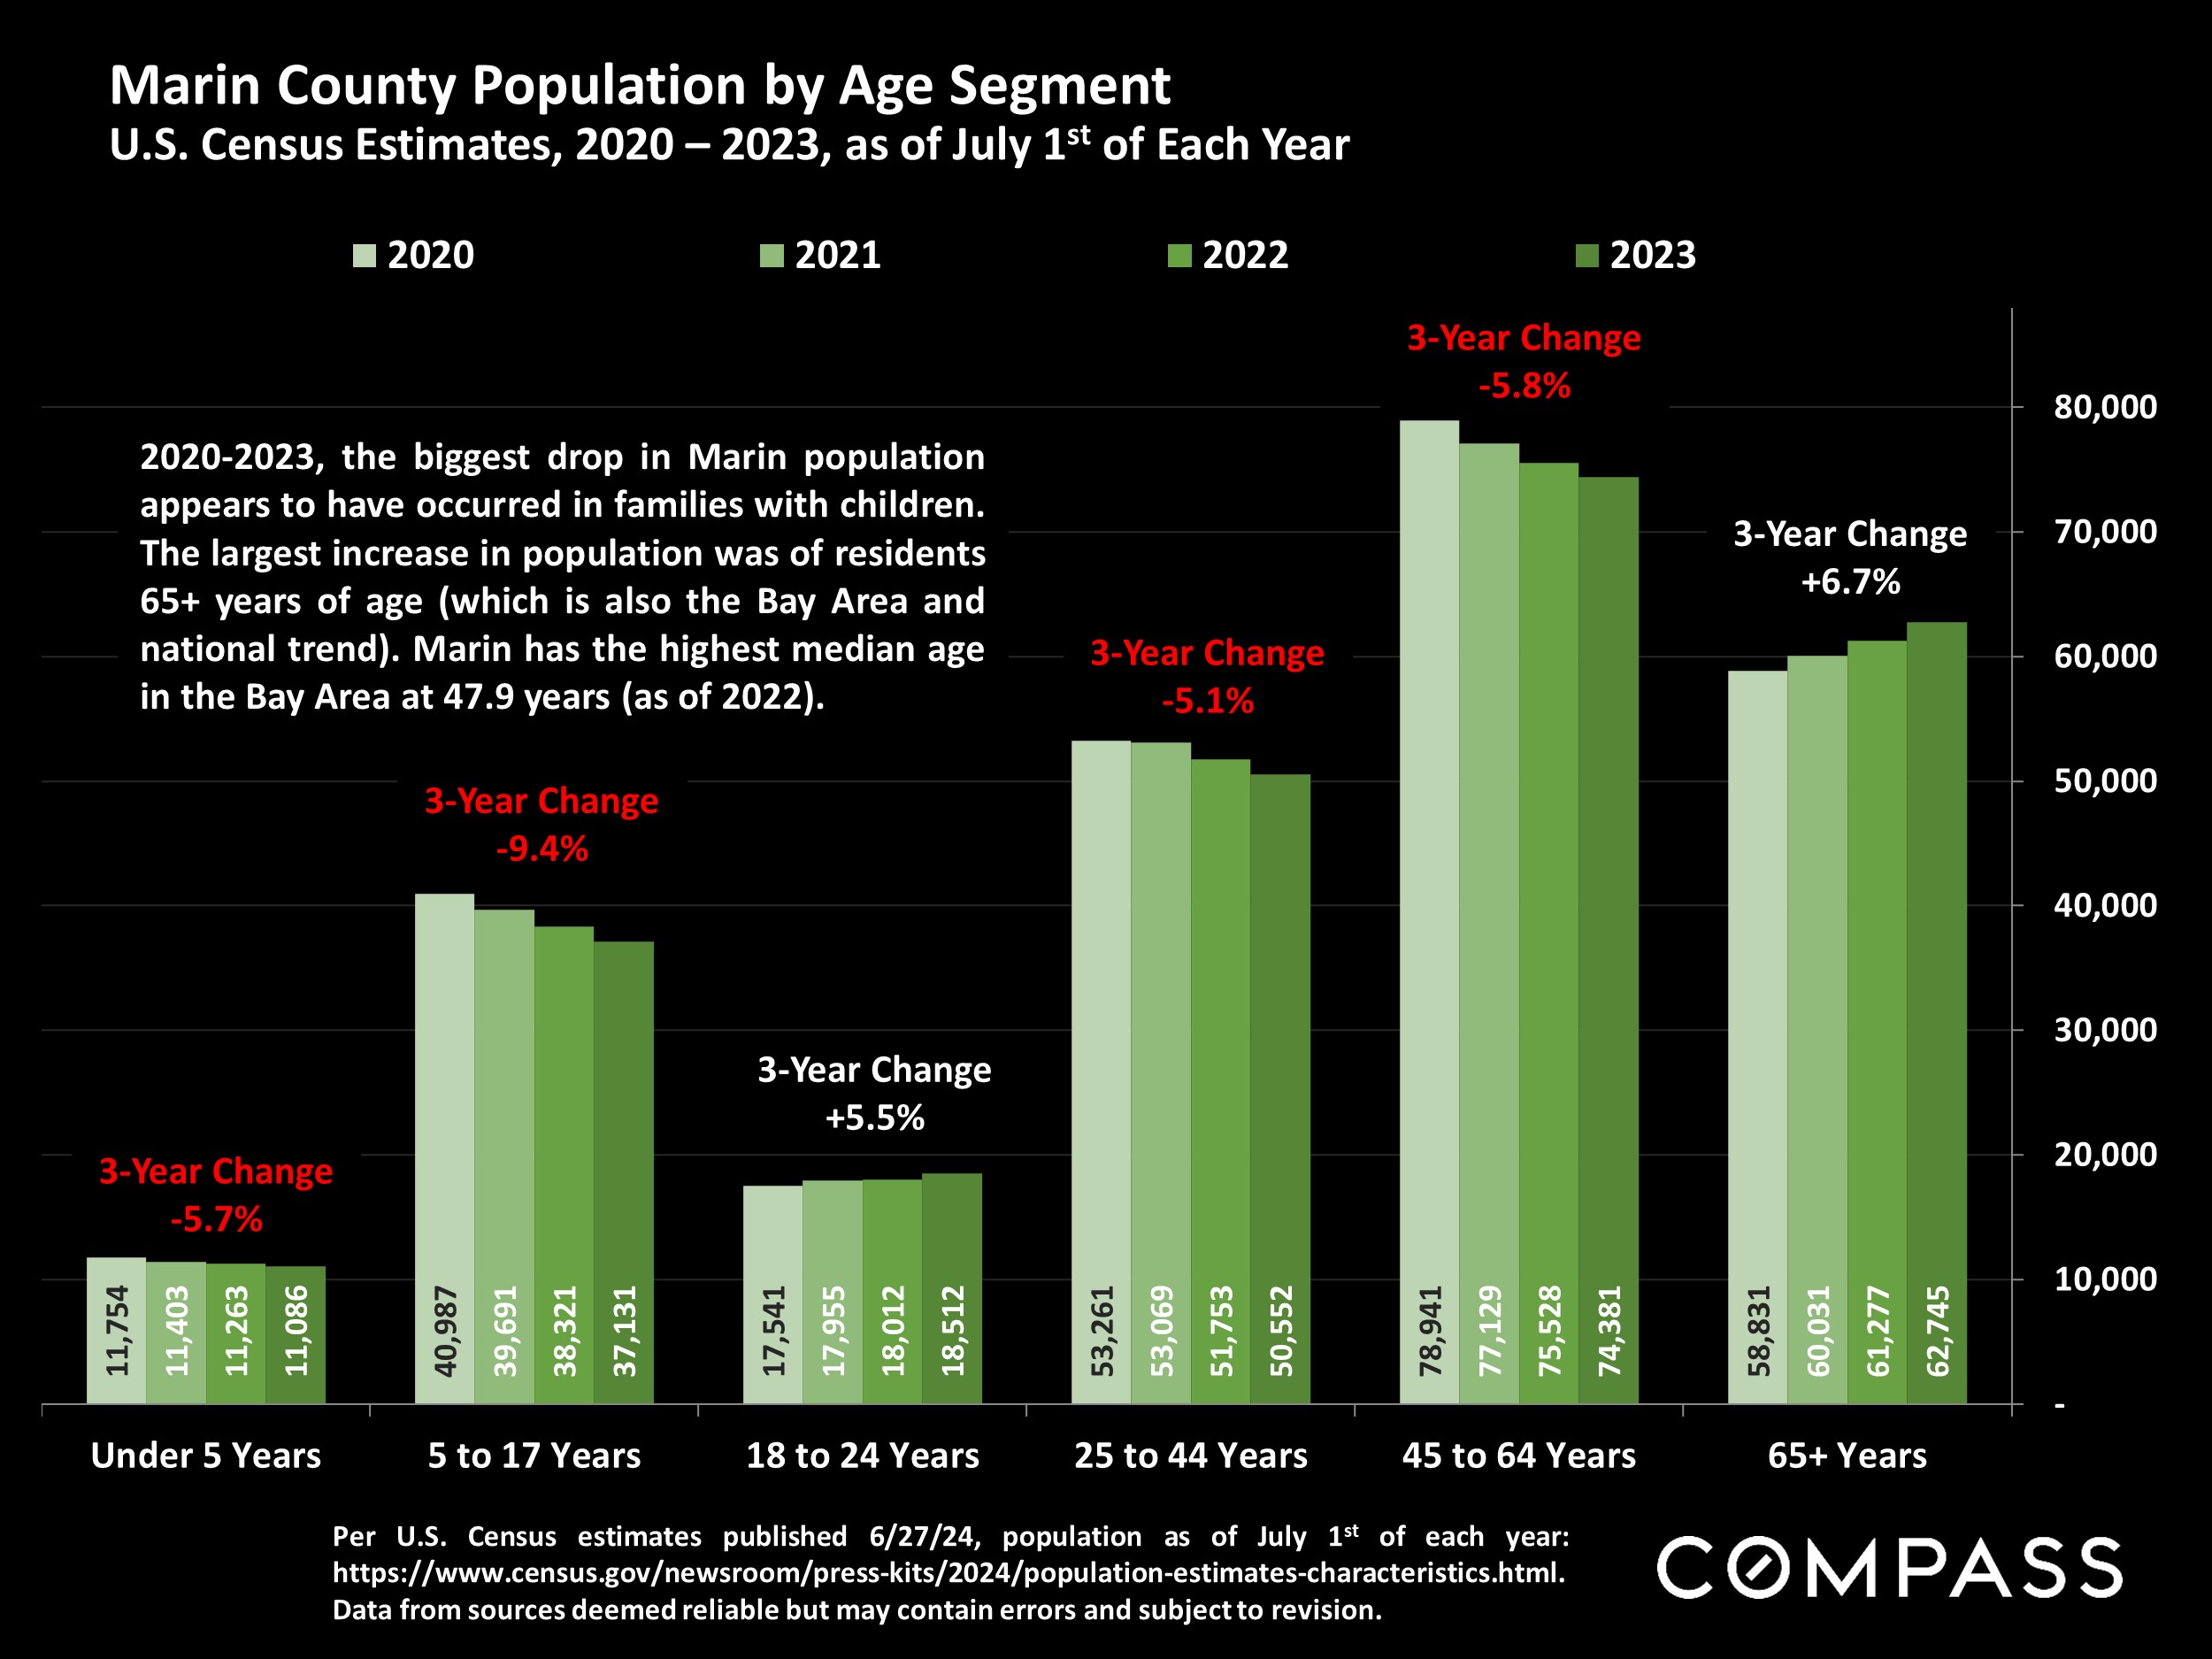
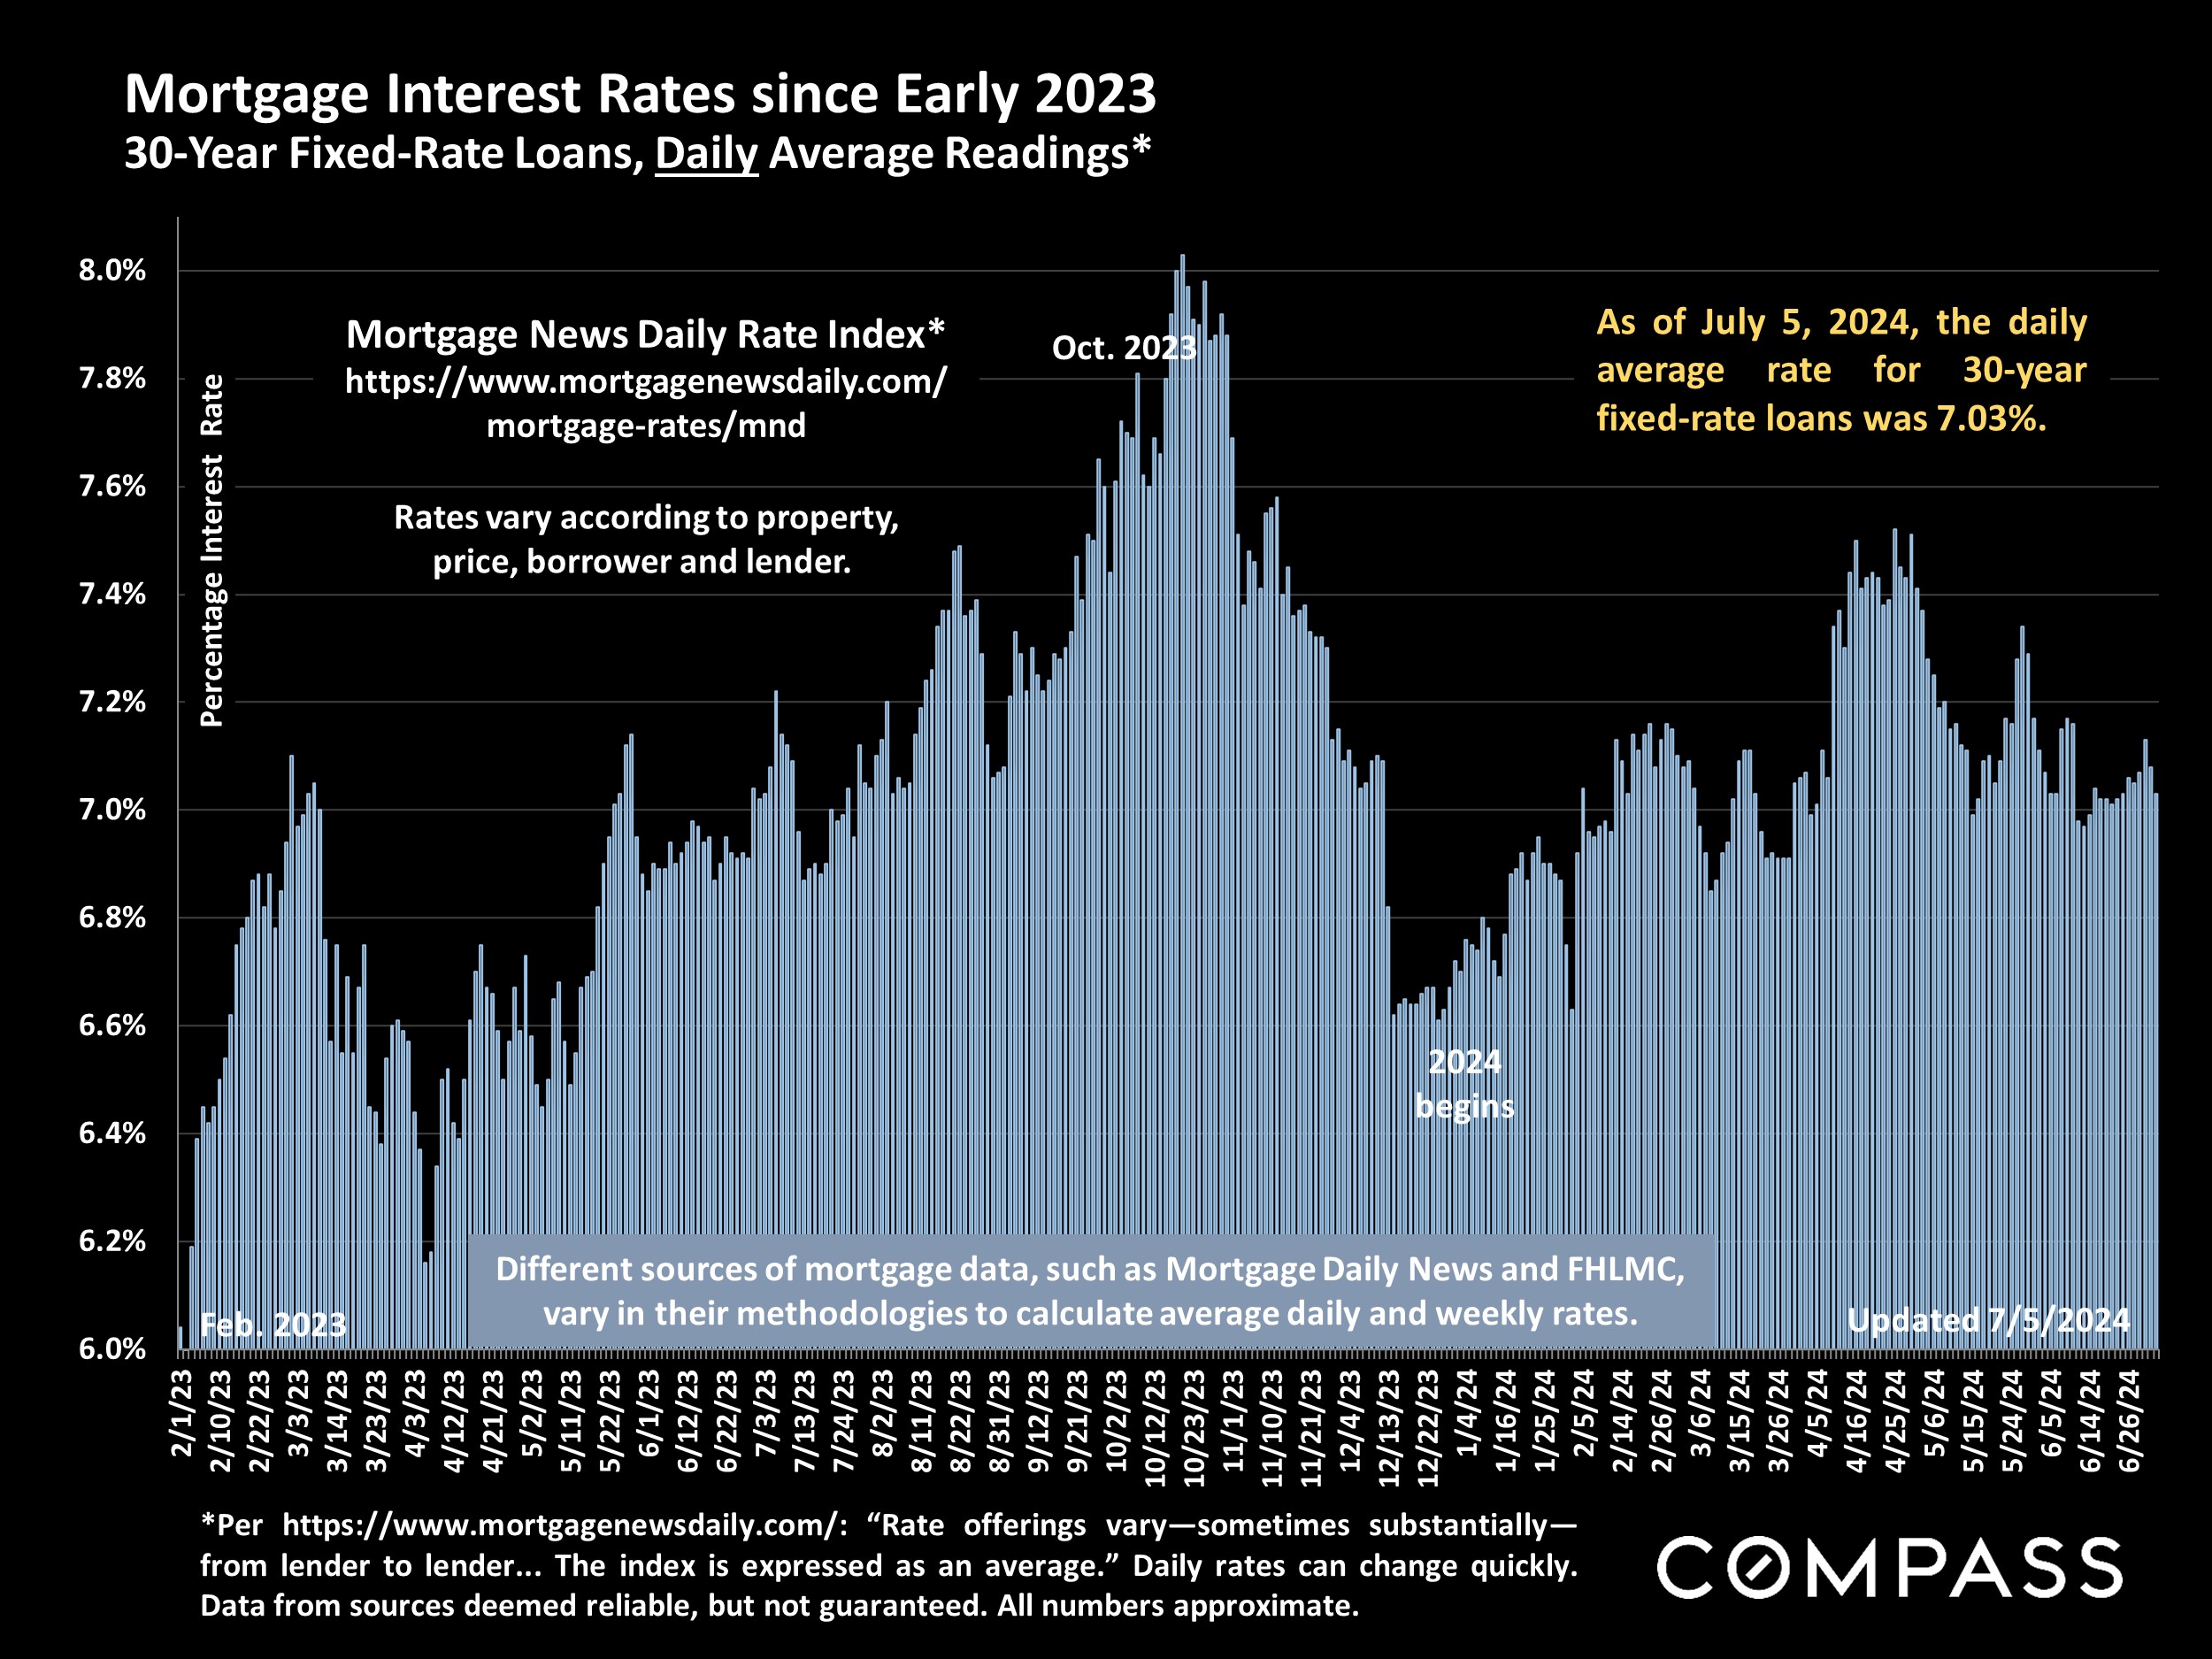
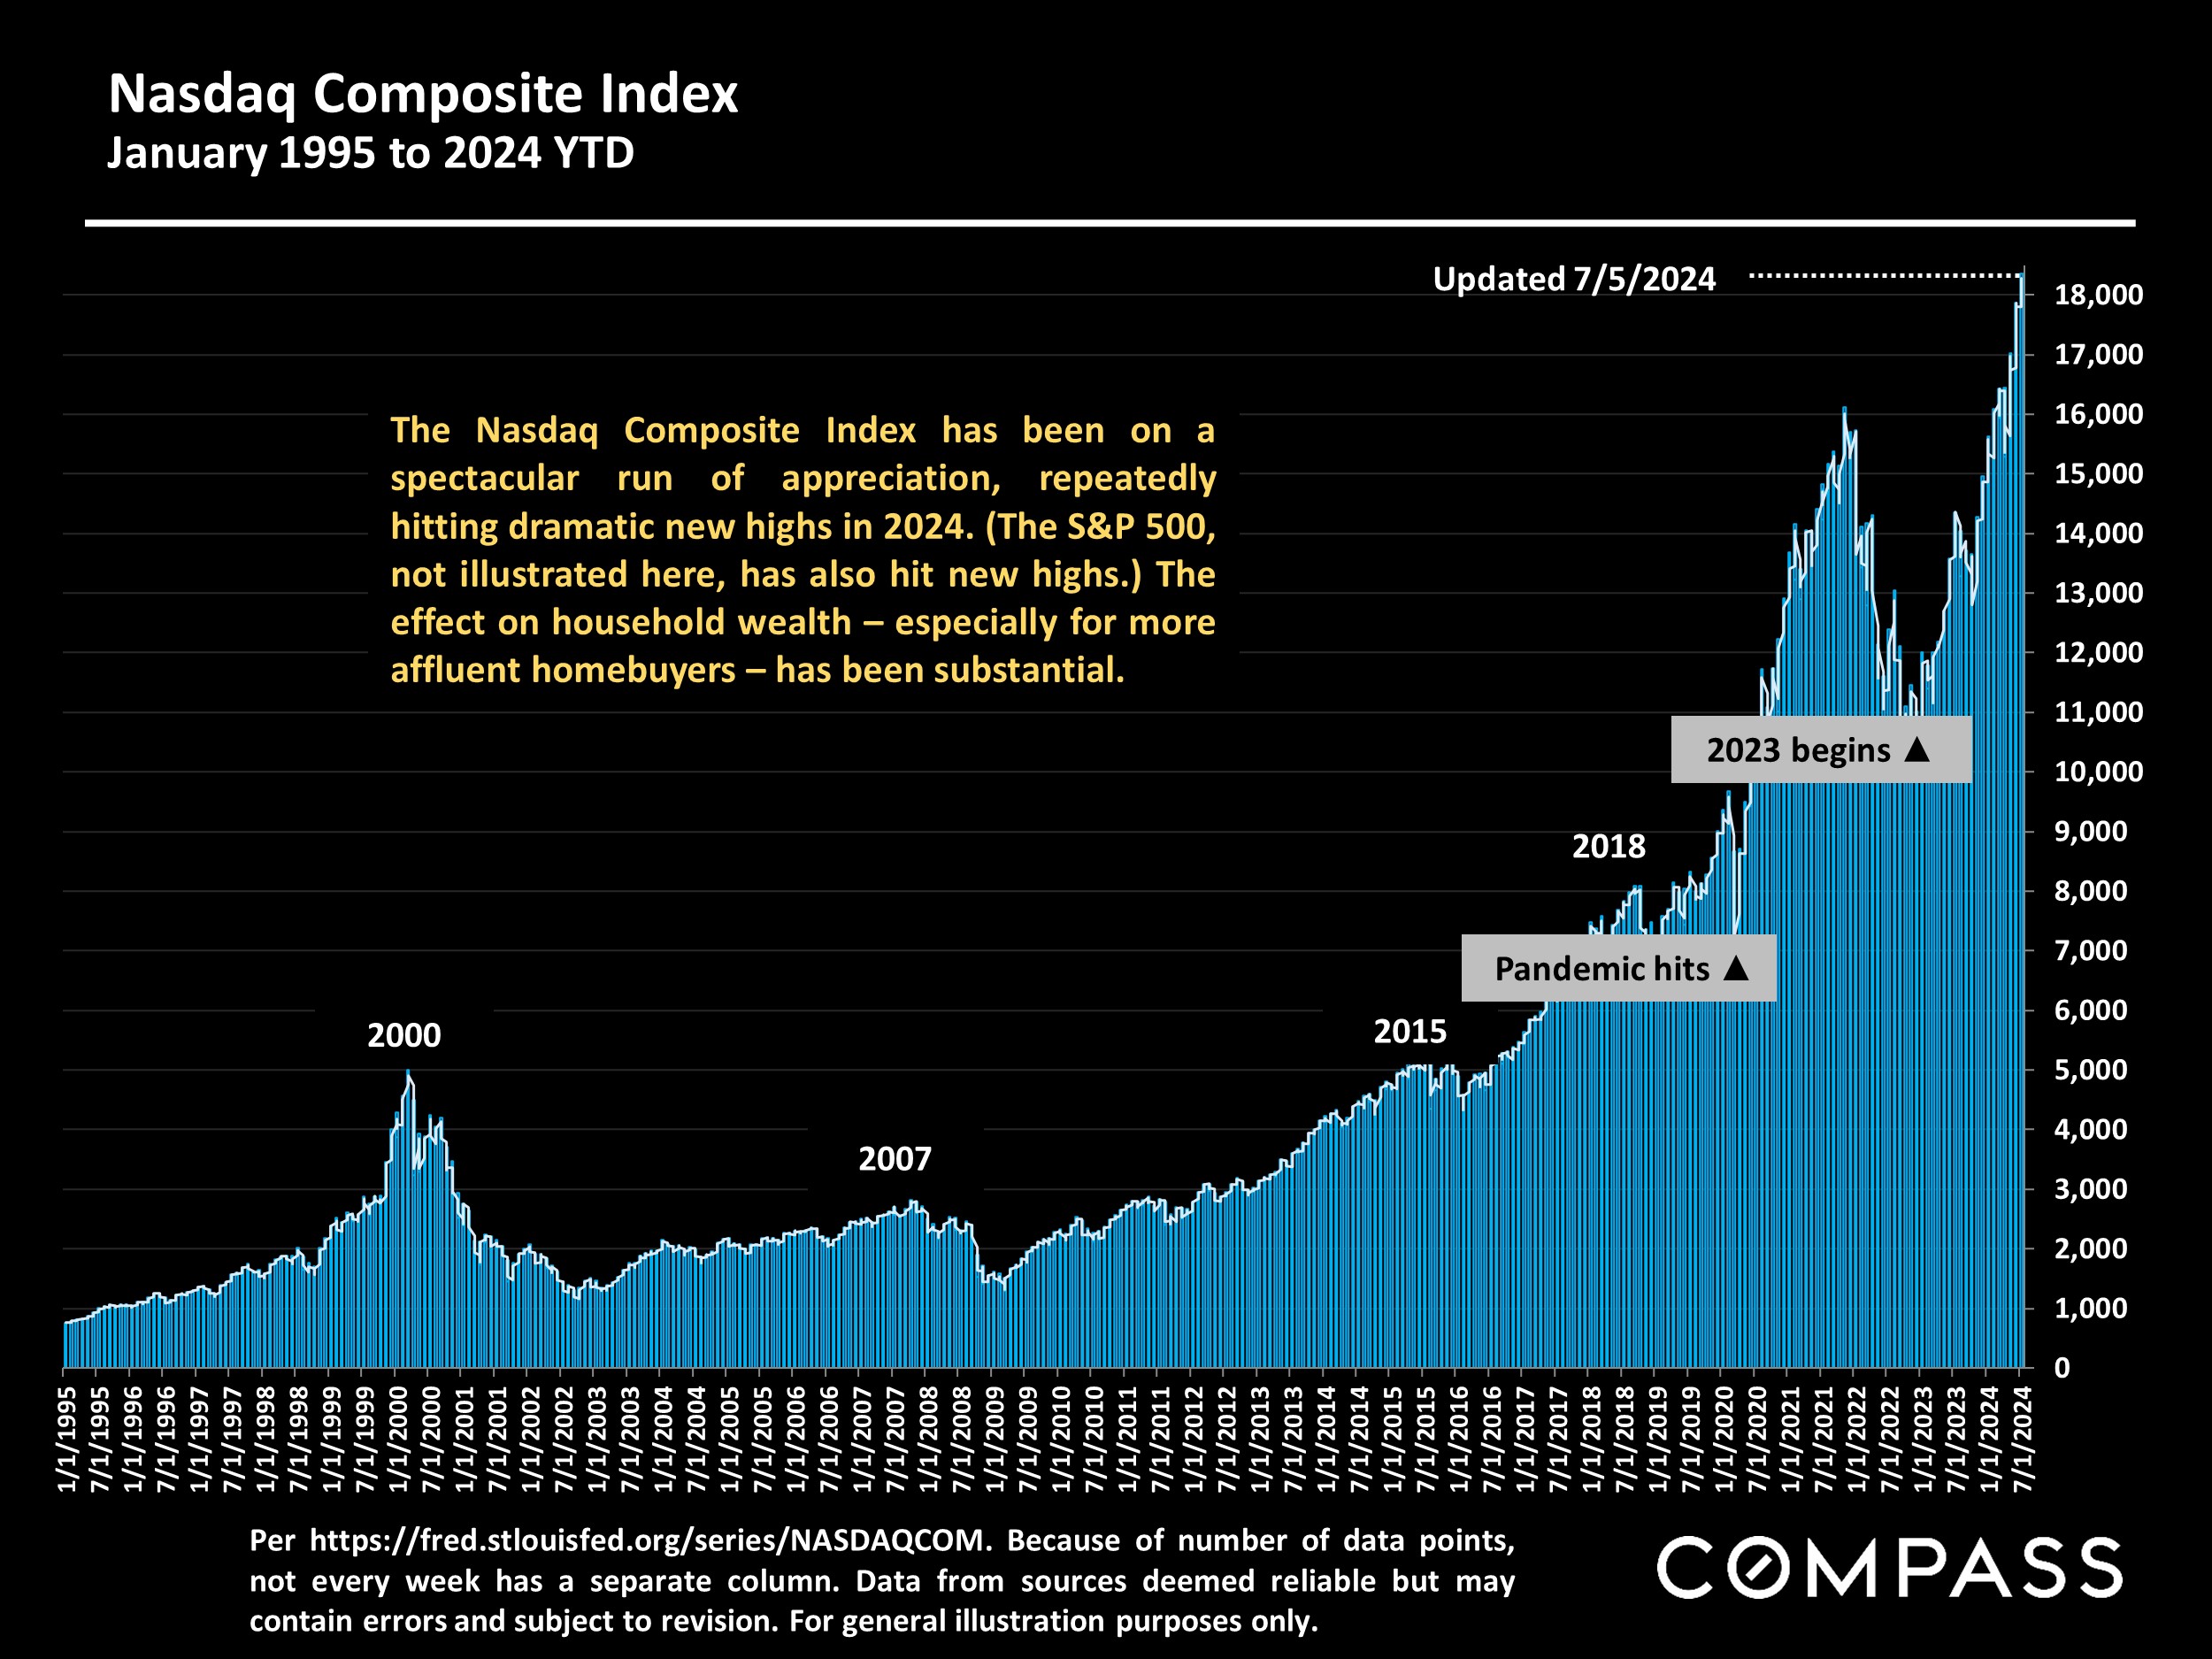
As of early July, mortgage rates continue to hover around 7%, though hopes remain for at least one reduction in the Fed's benchmark rate in 2024. Stock markets have sustained their extraordinary rise. The homeowner's insurance situation remains challenging, with policies often difficult to locate and increasingly expensive. The latest Census estimates revealed the Bay Area is growing older, with fewer children and a rising number of residents aged 65+.
Want to learn more about Bay Area market trends?
Let’s connect! With relationships and networks across the city, there are a variety of ways I can help you make informed real estate decisions. Call, email, or text – I’m here to help.
Contact