Feature image for Marin: September 2023 Market Stats

September 18, 2023

Marin: September 2023 Market Stats

By Compass

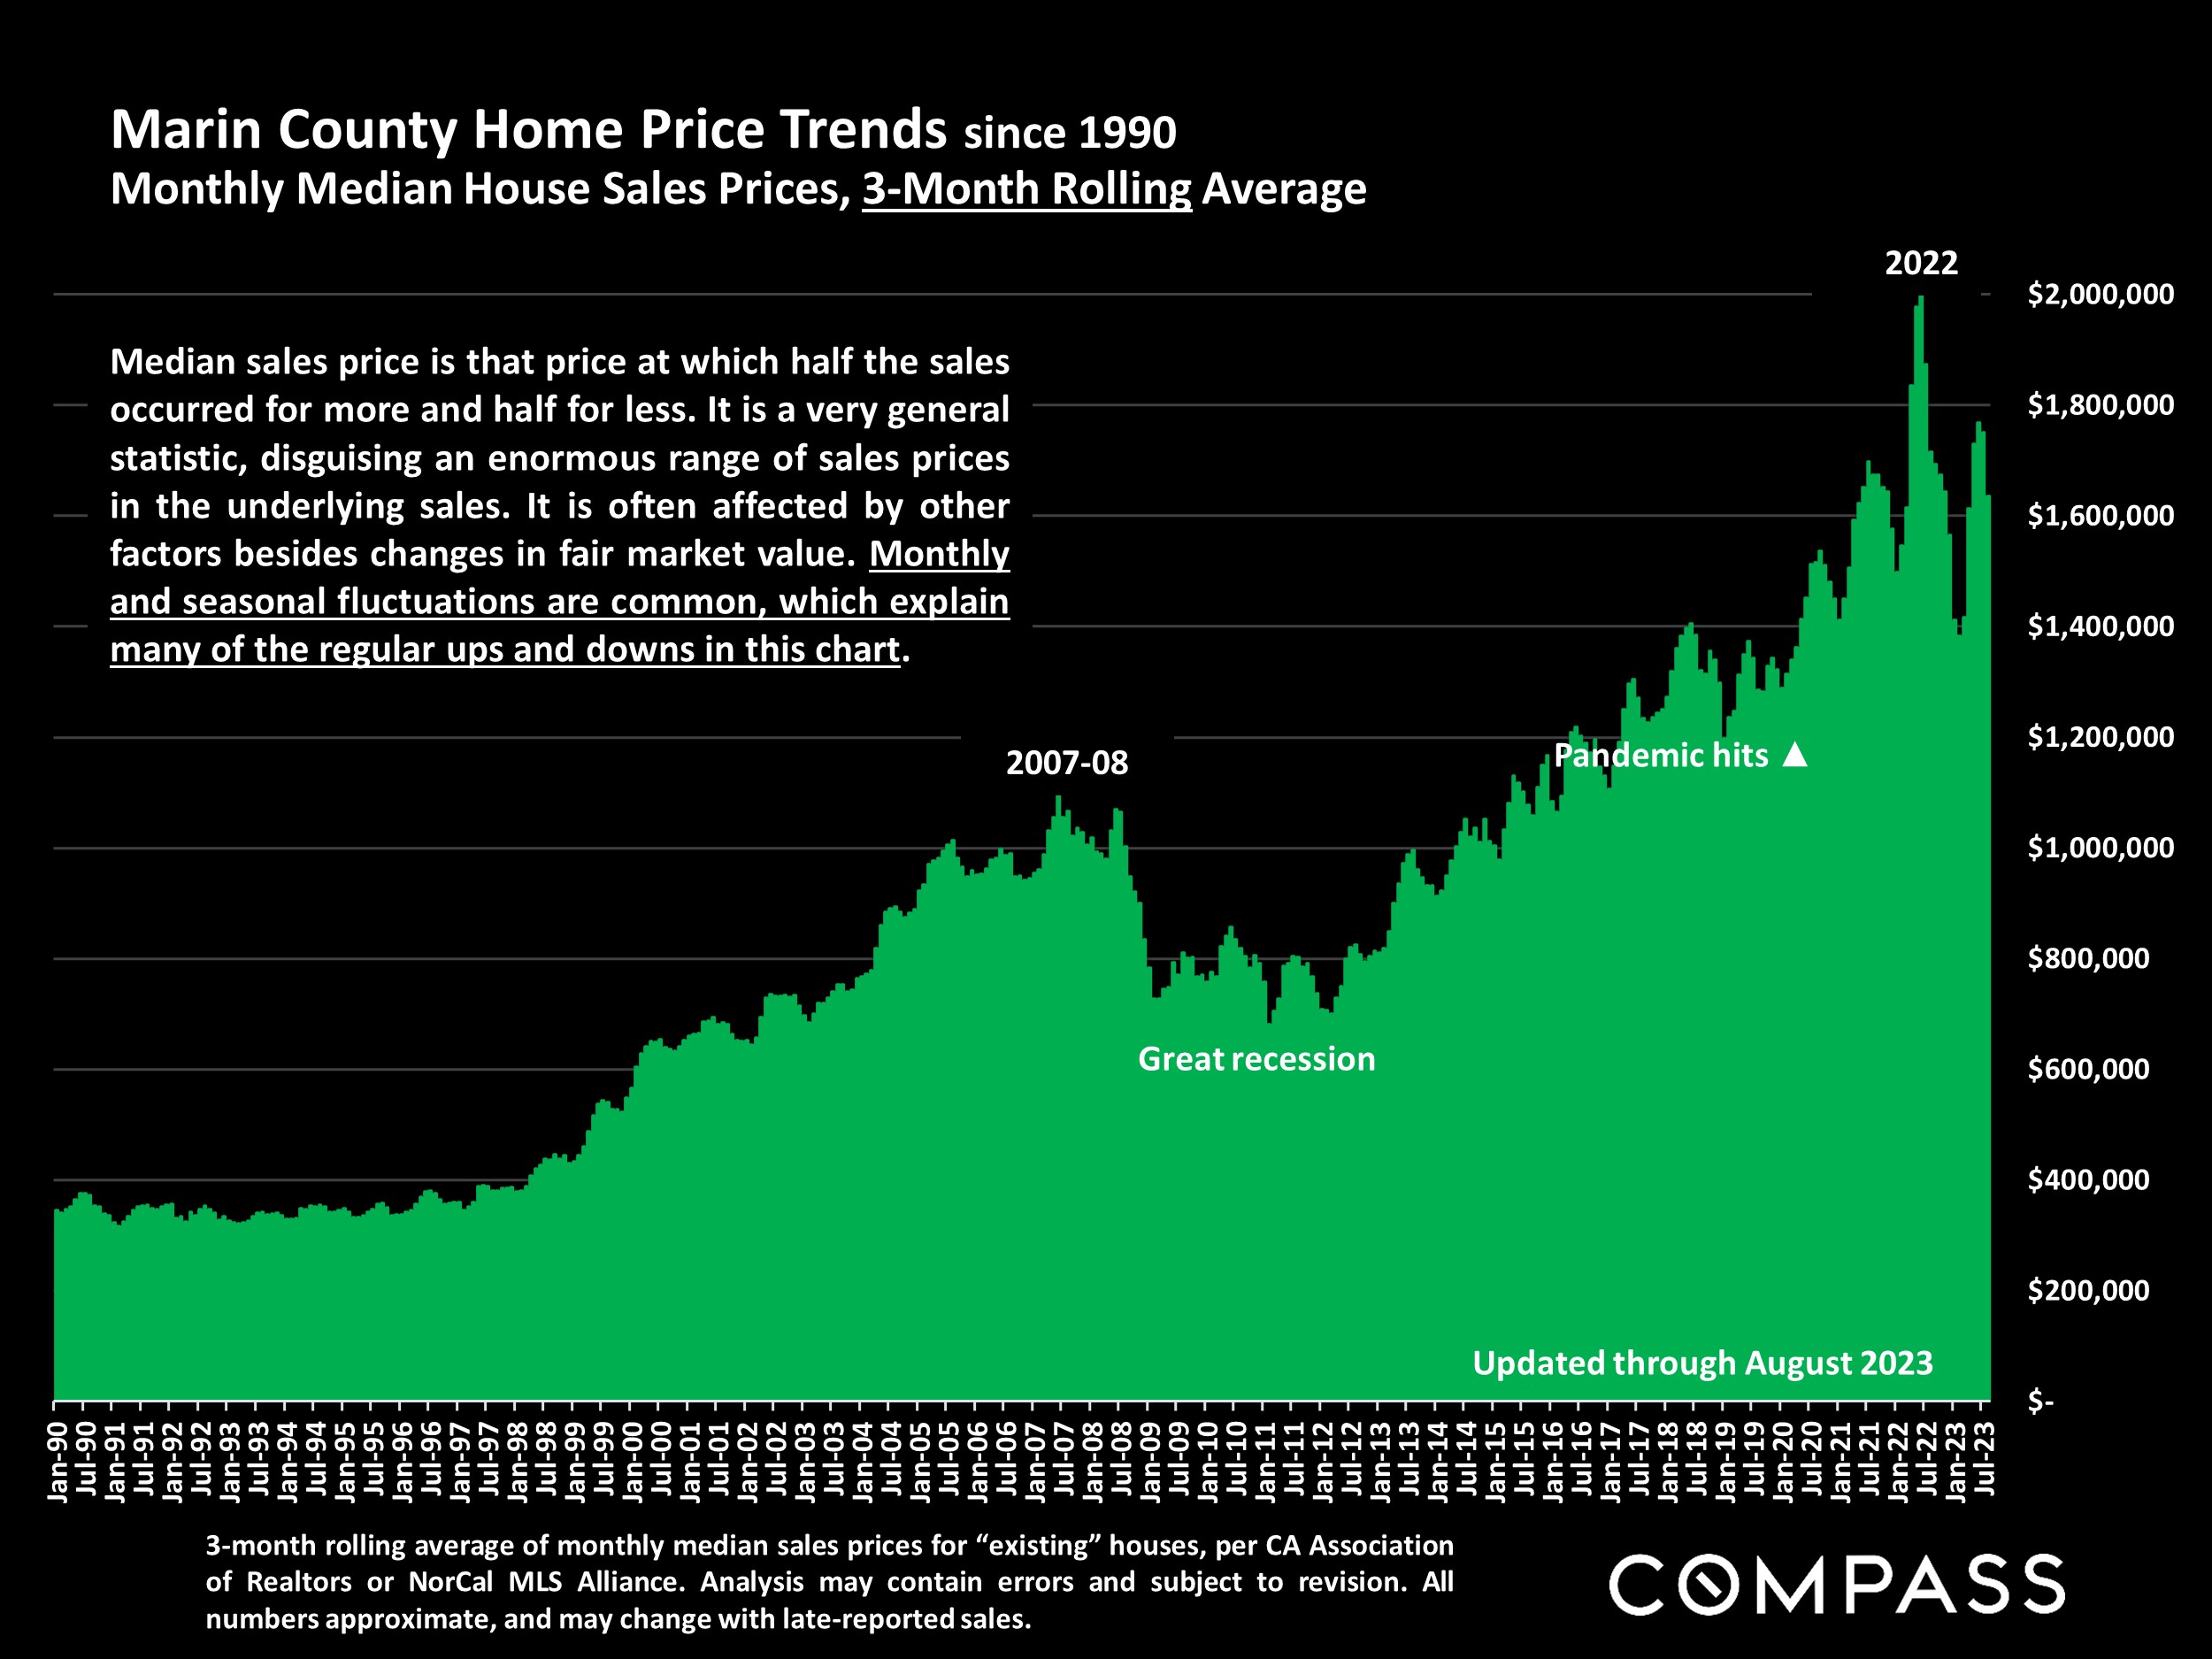
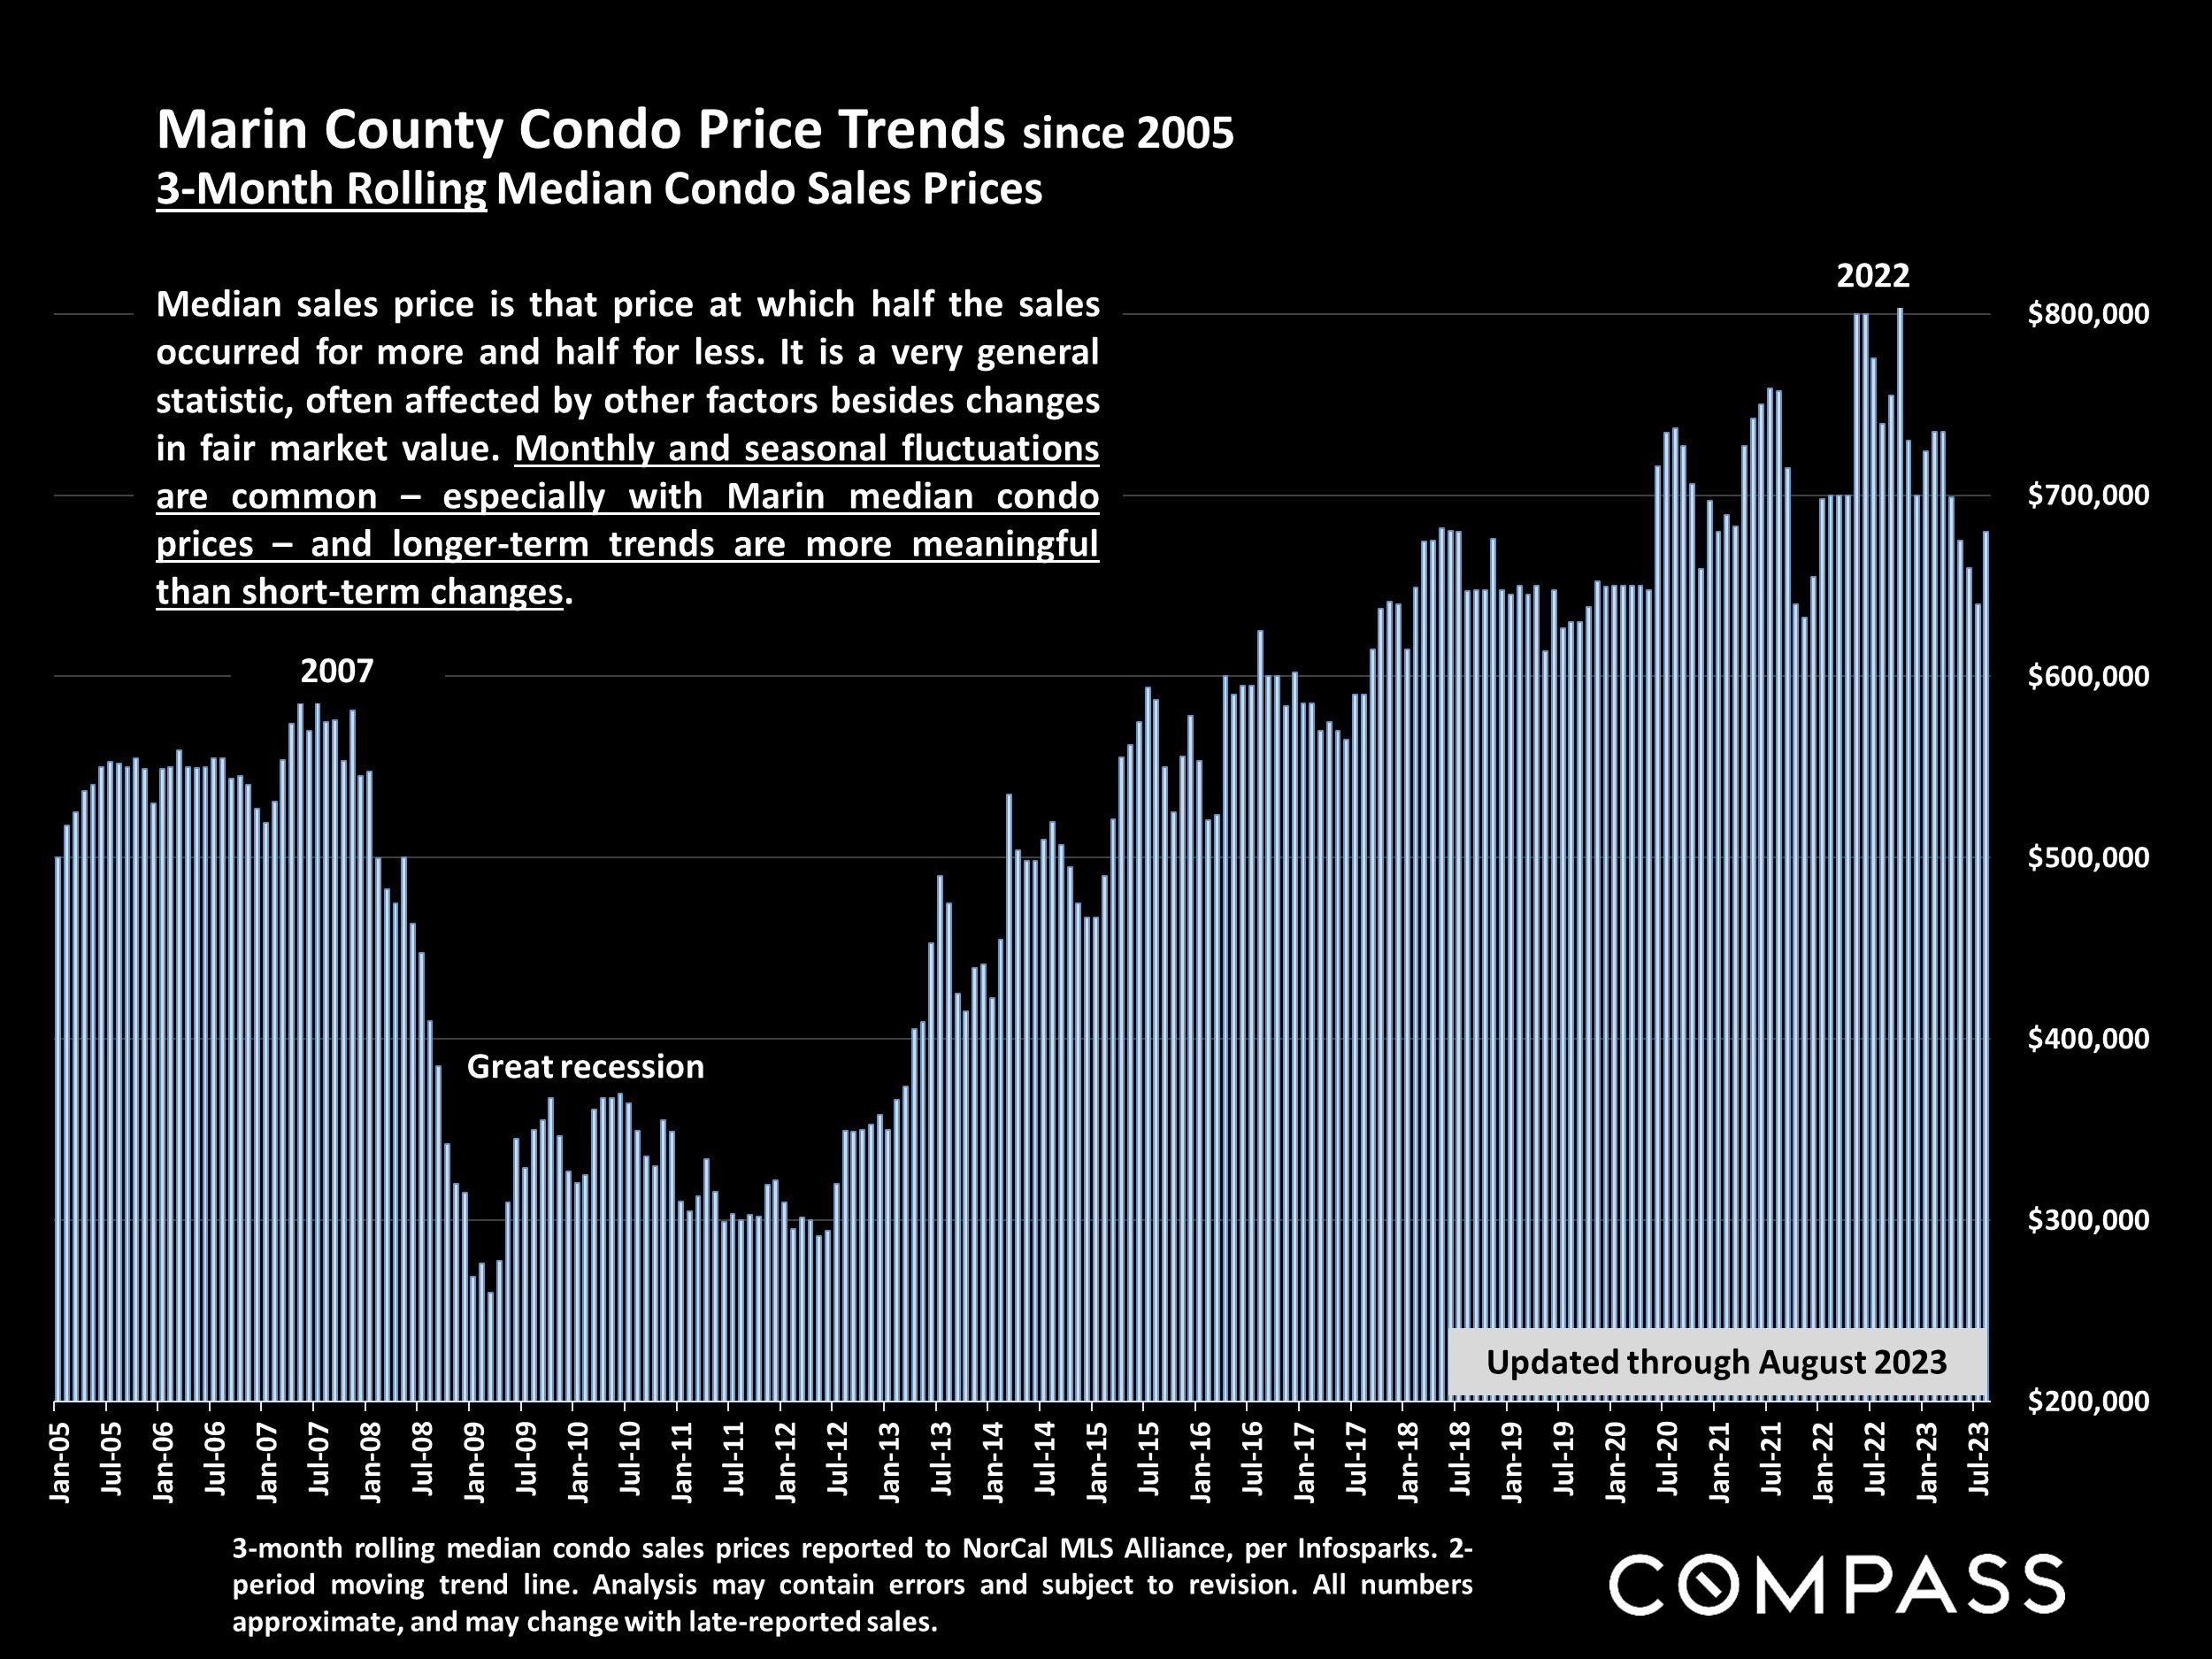
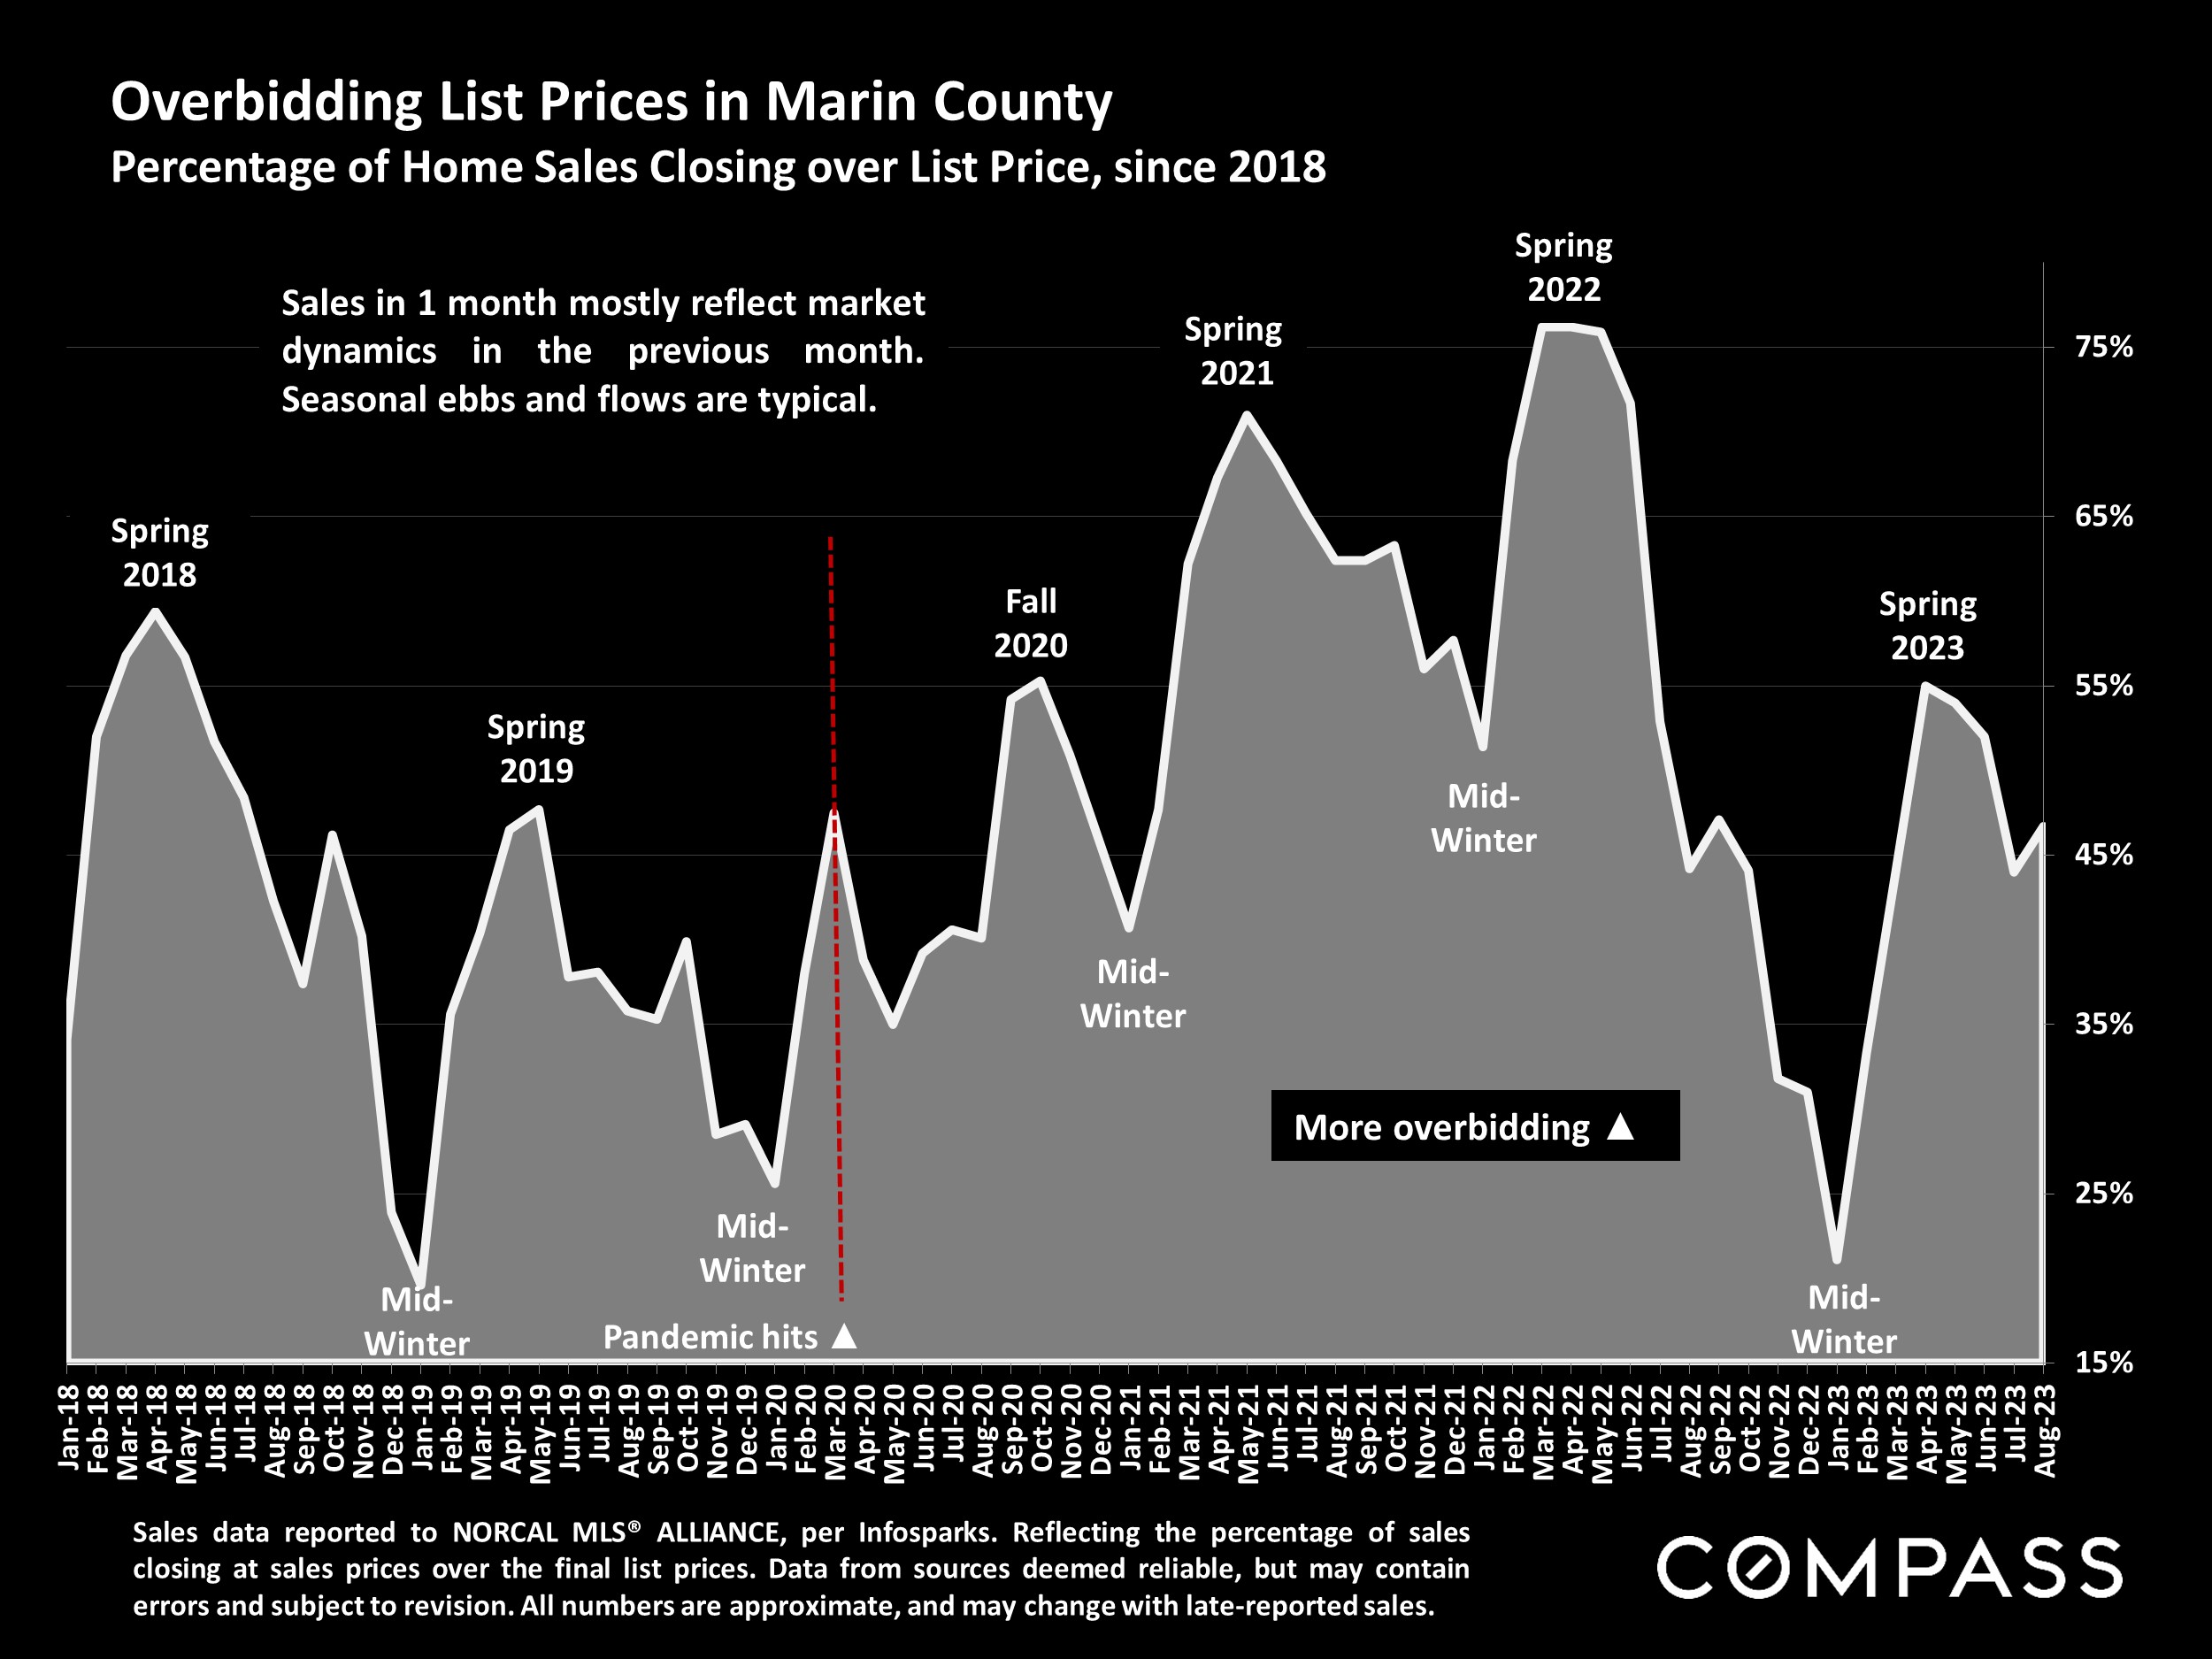
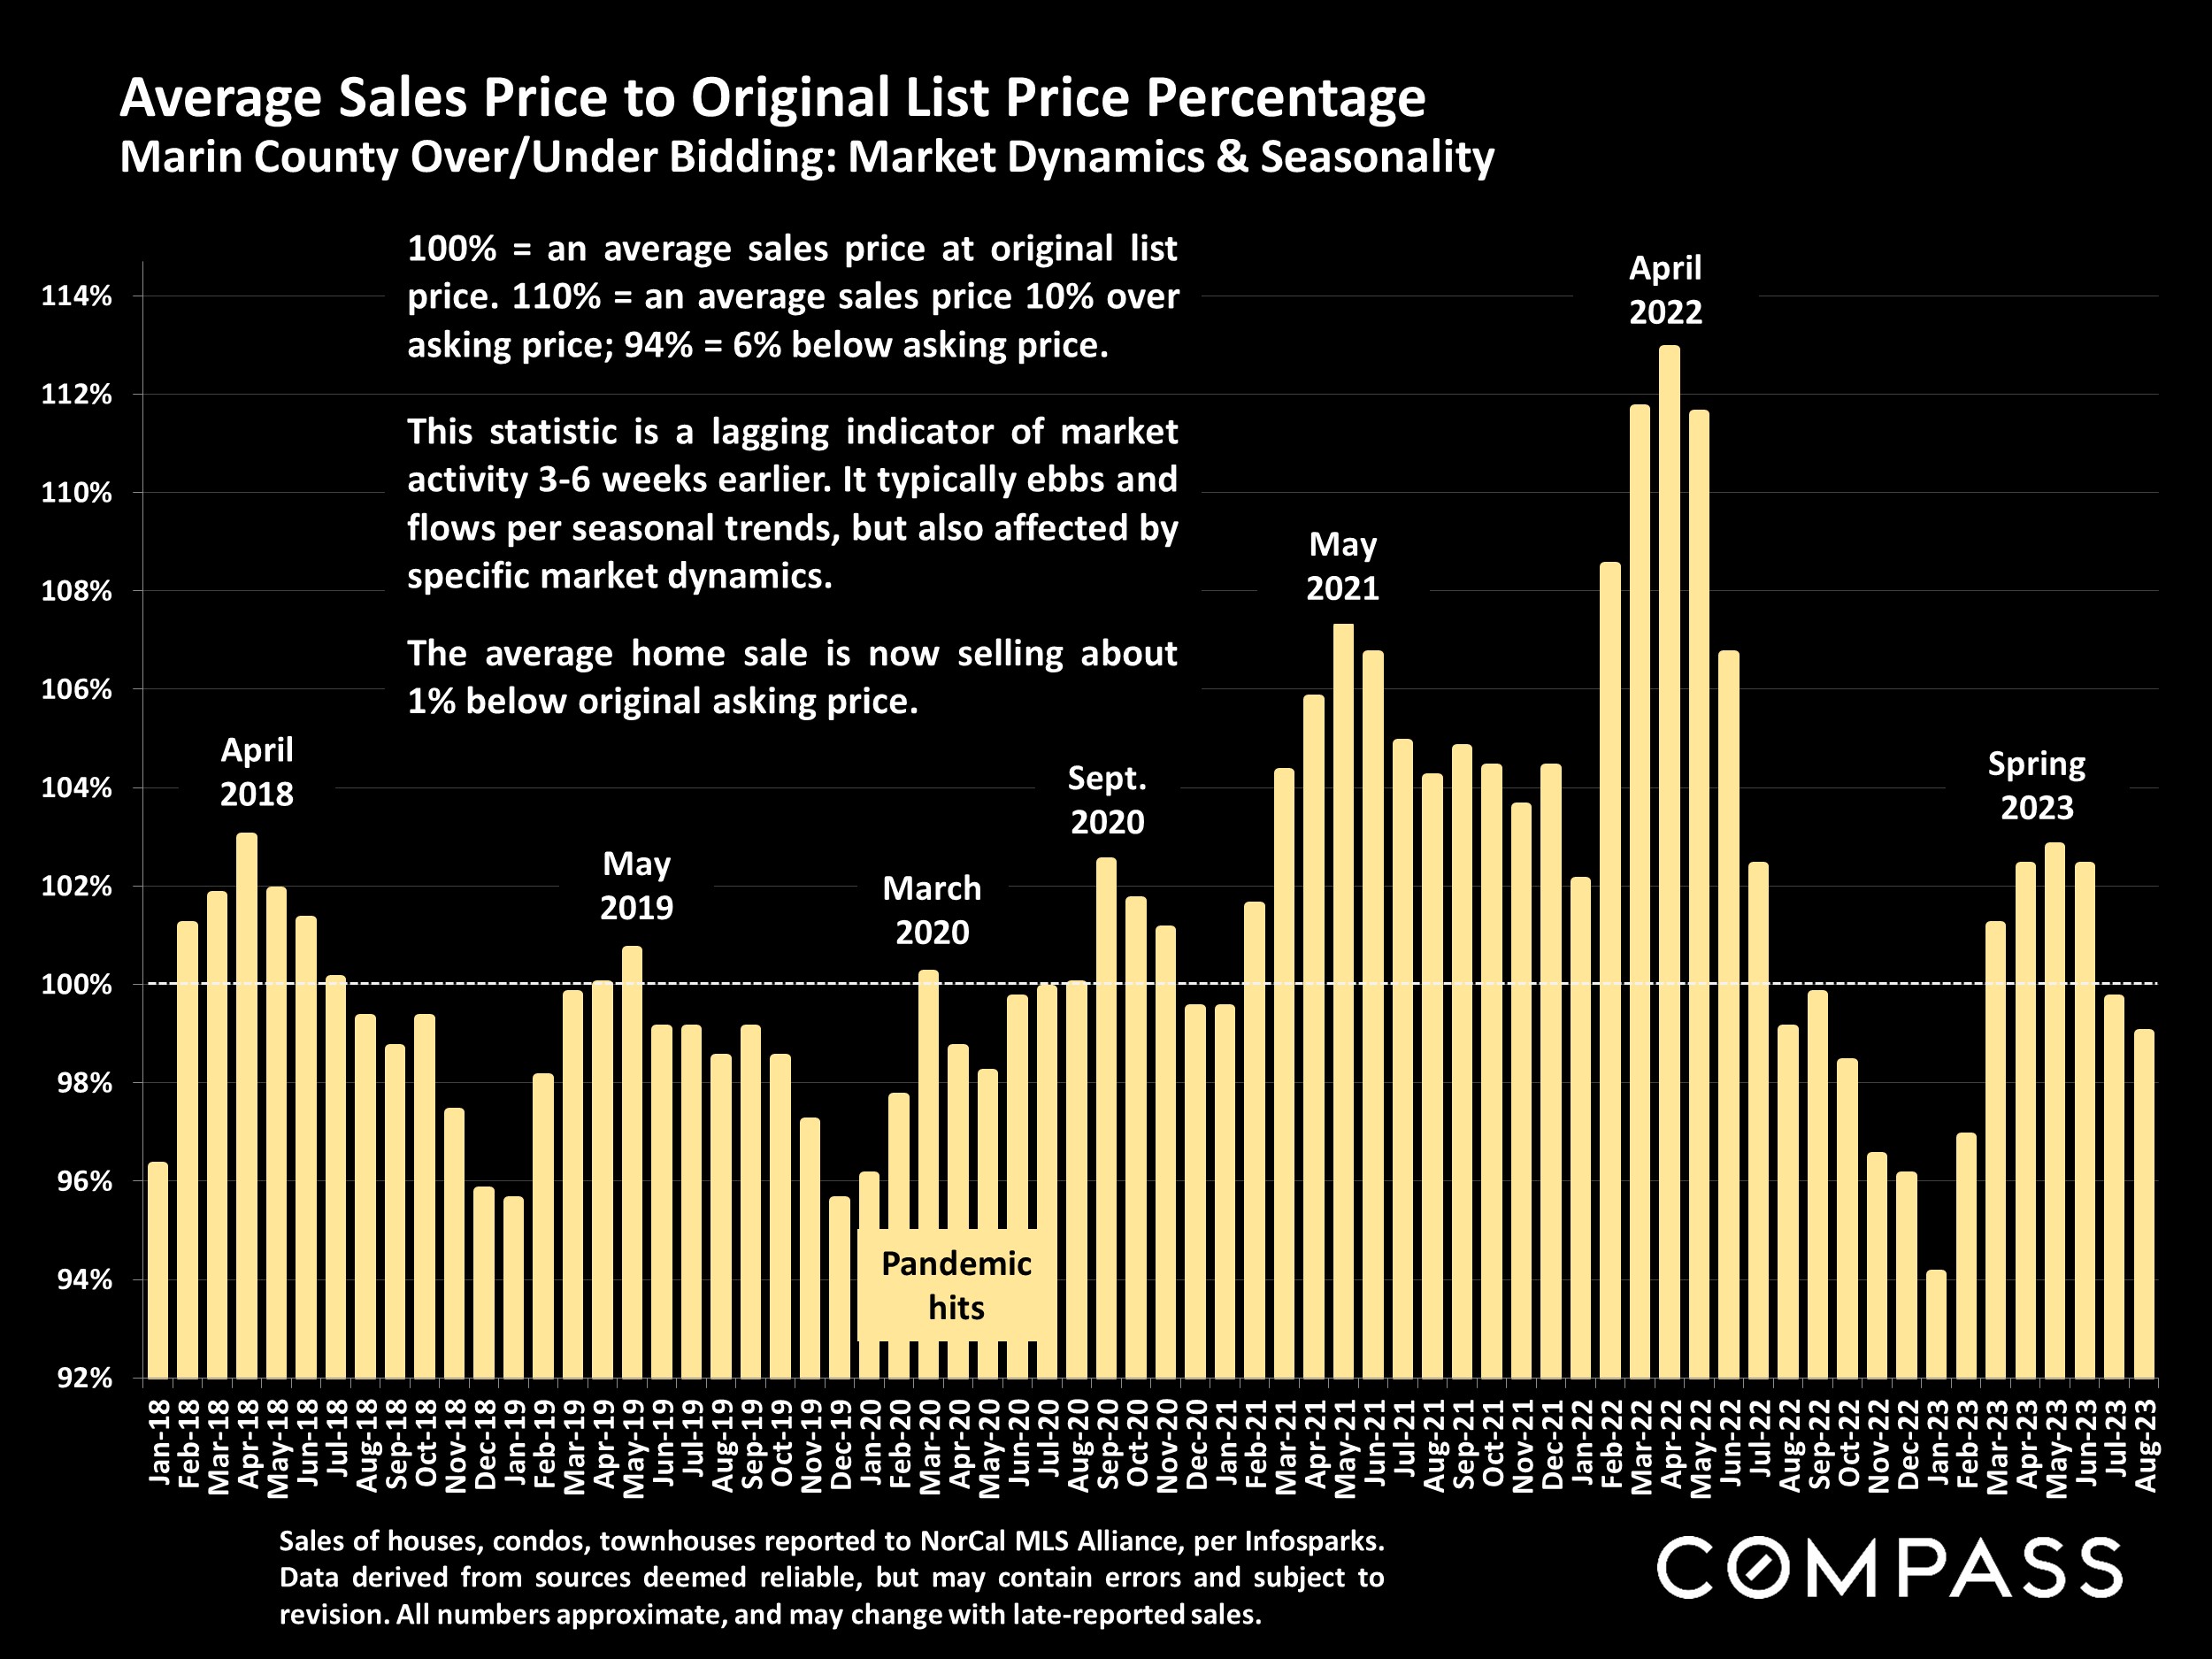
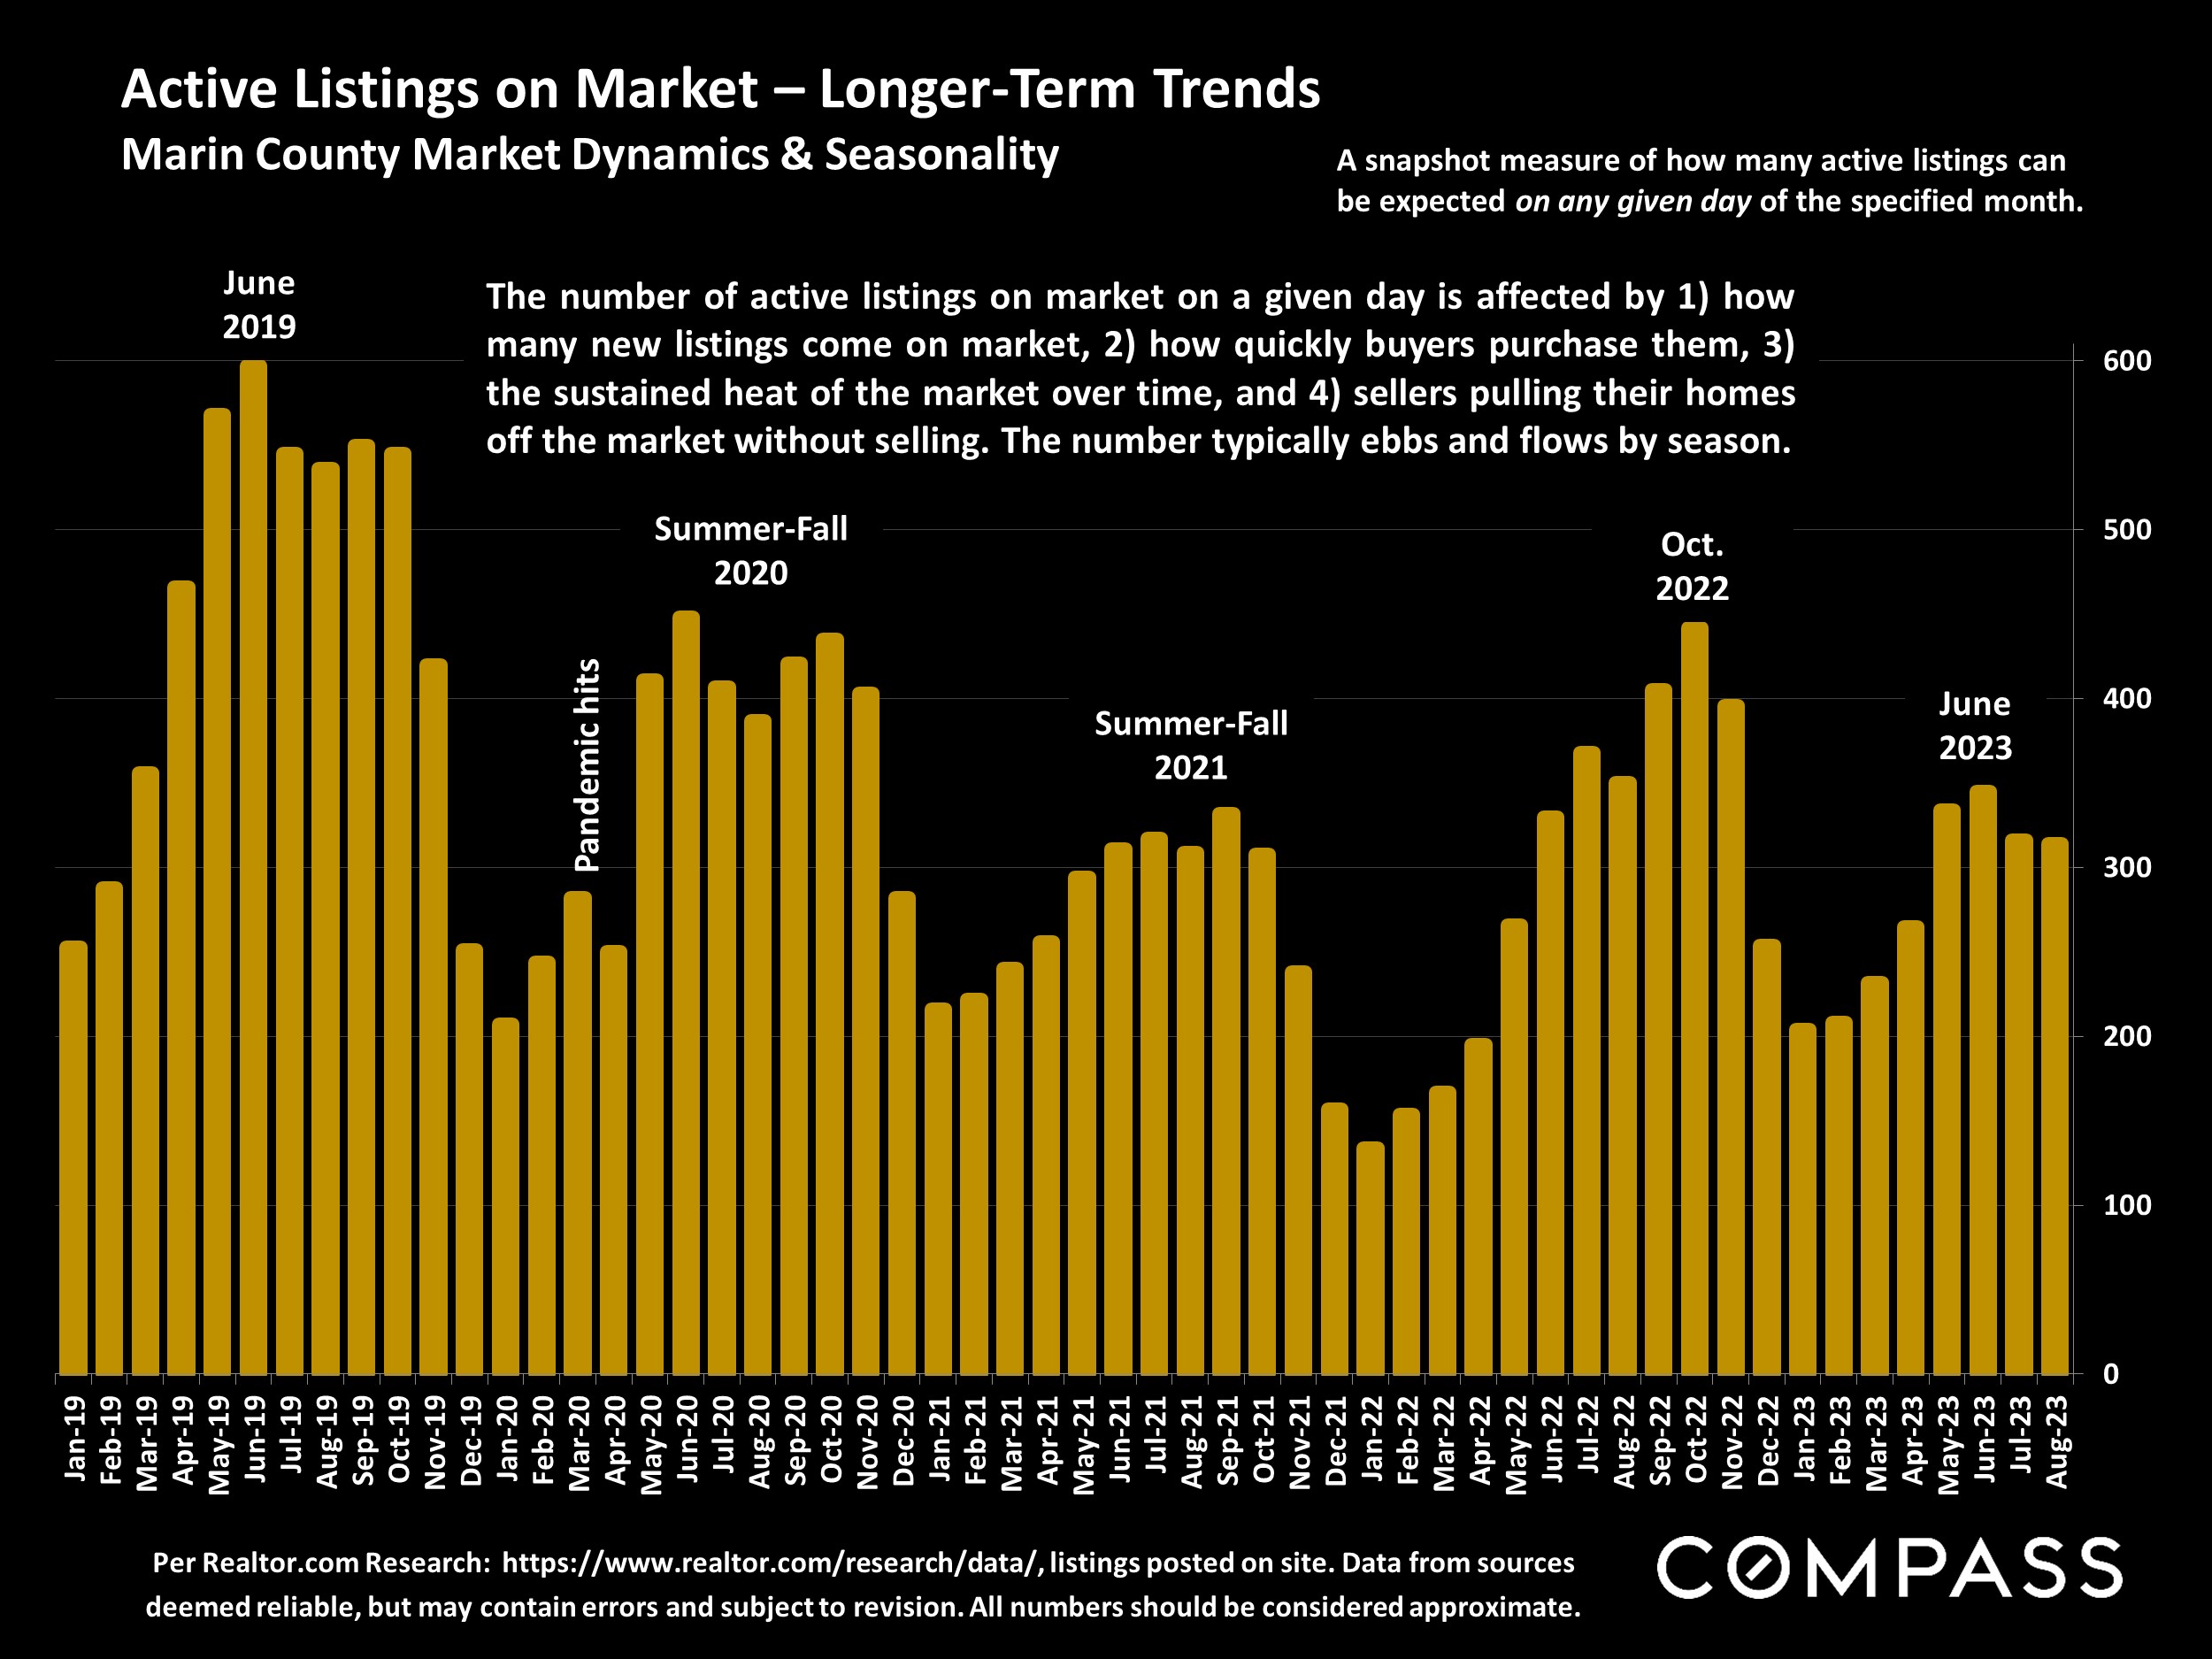
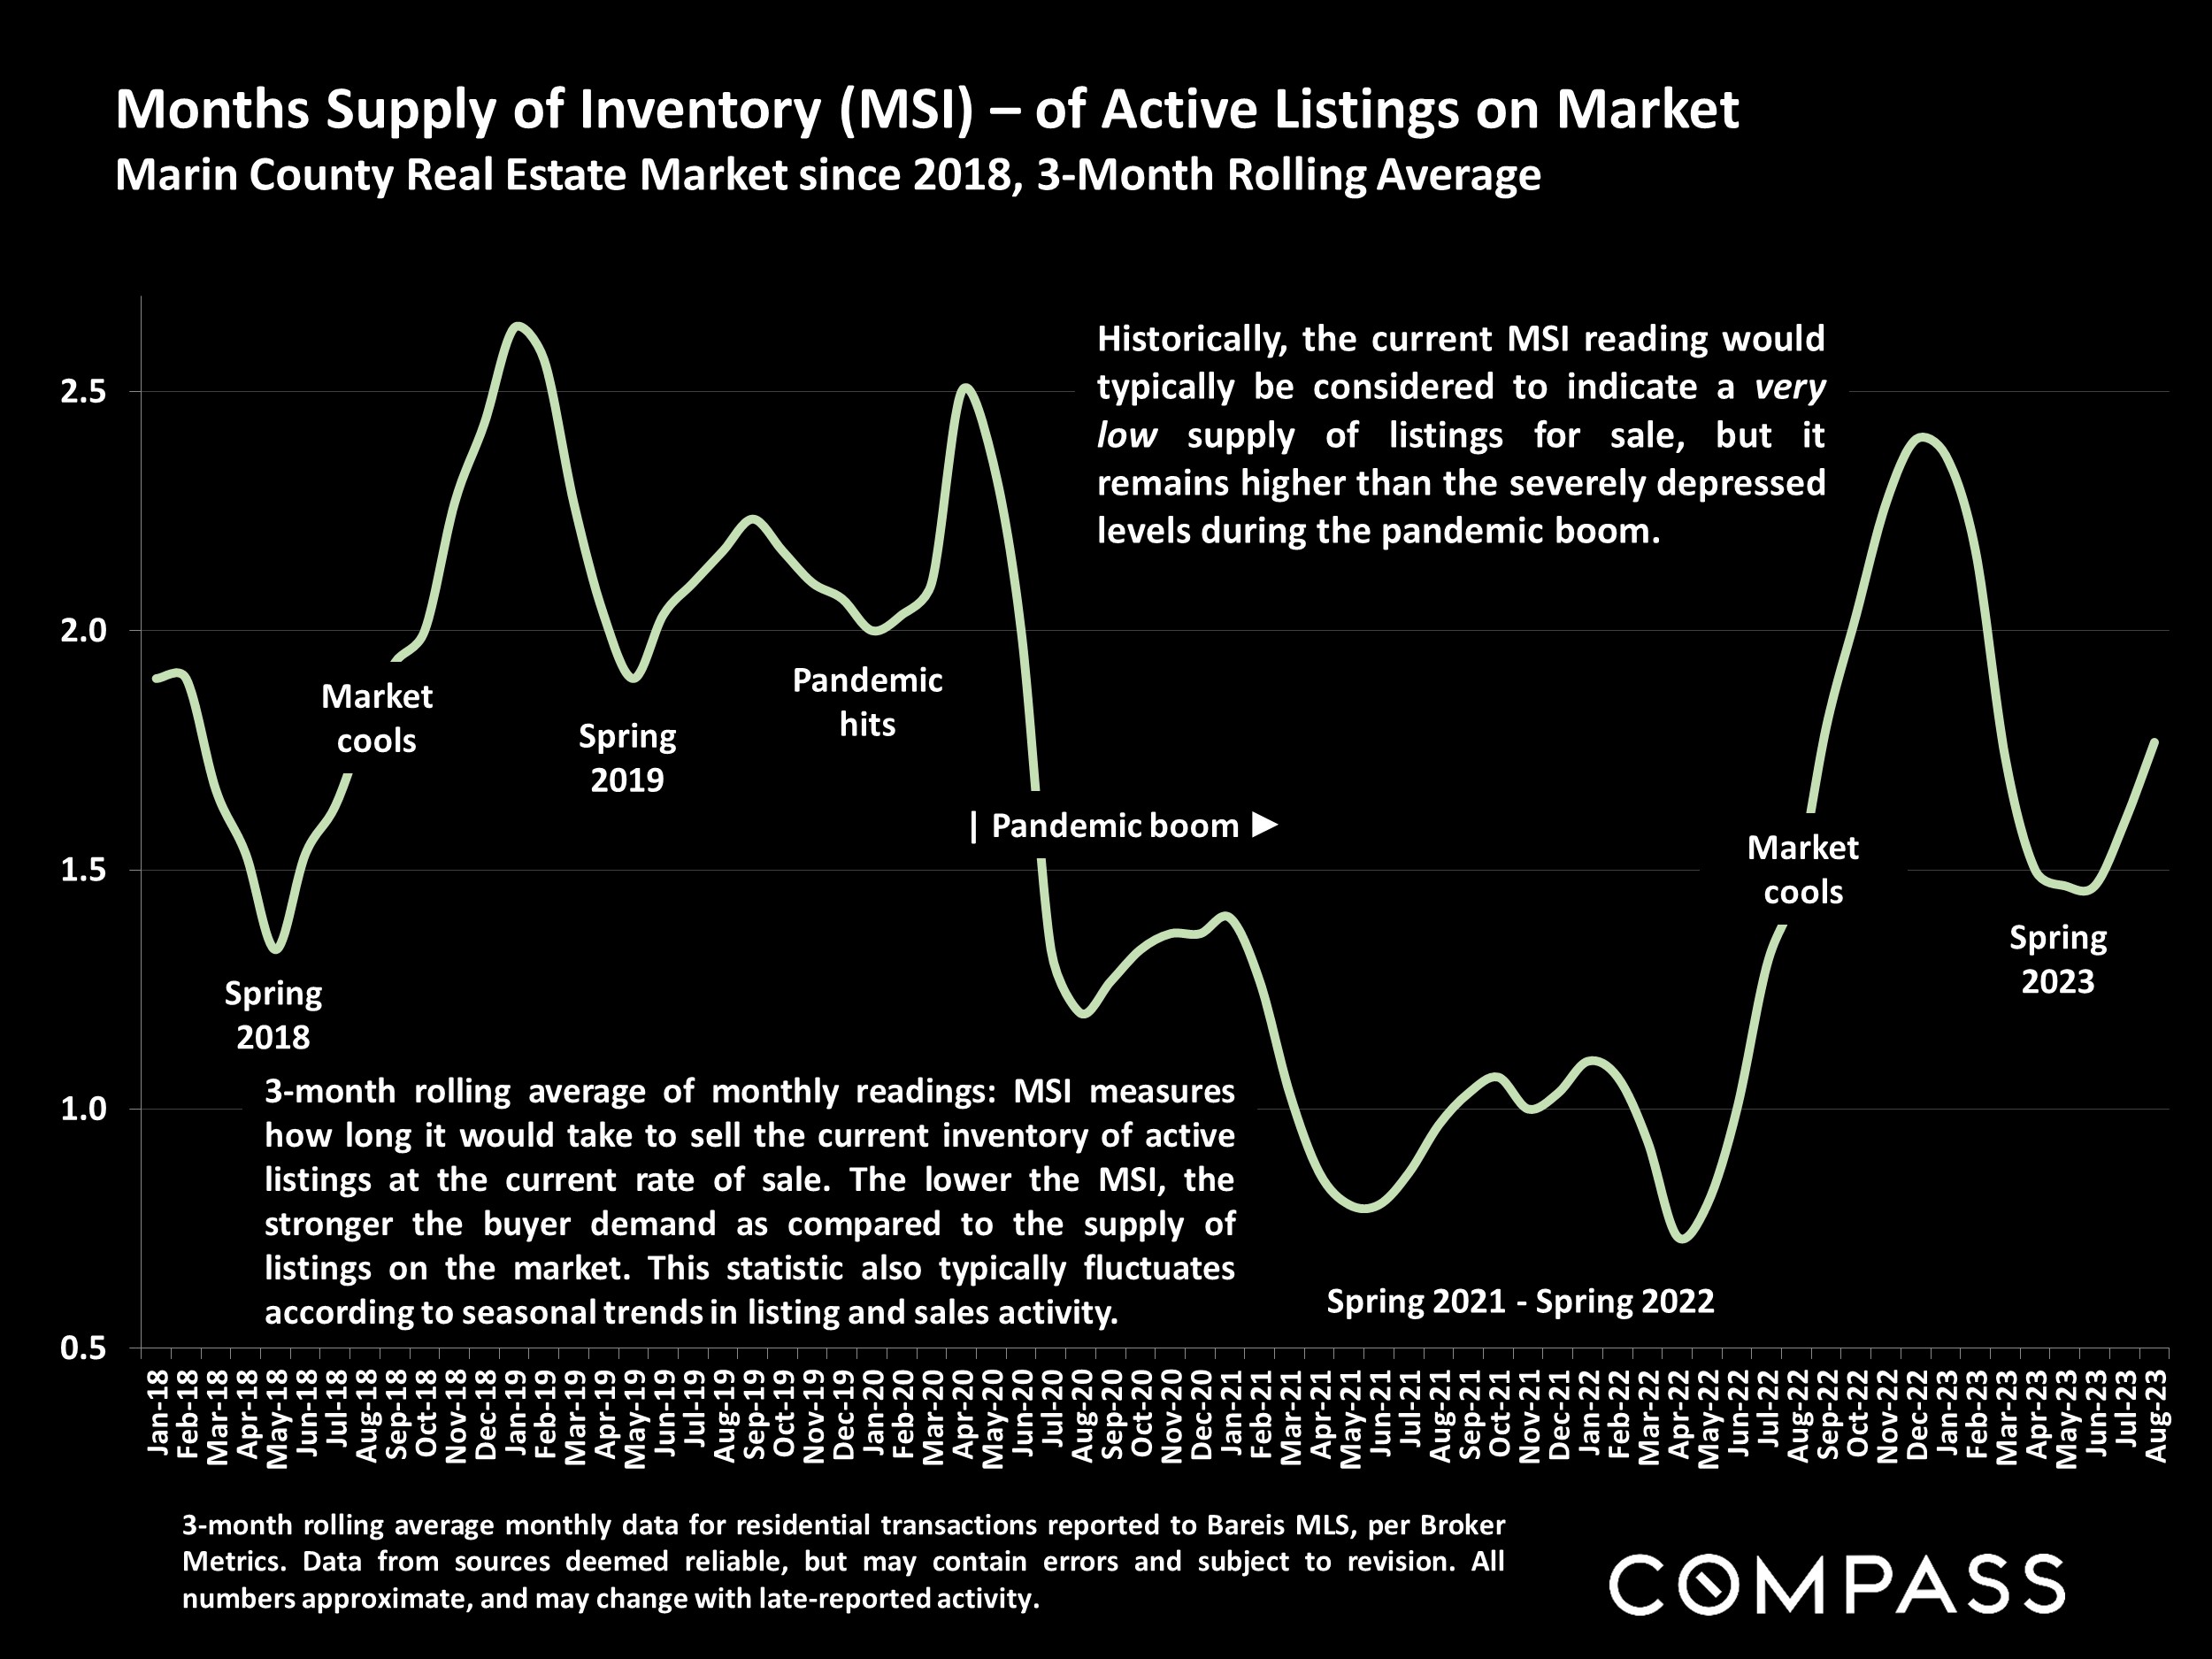
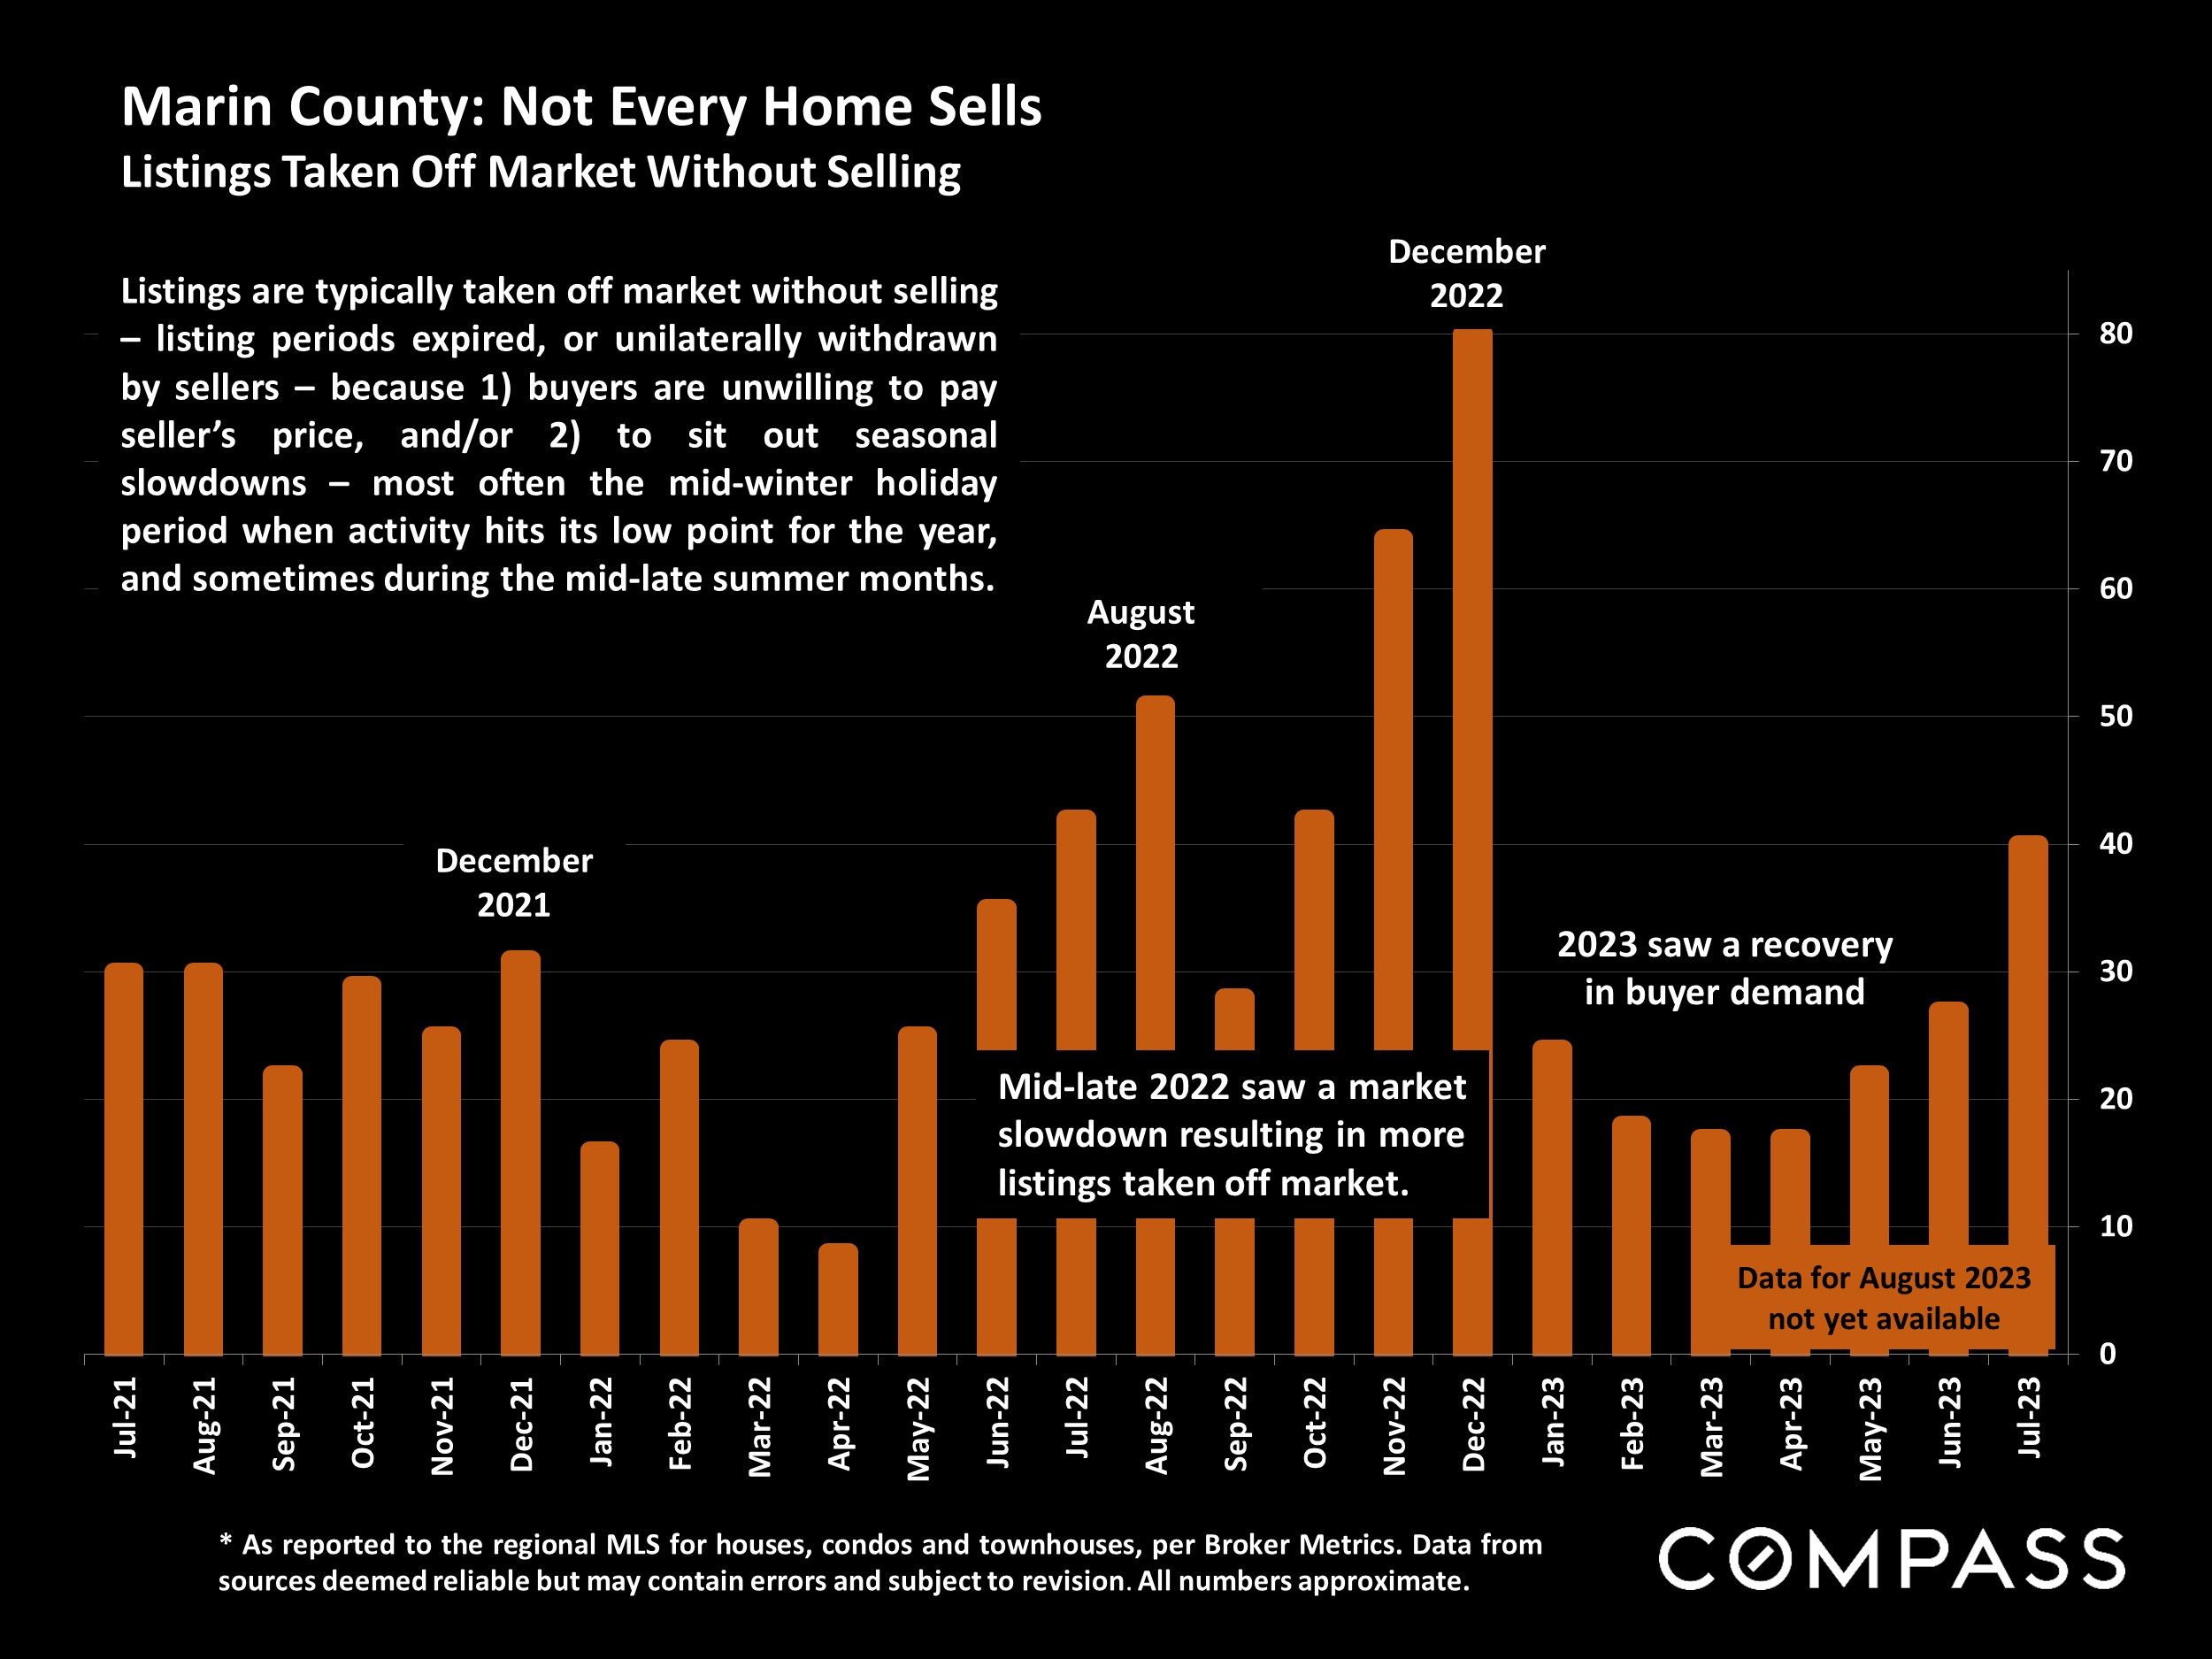
Generally speaking, the market rebounded much more strongly in 2023 than seemed possible at the end of 2022, when, after hitting historic peaks during the pandemic boom, economic and demand indicators hit their lowest points since the great recession. The decline in the number of sellers putting their homes on the market continues to be an enormous factor in the balance – or imbalance – between supply and demand, in the recovery in home prices, and the decline of overall sales volumes. 

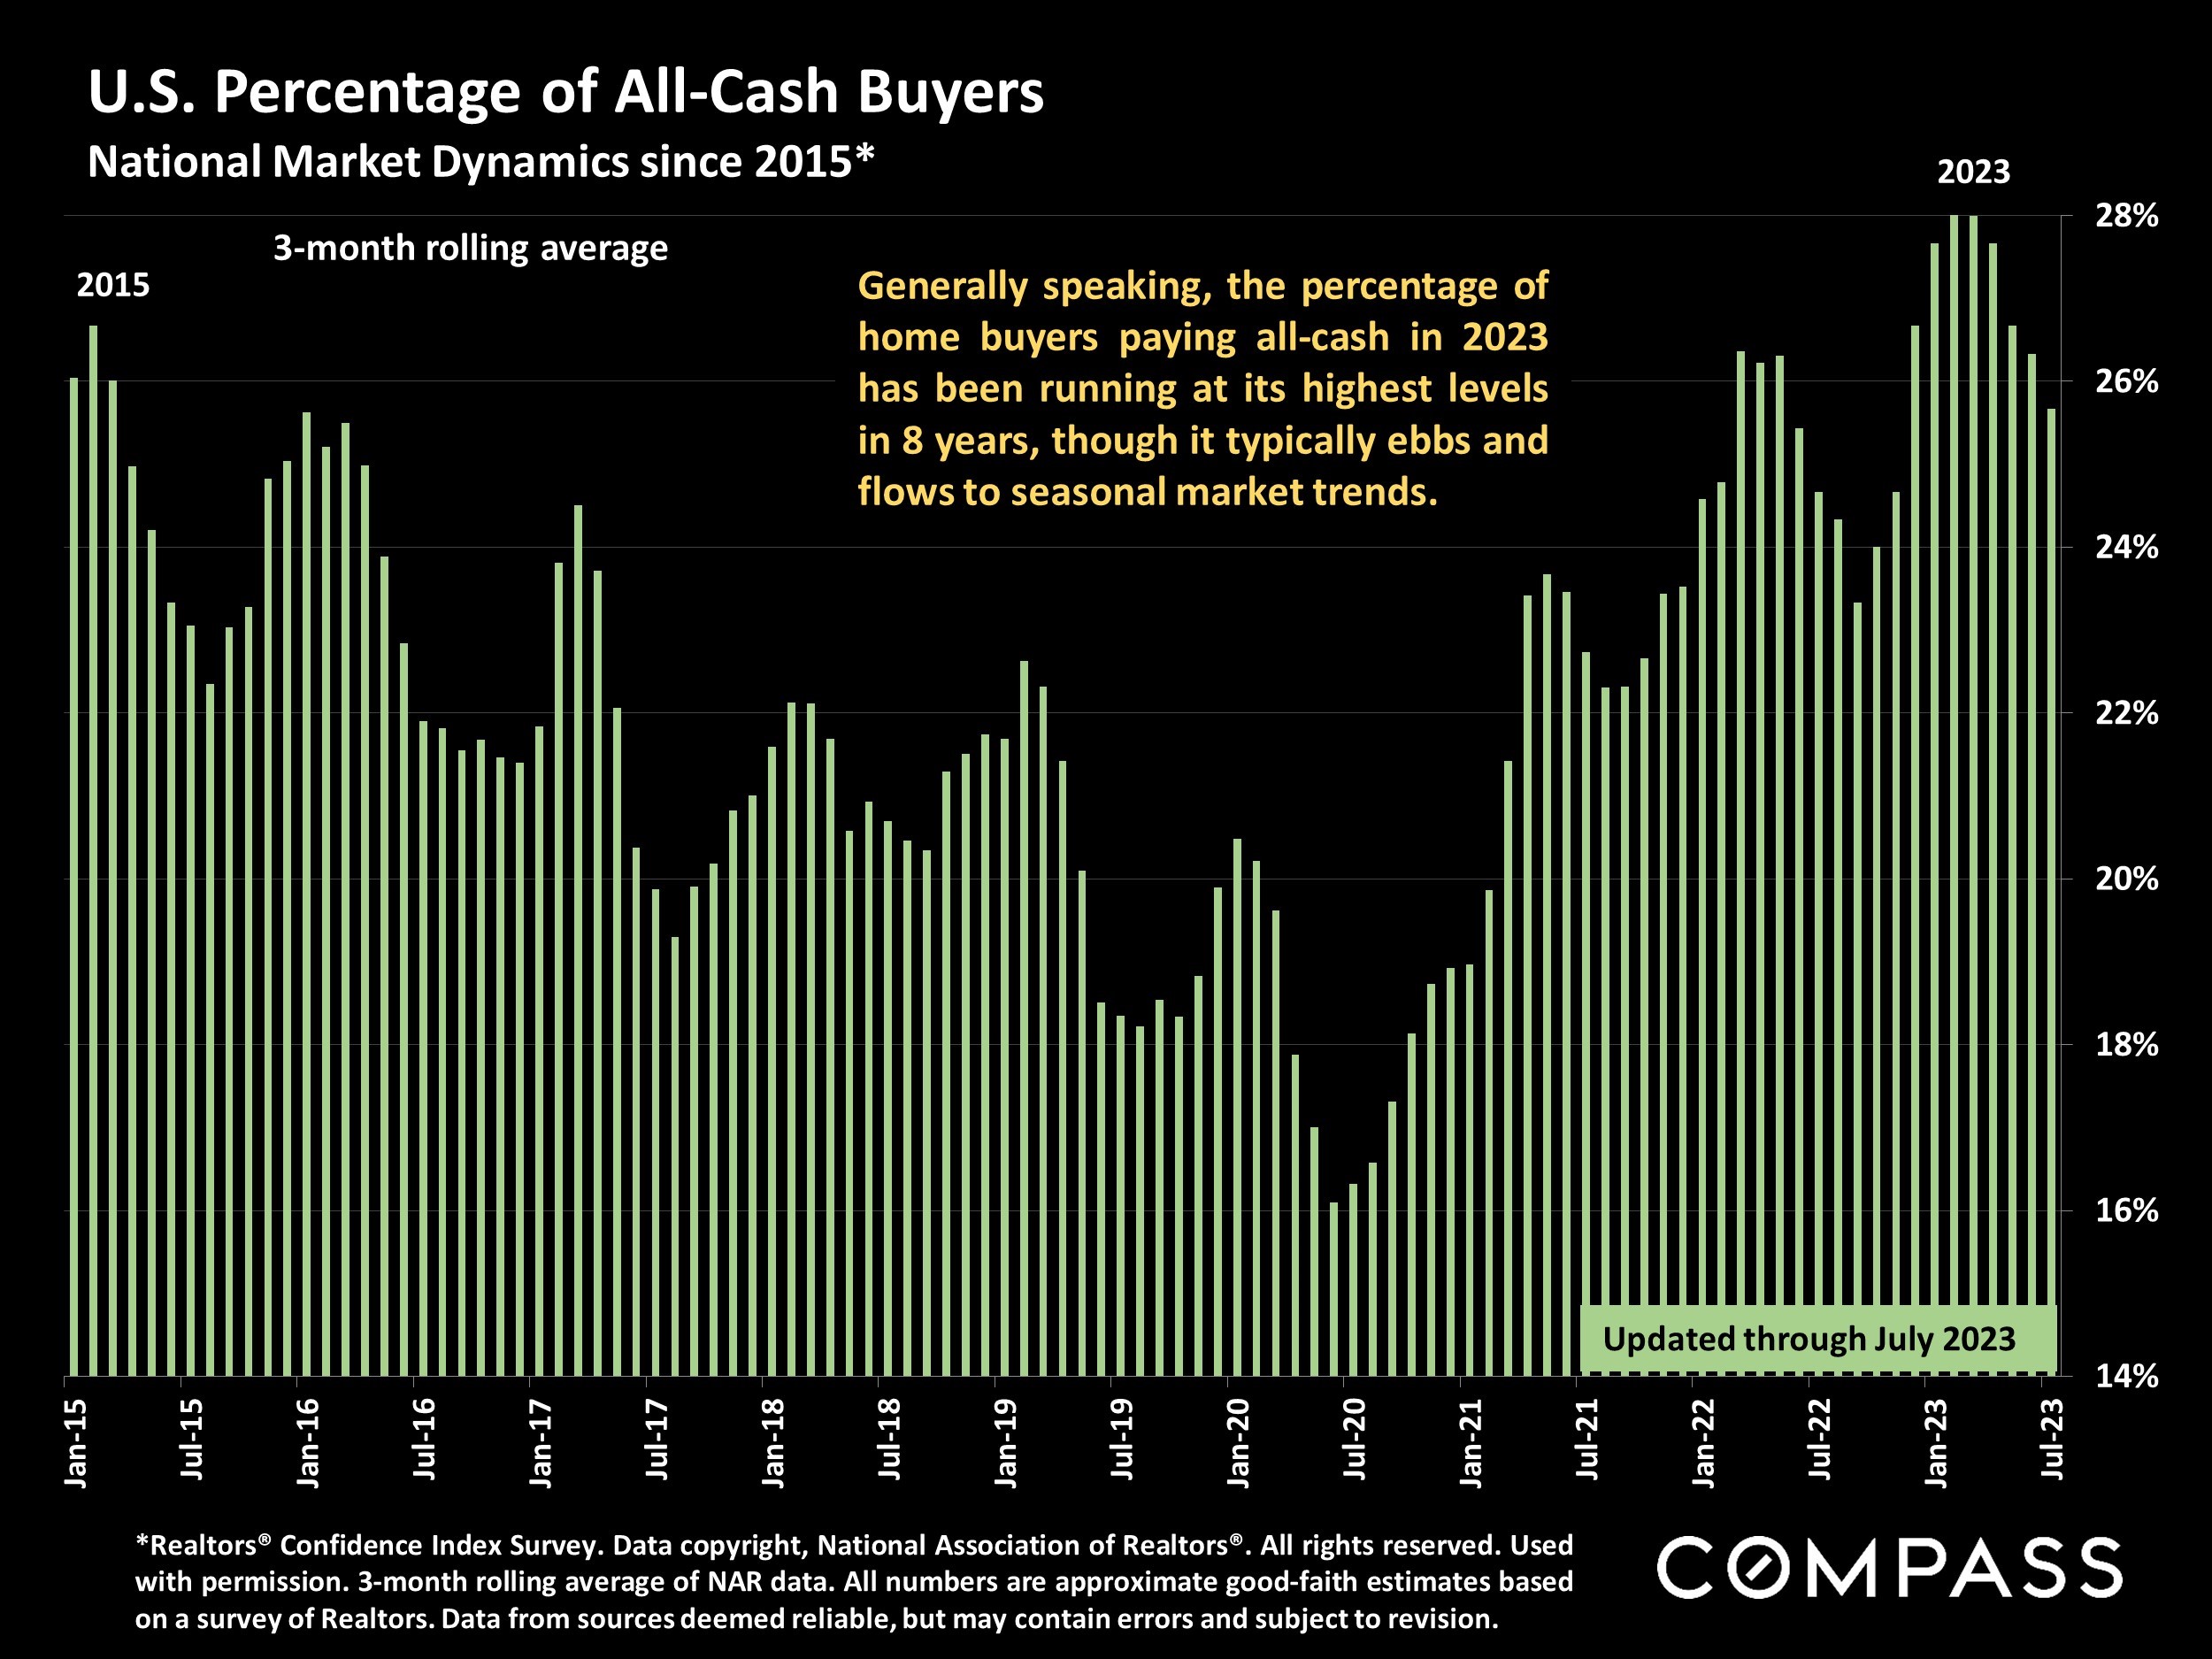
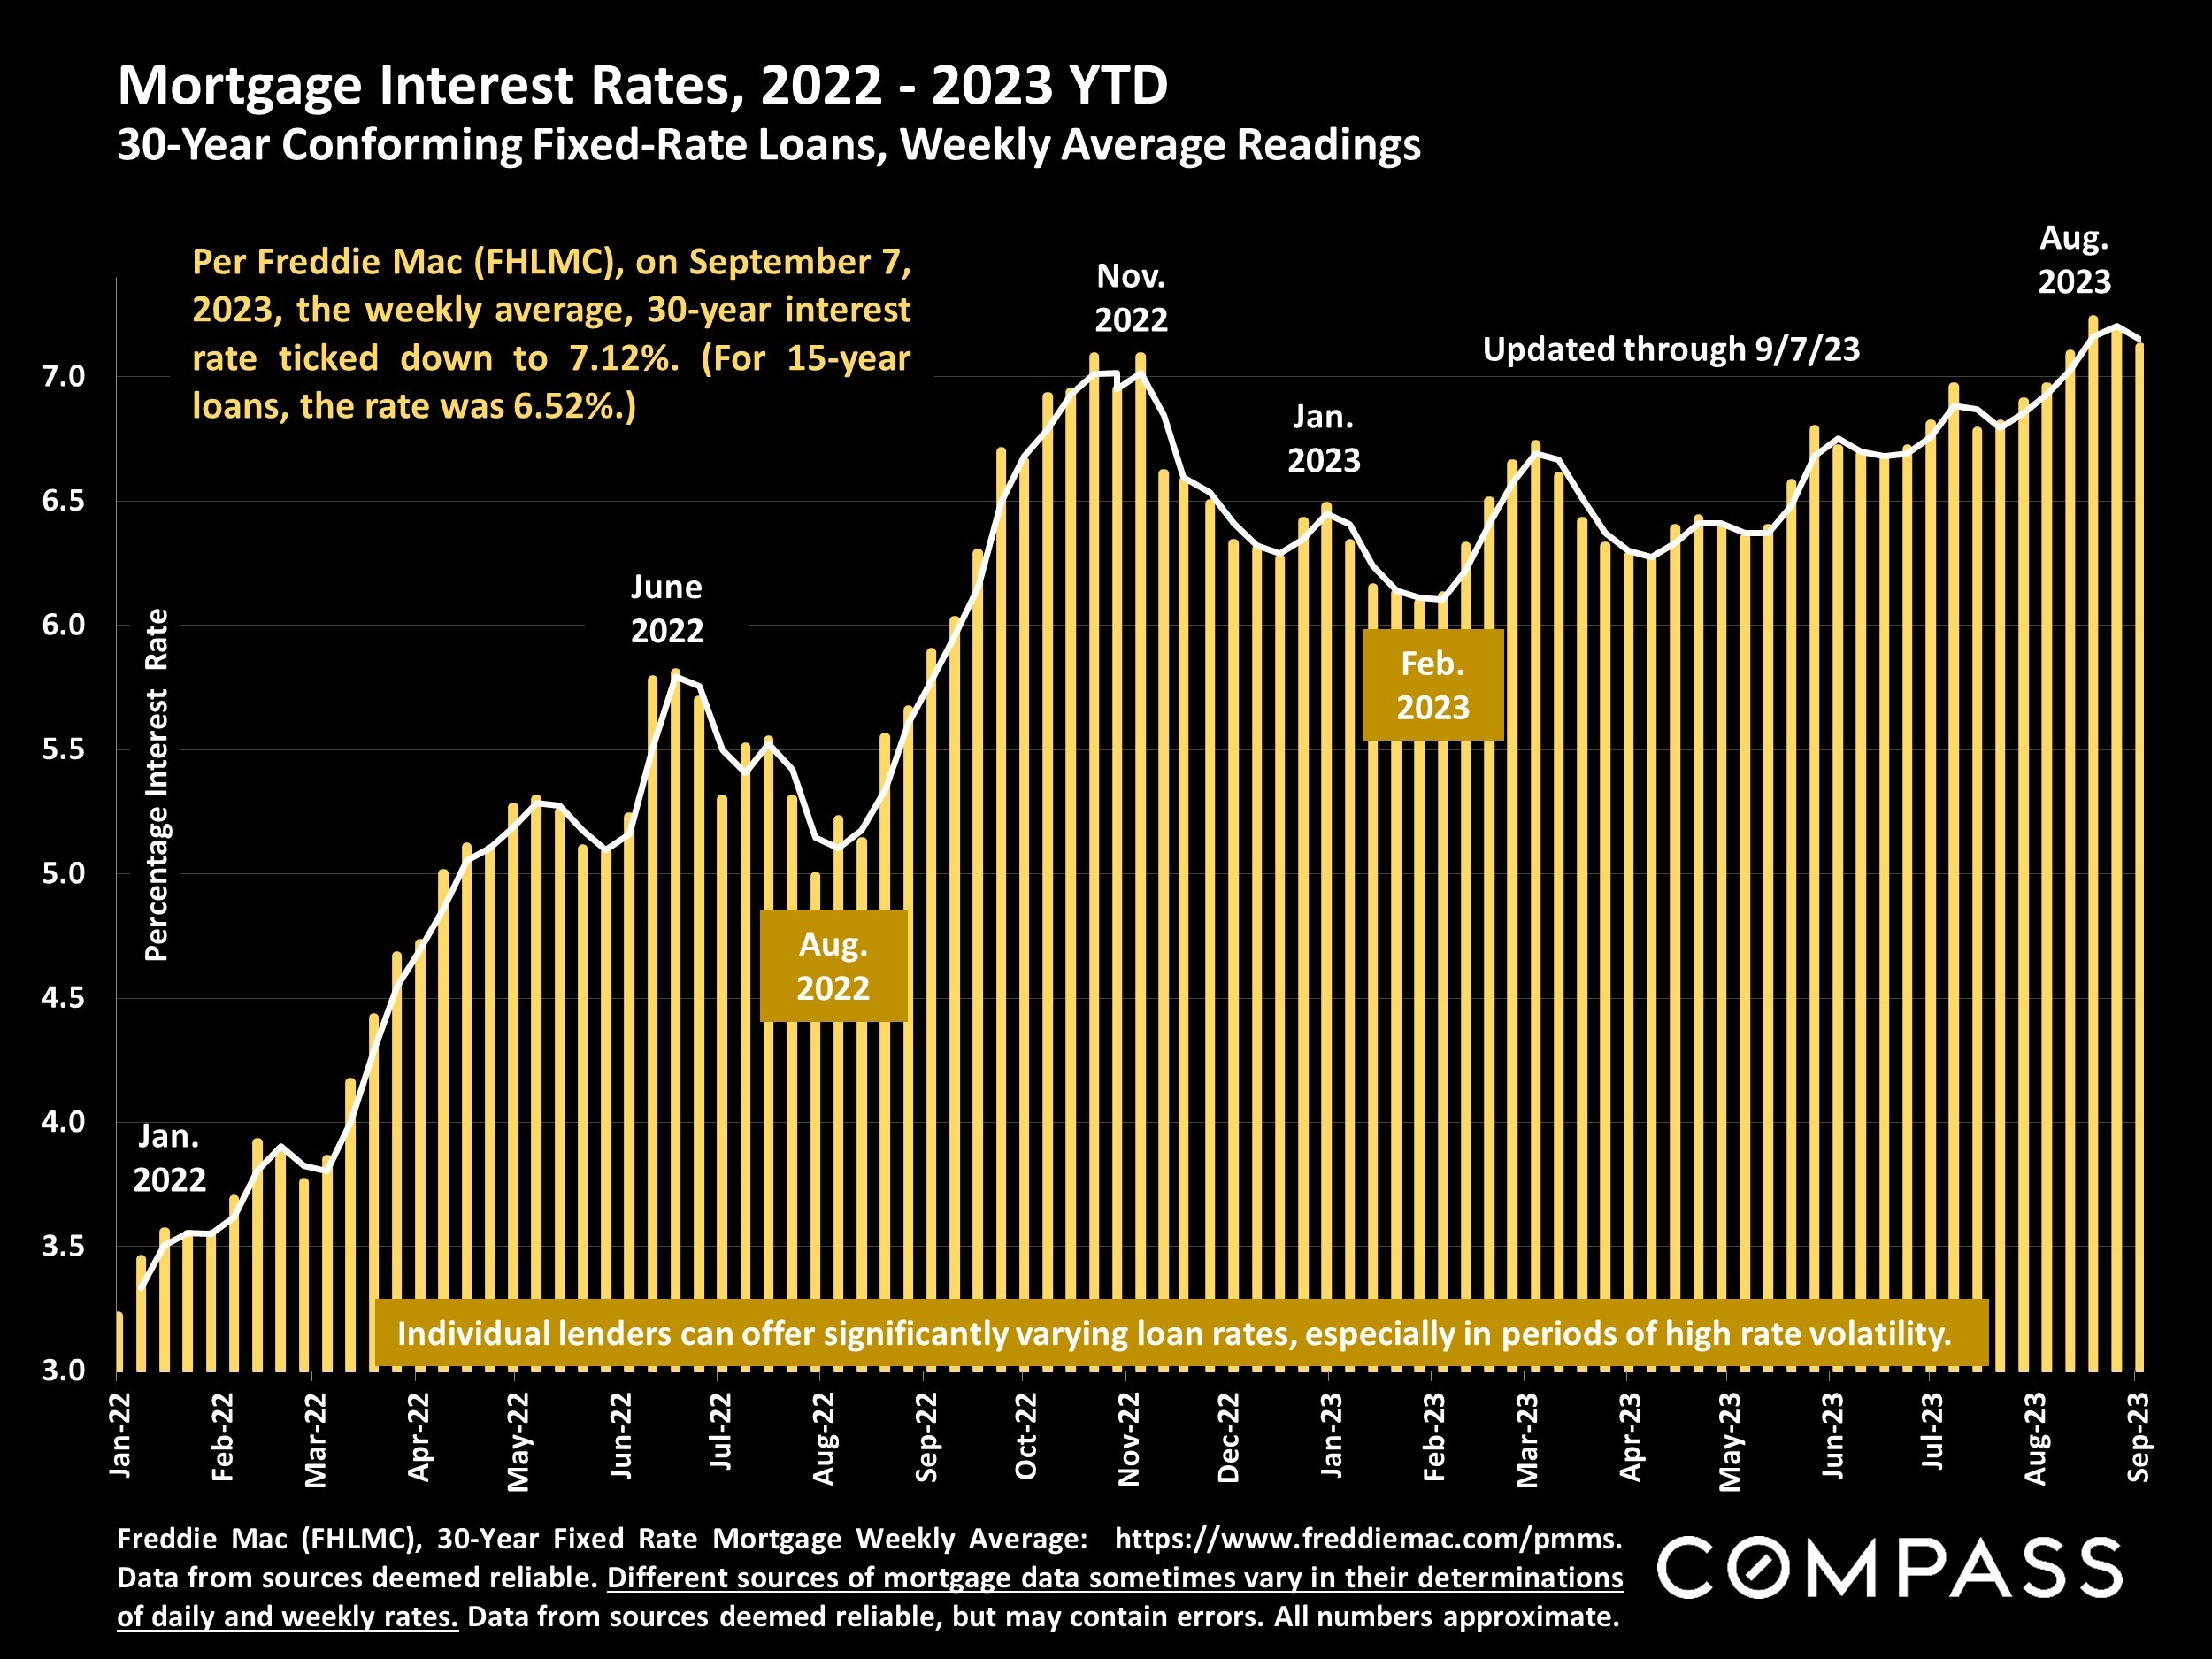
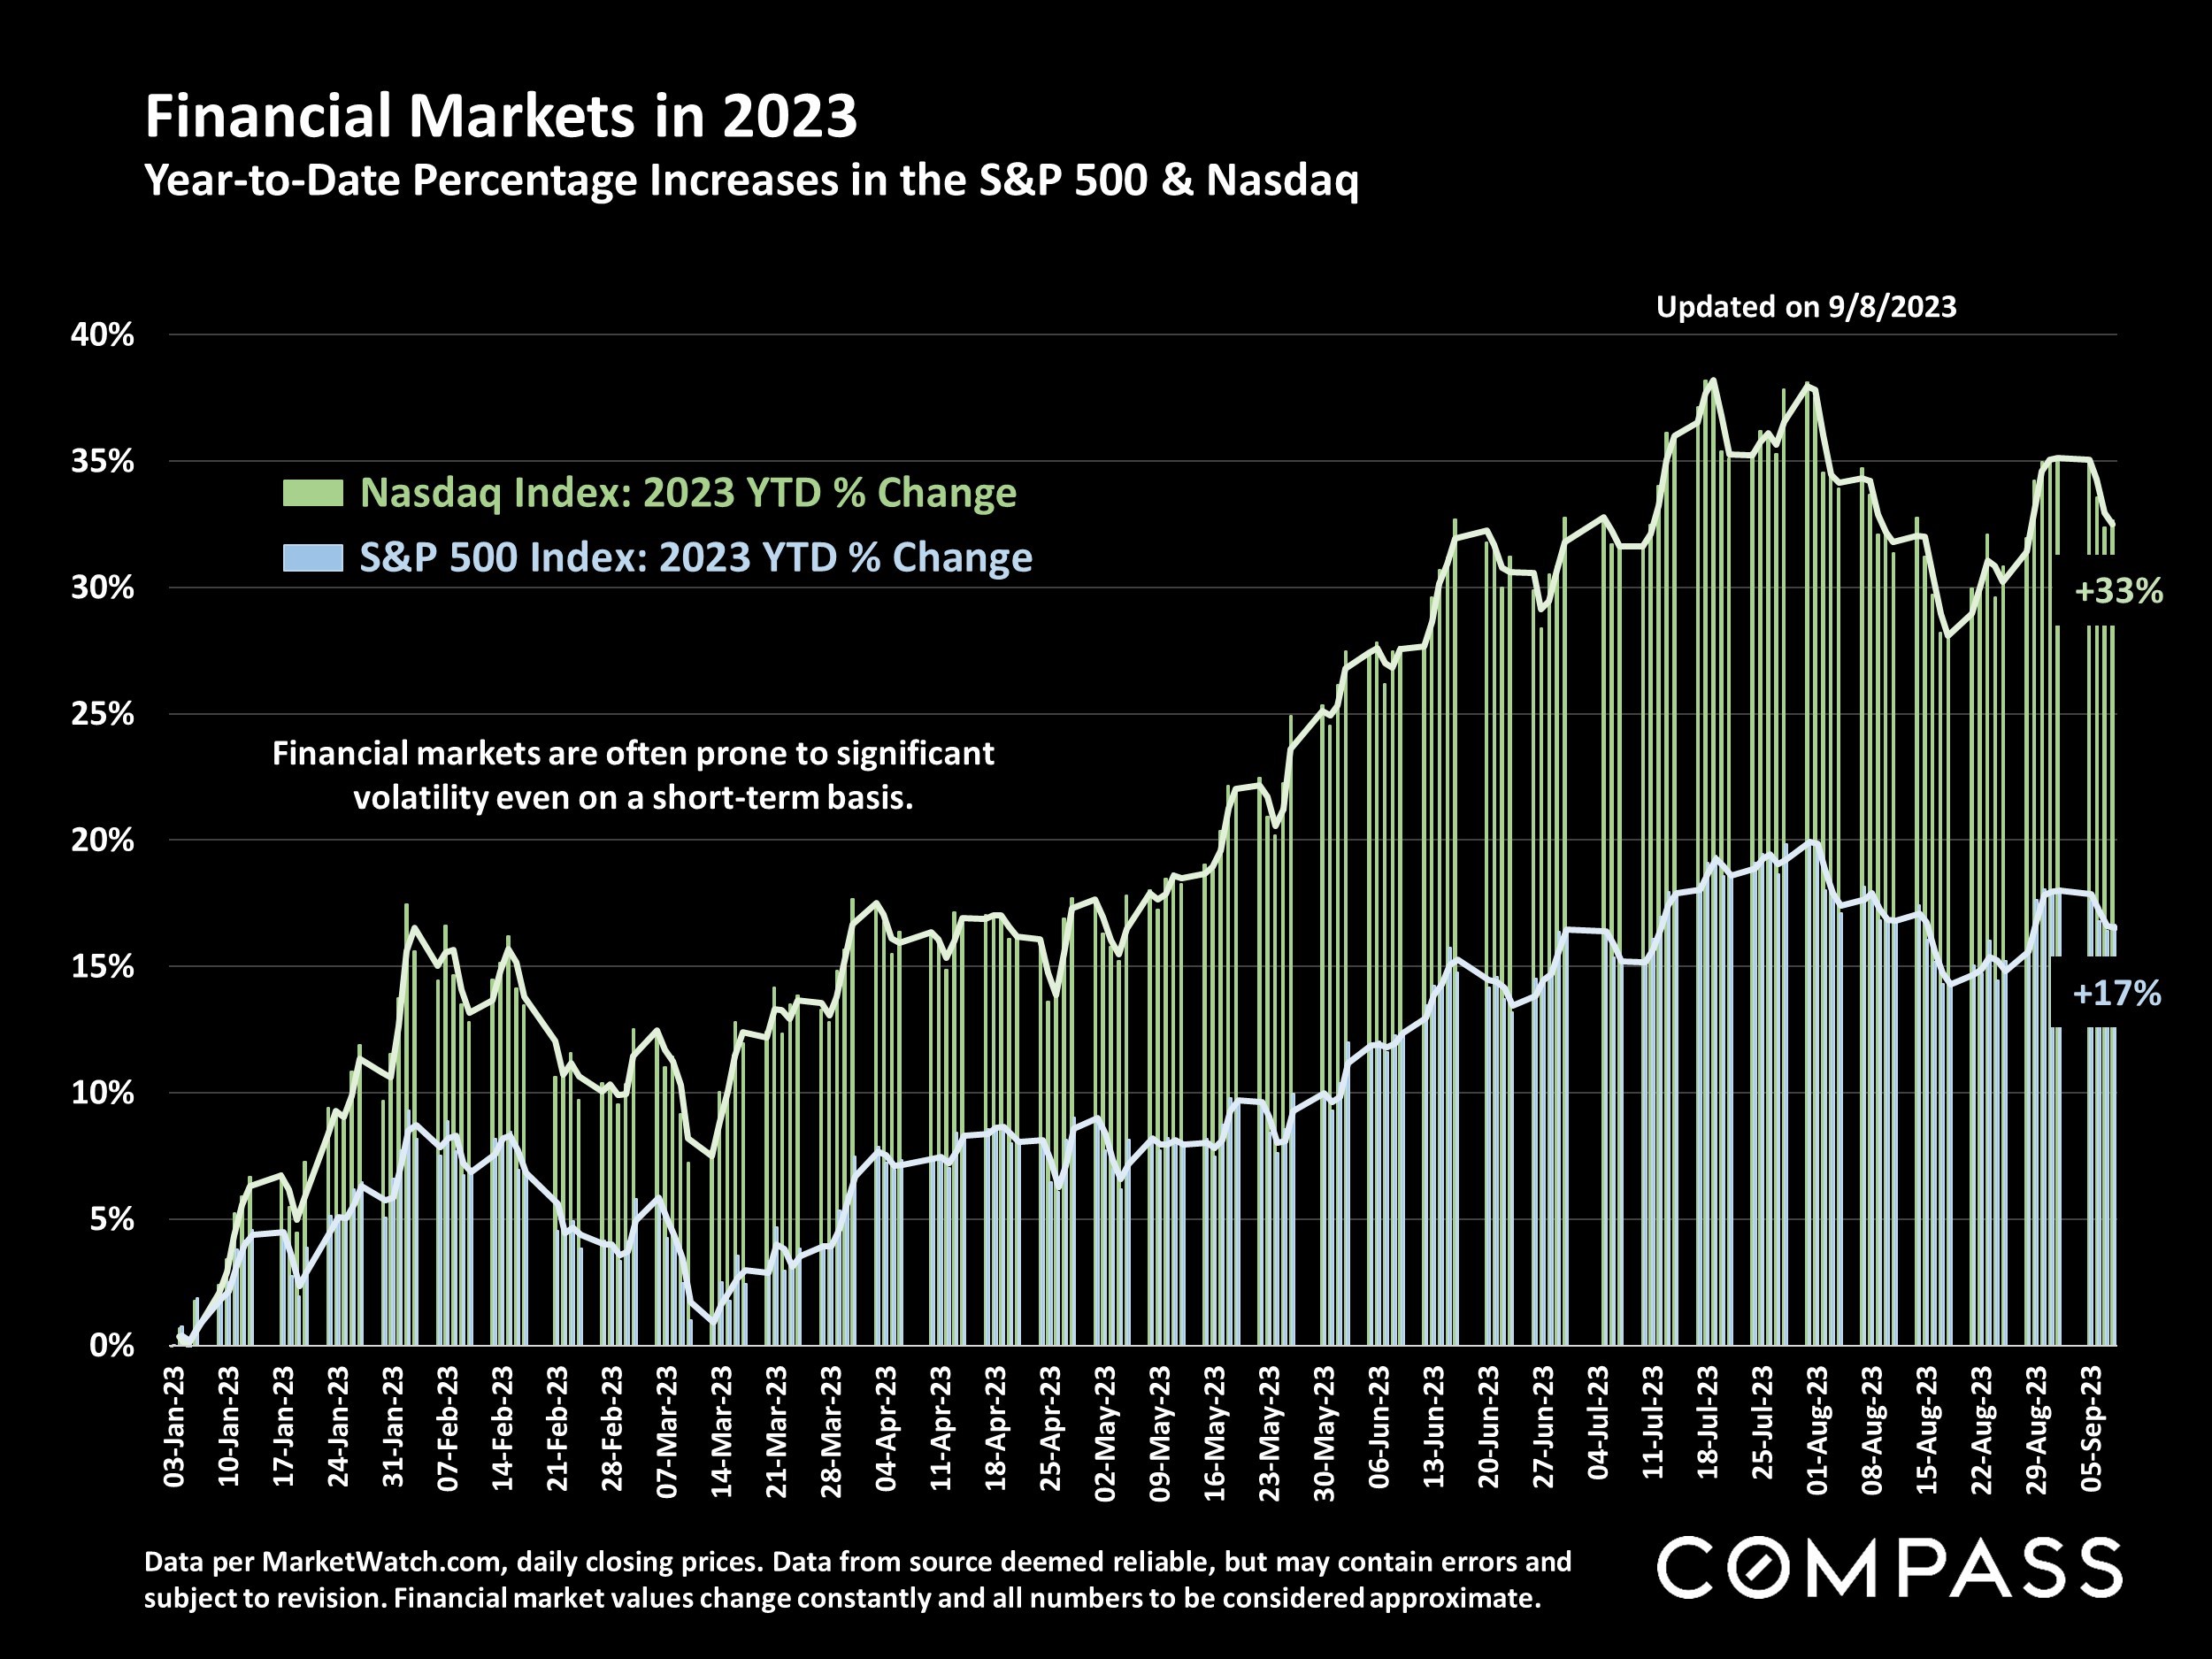
In August, the average, weekly, 30-year mortgage rate, as published by FHLMC, ticked back up over 7%, a situation that continues to significantly impact housing affordability. Perhaps in response, the percentage of buyers paying all cash has generally been running at its highest national level in 8 years. Stock markets were relatively volatile in August. 

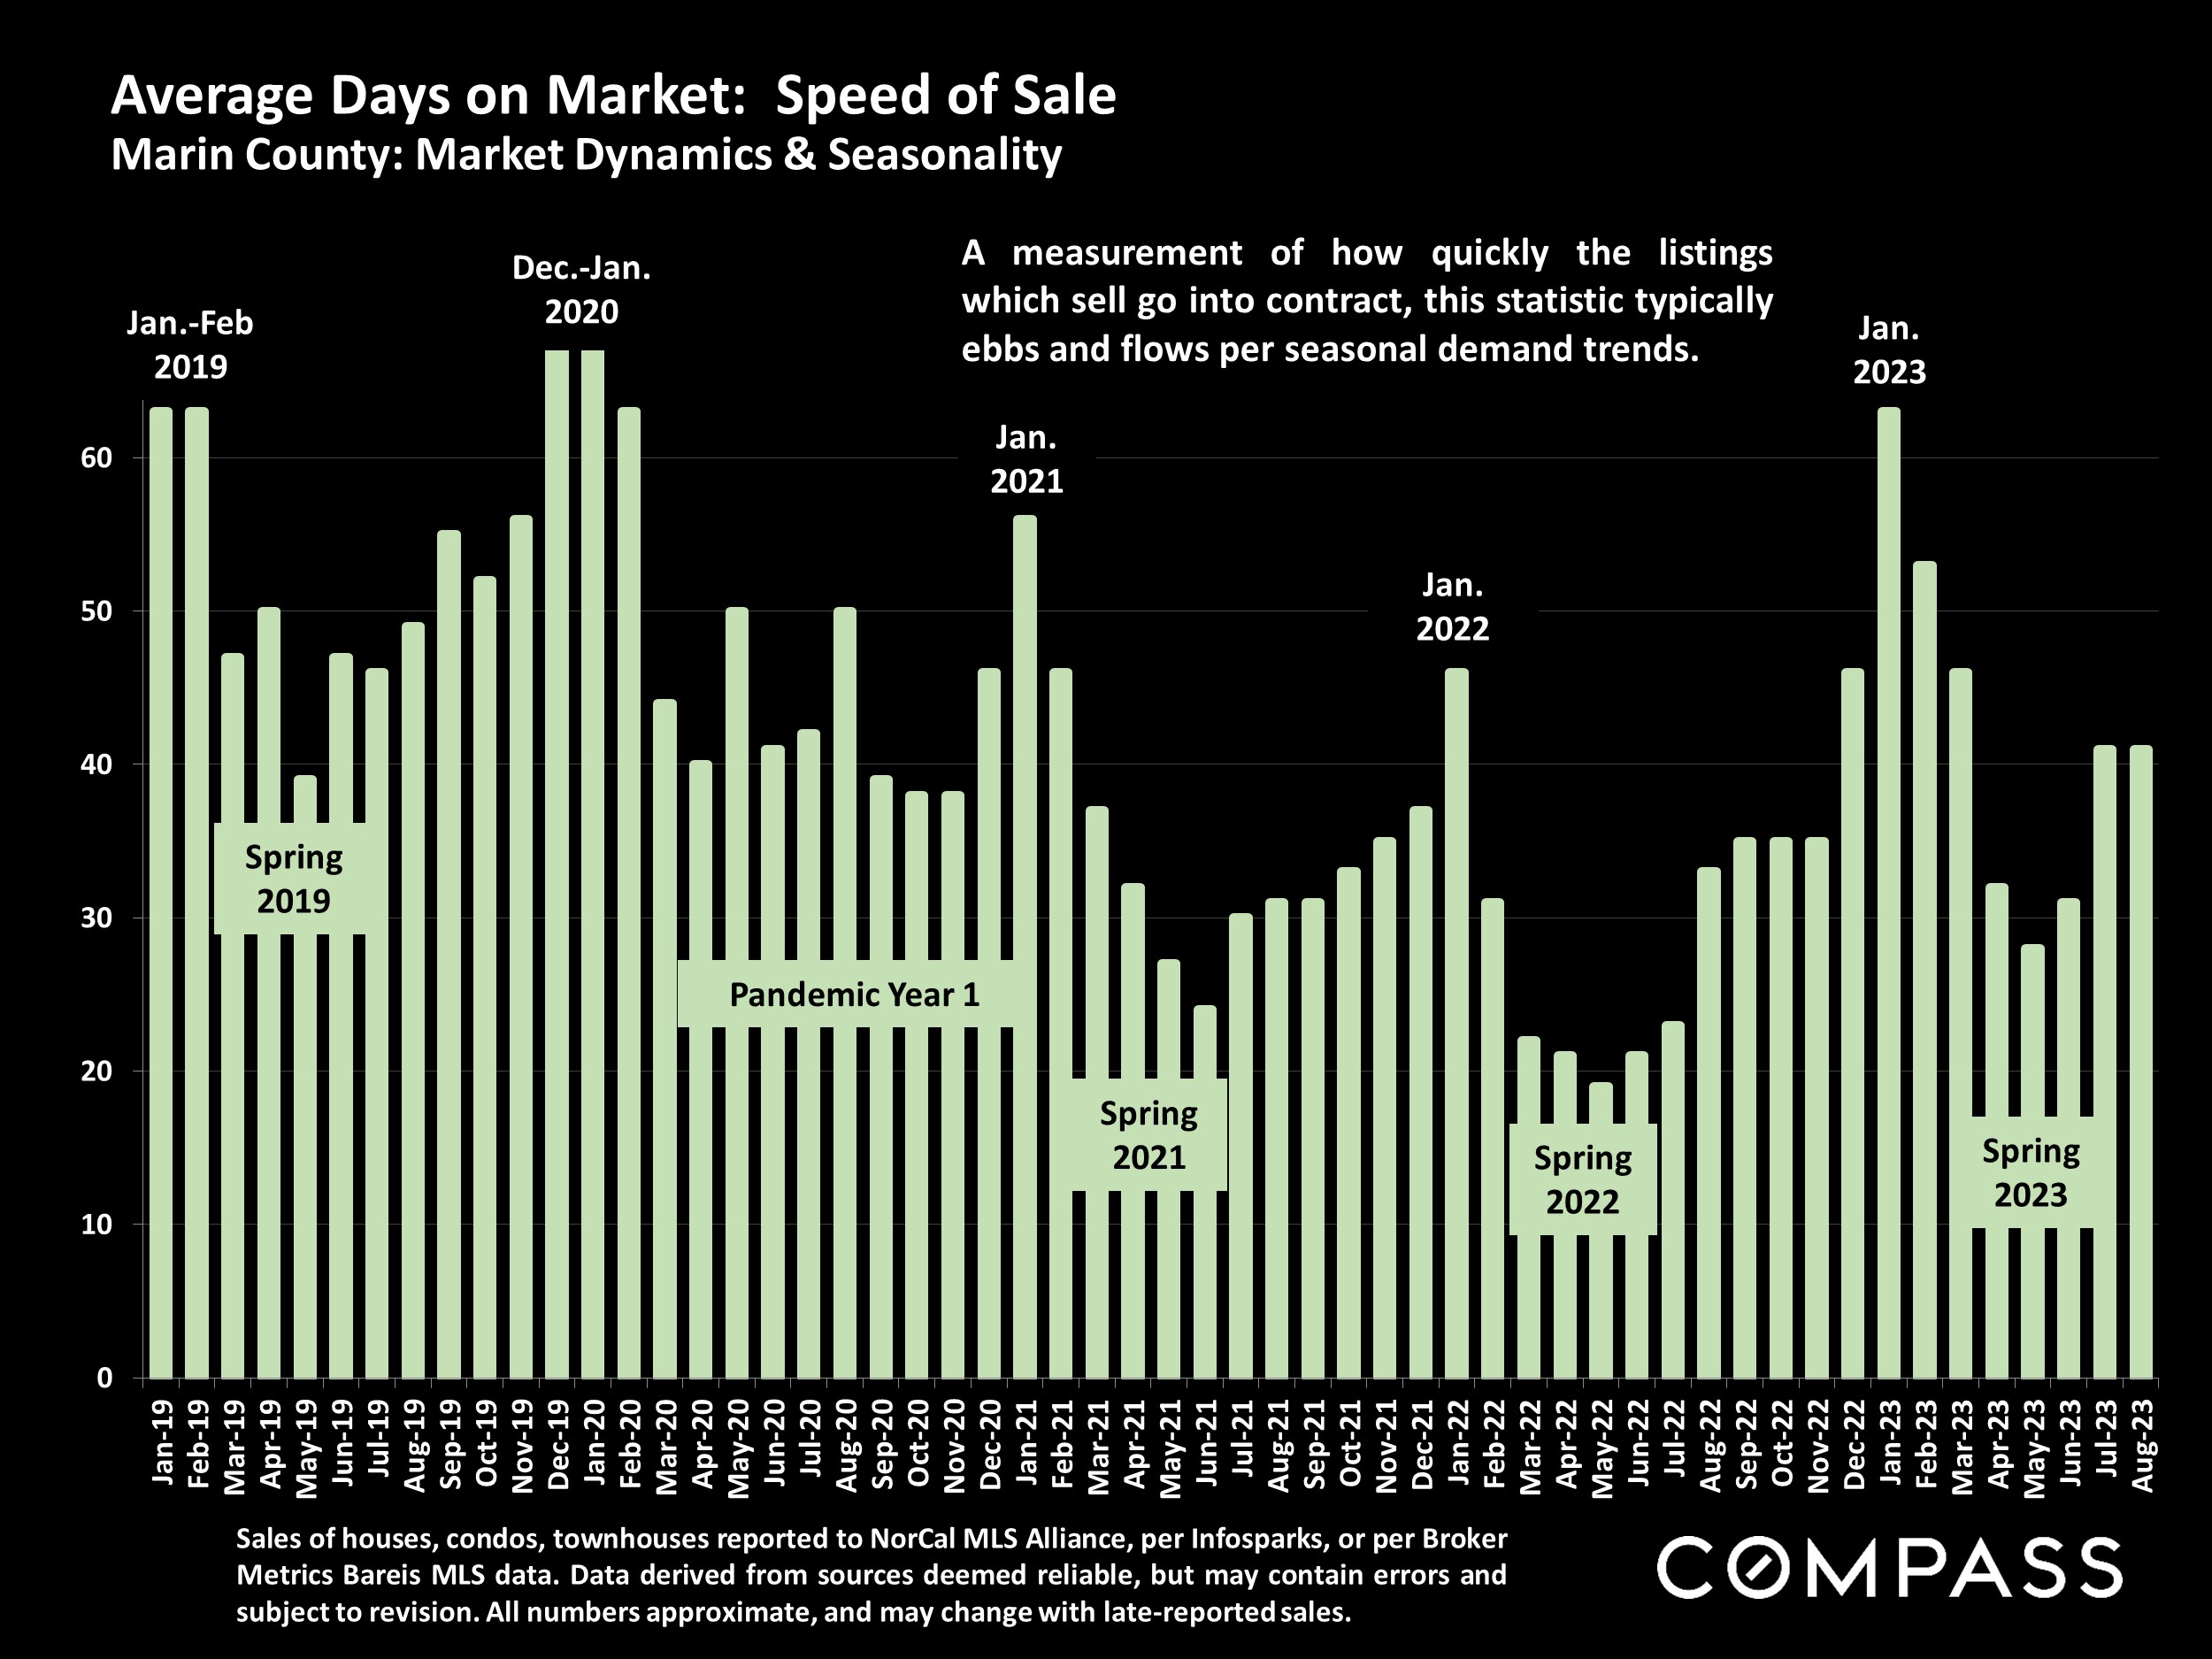
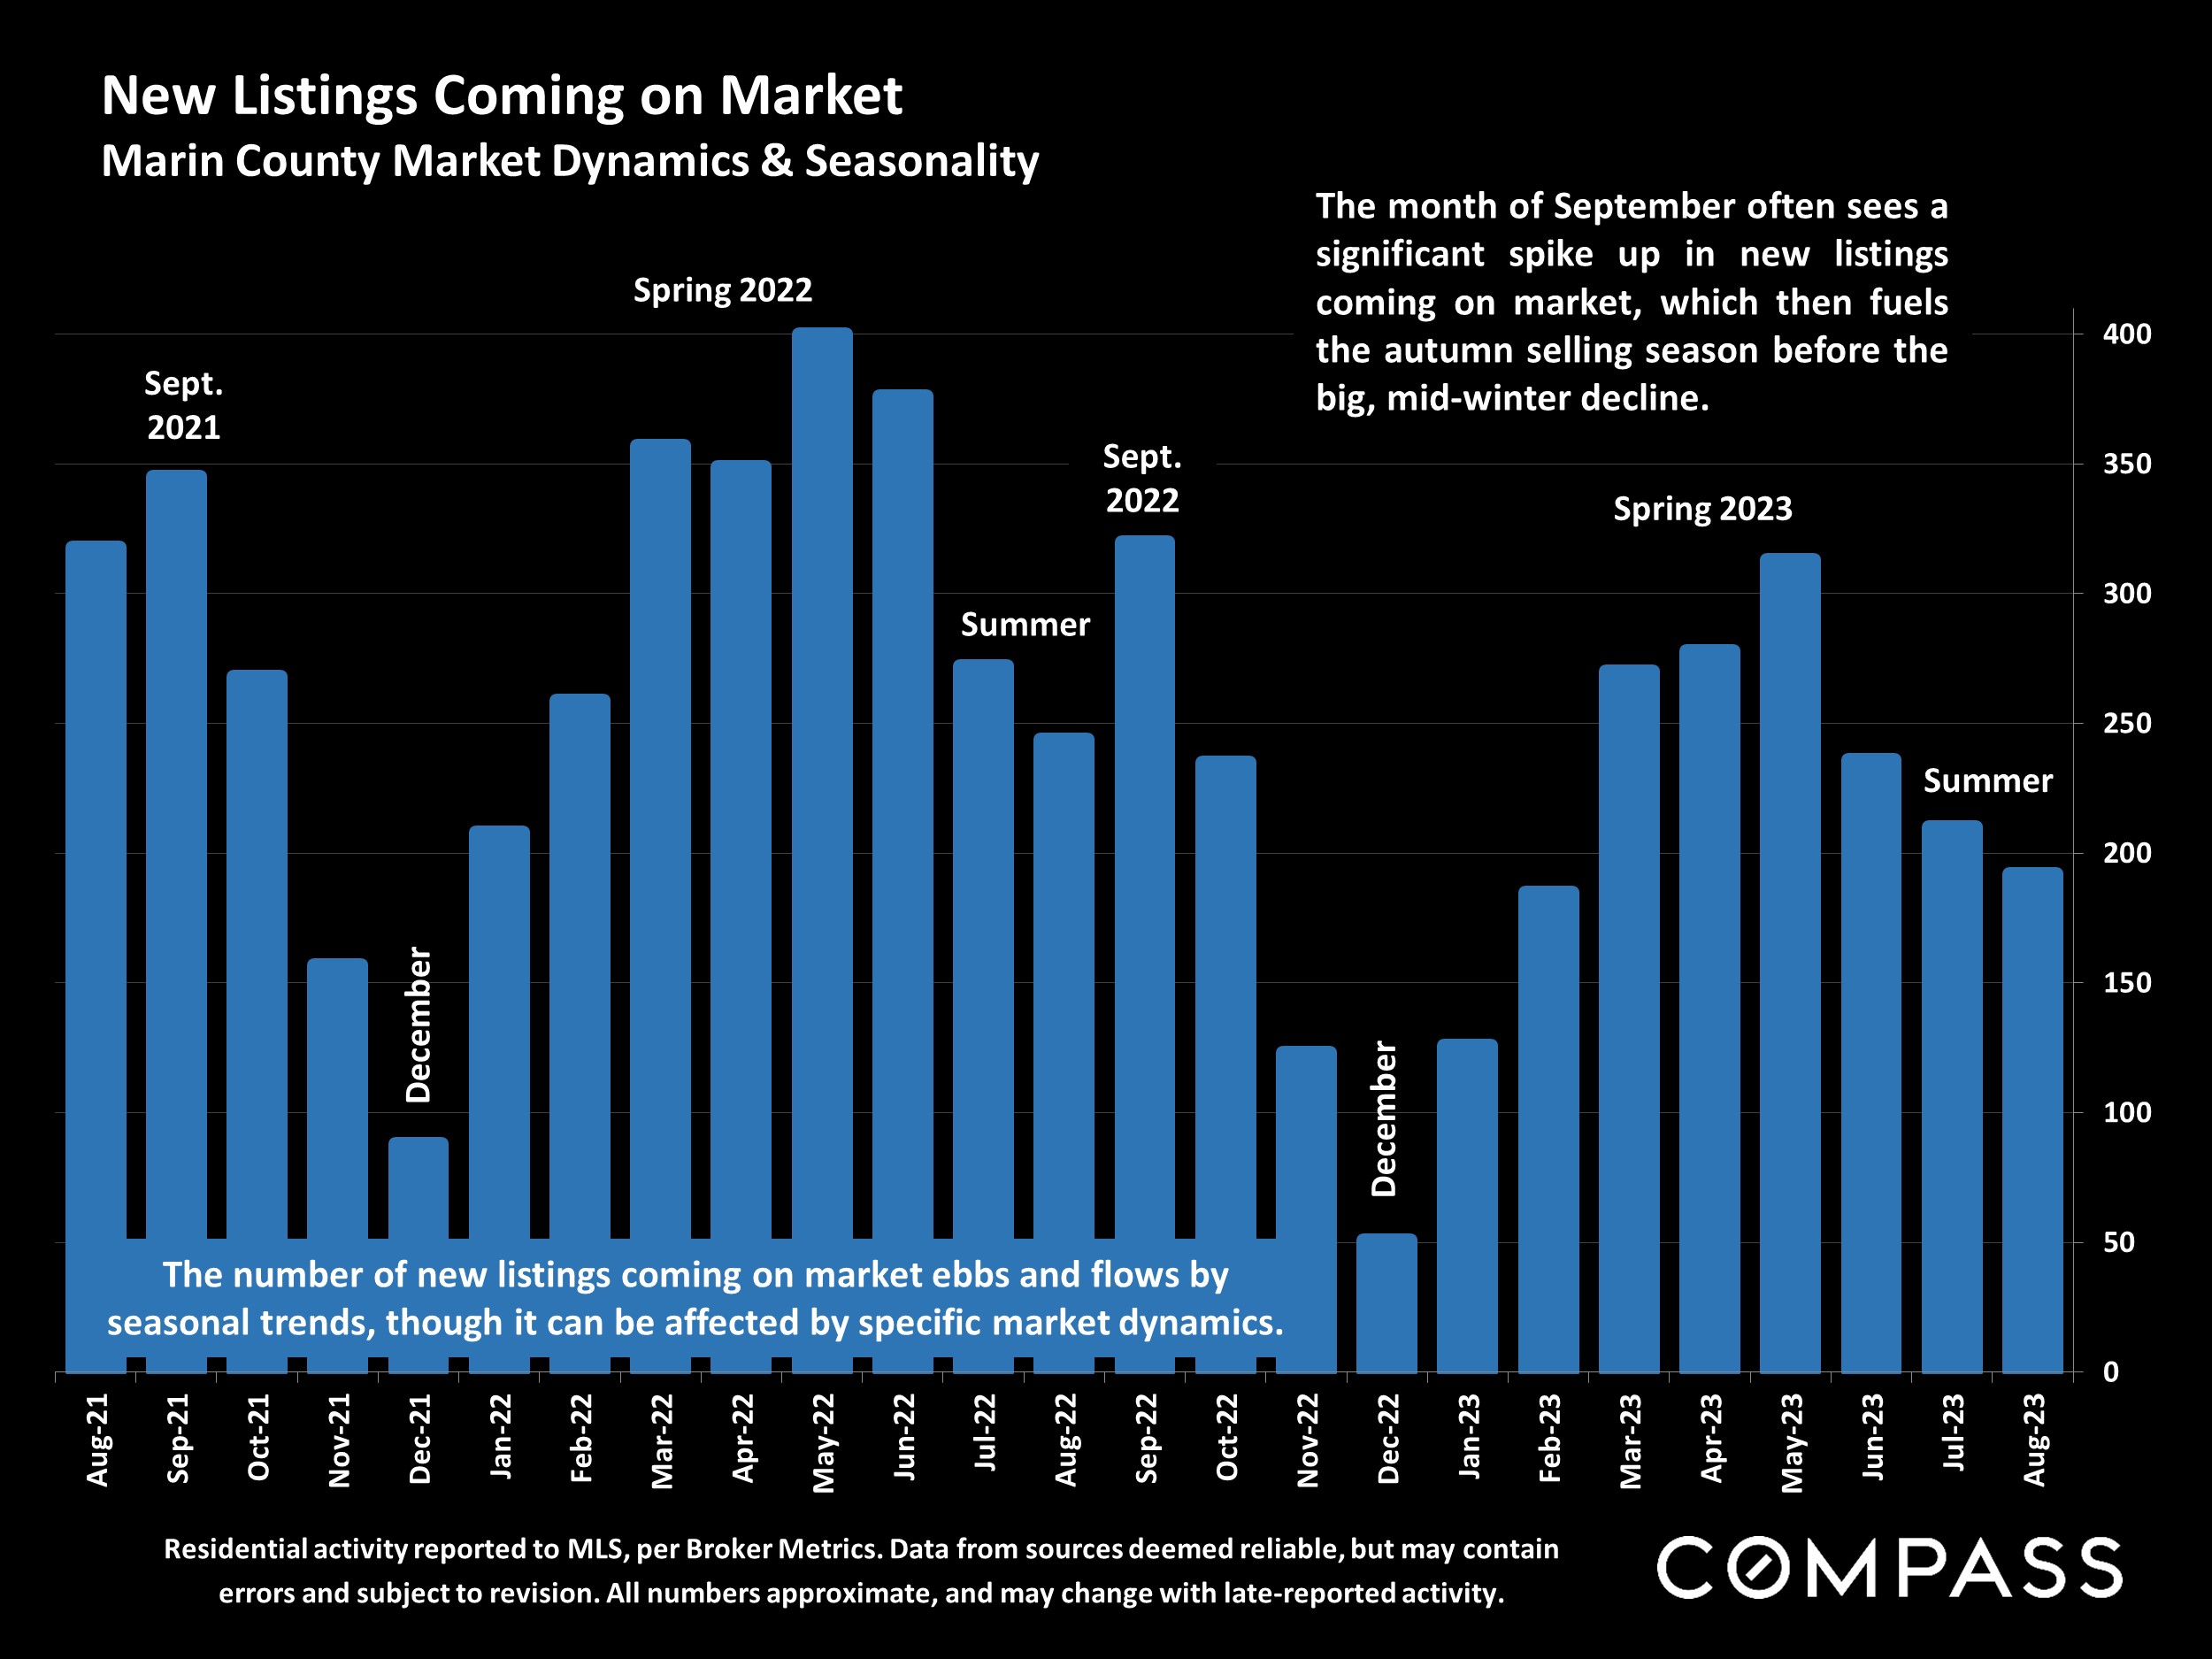
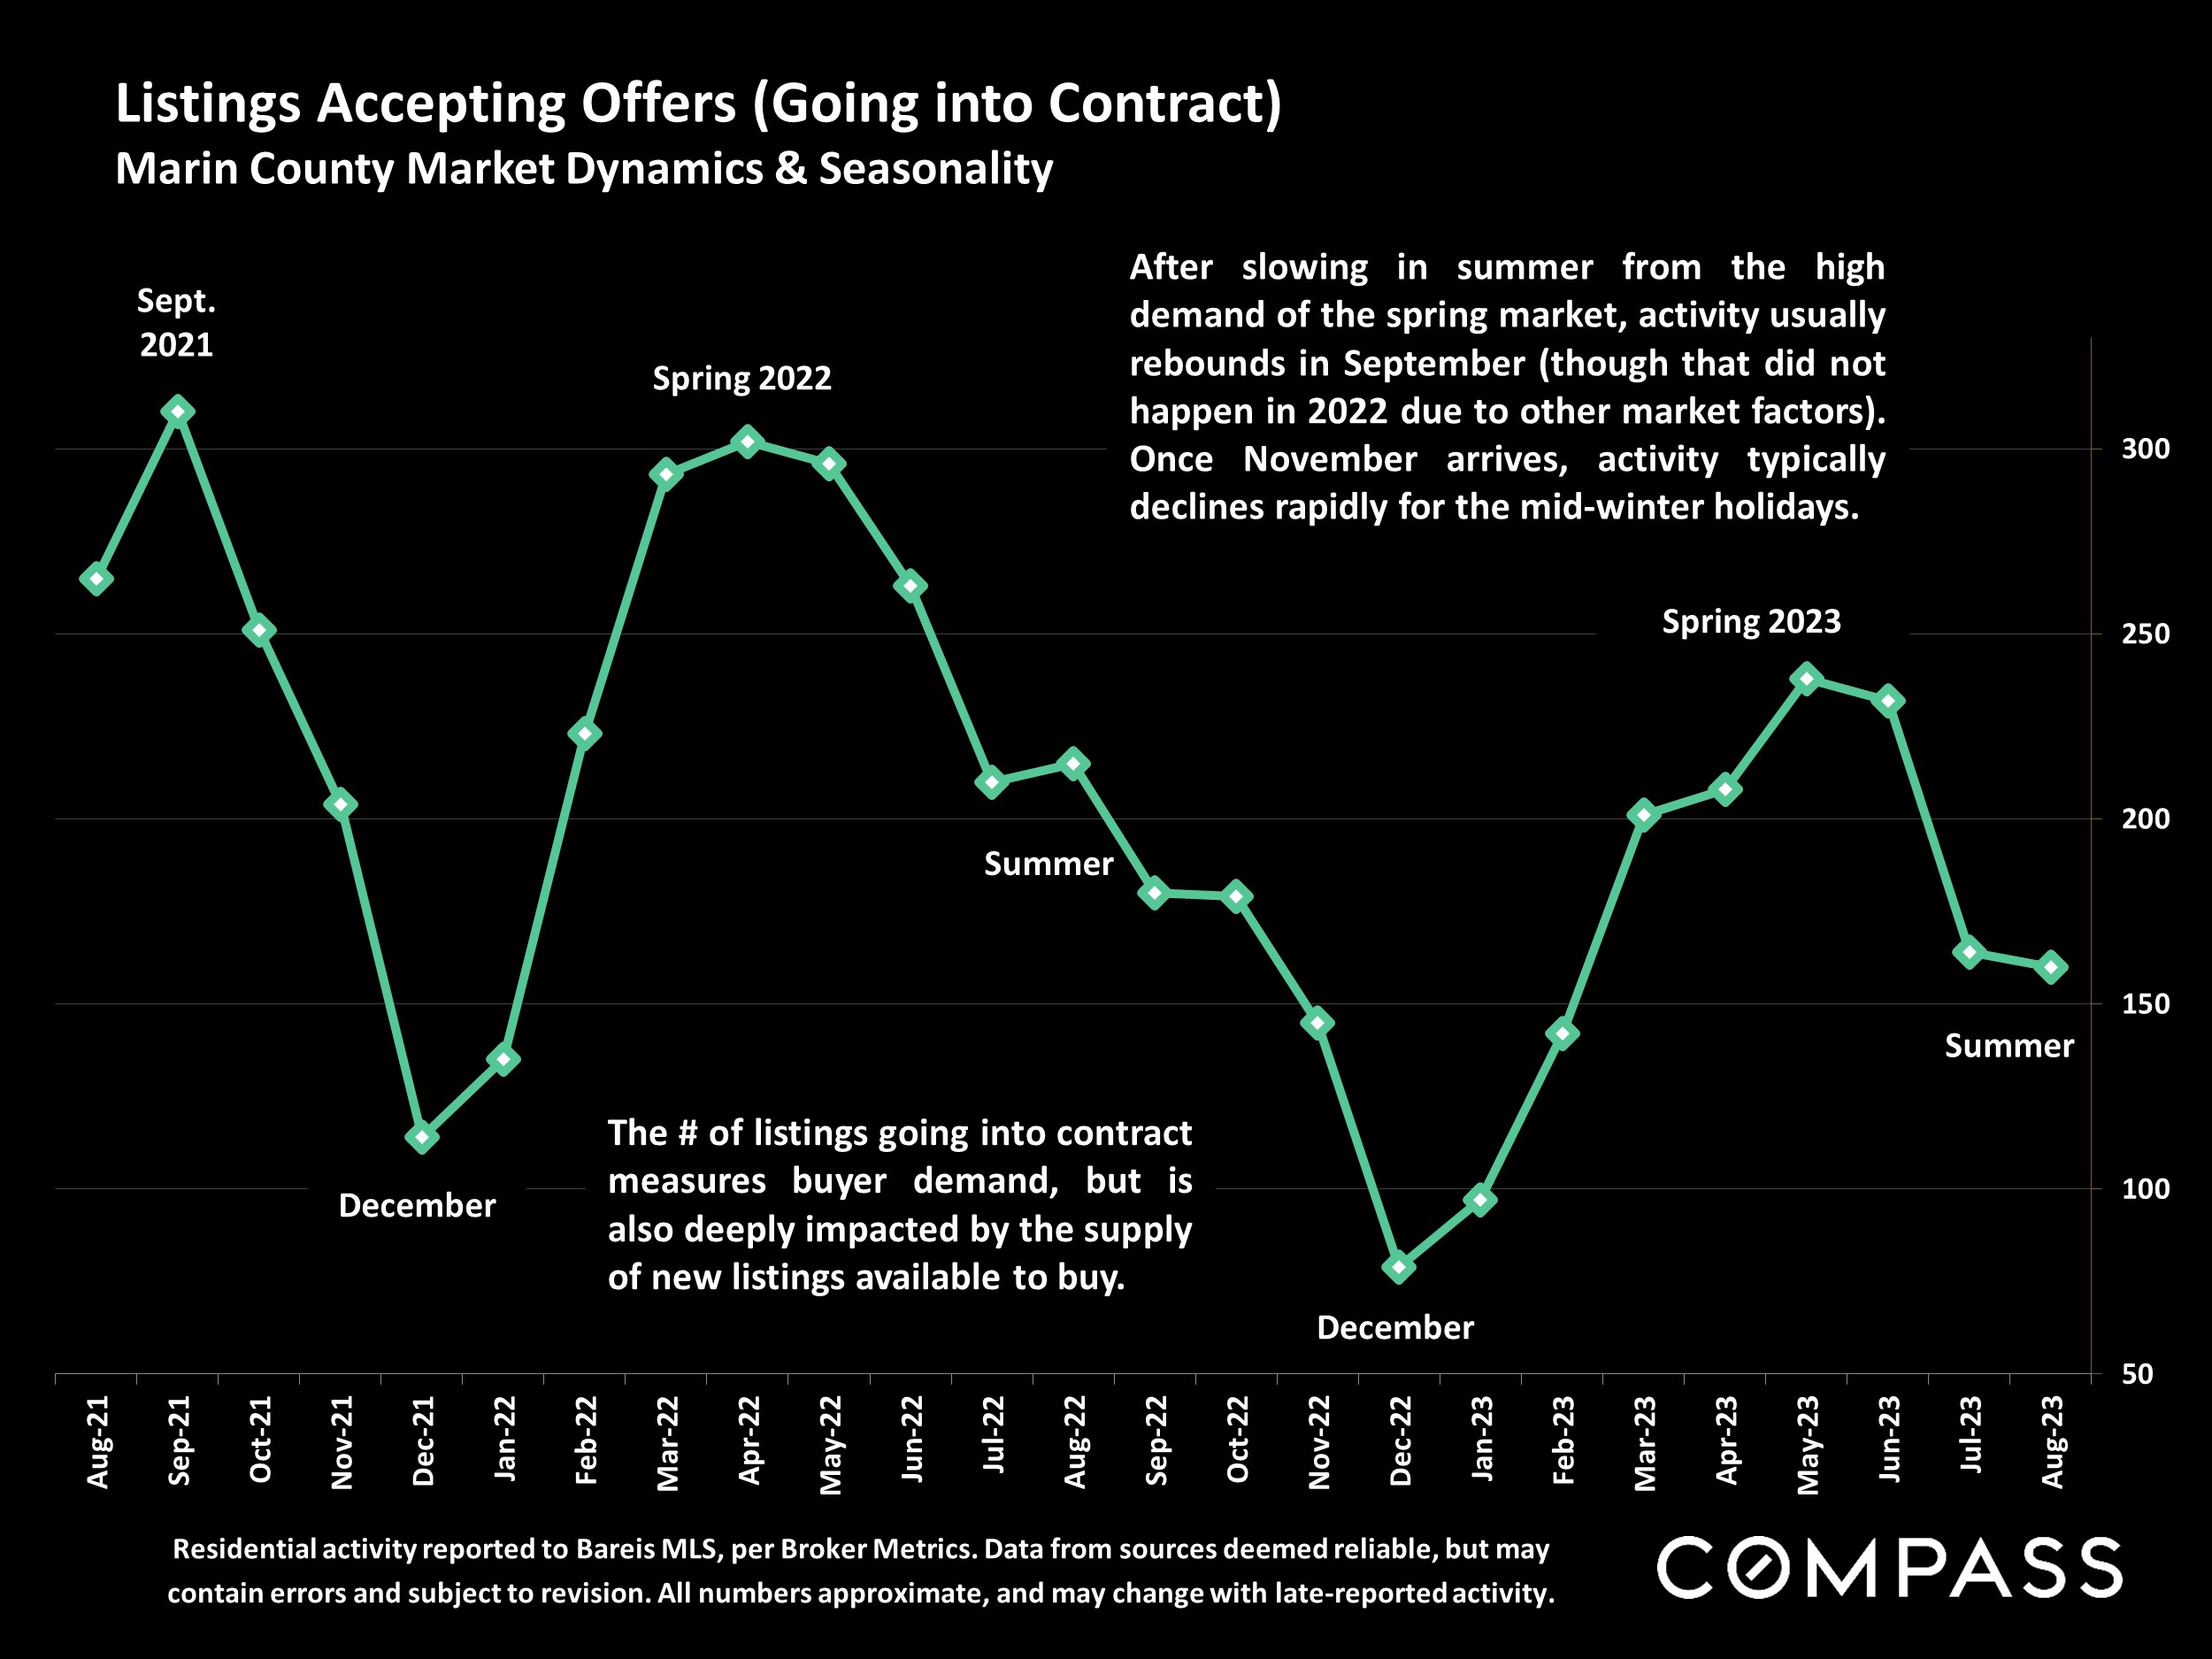
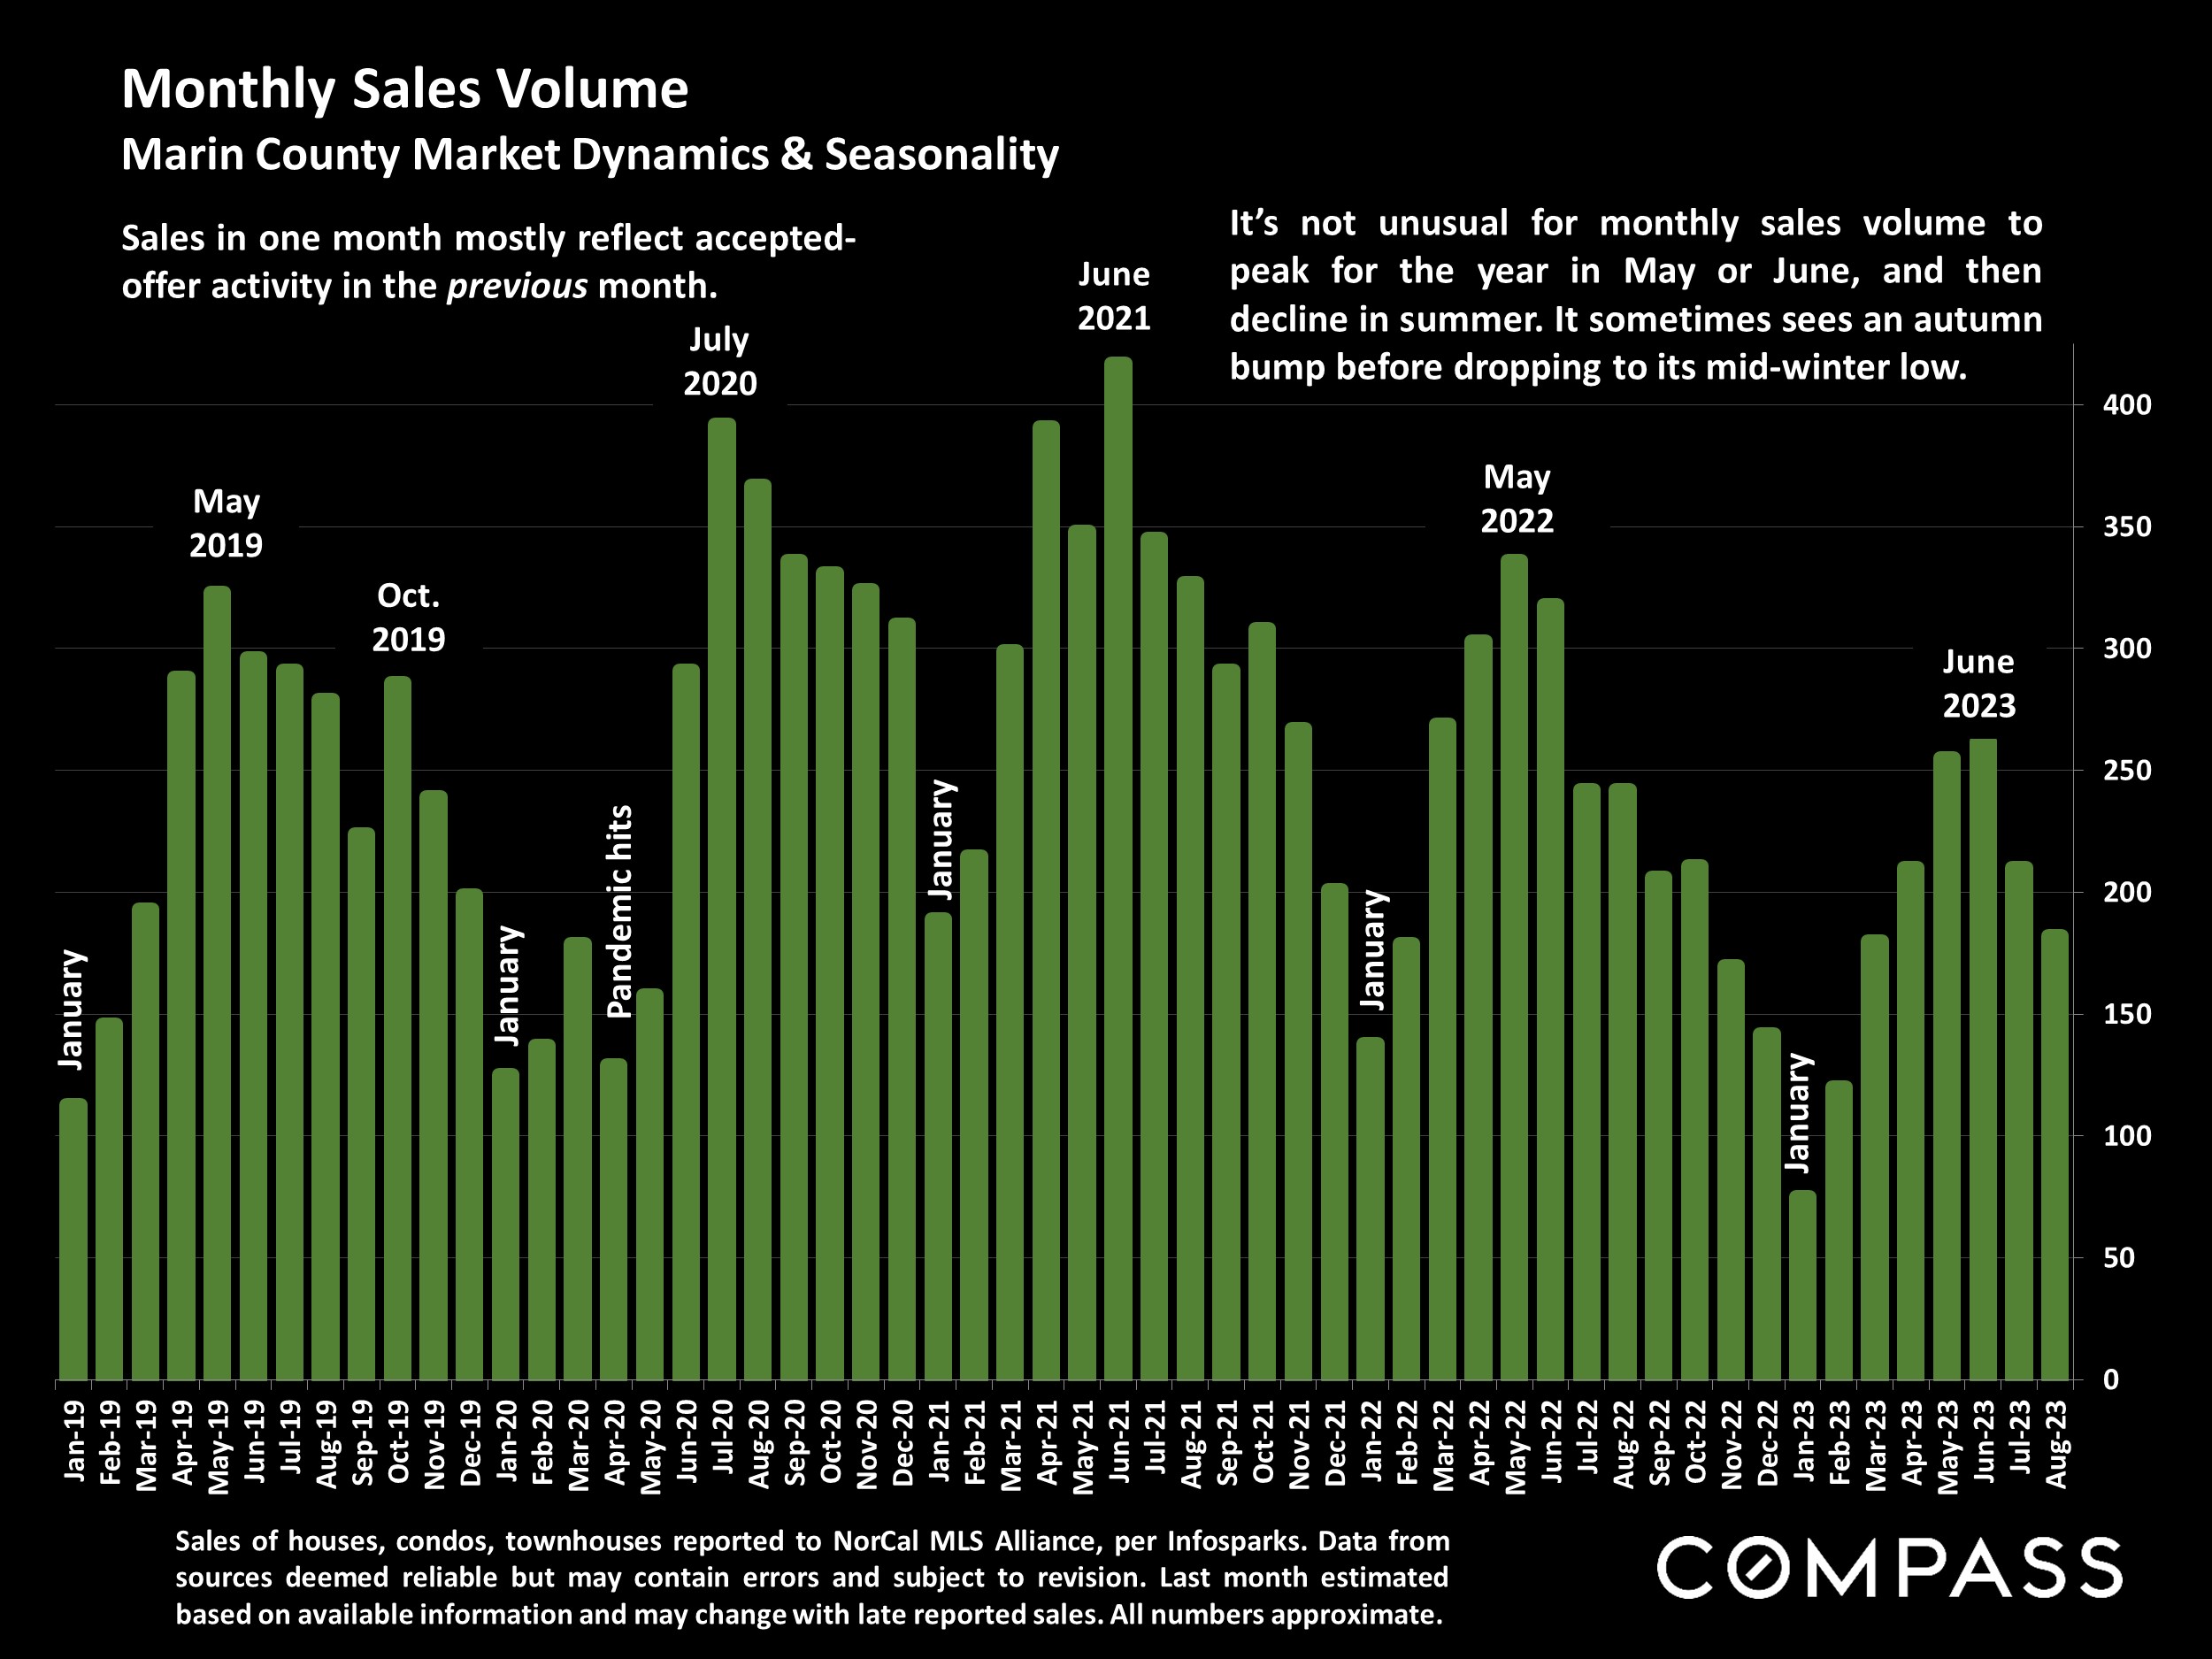
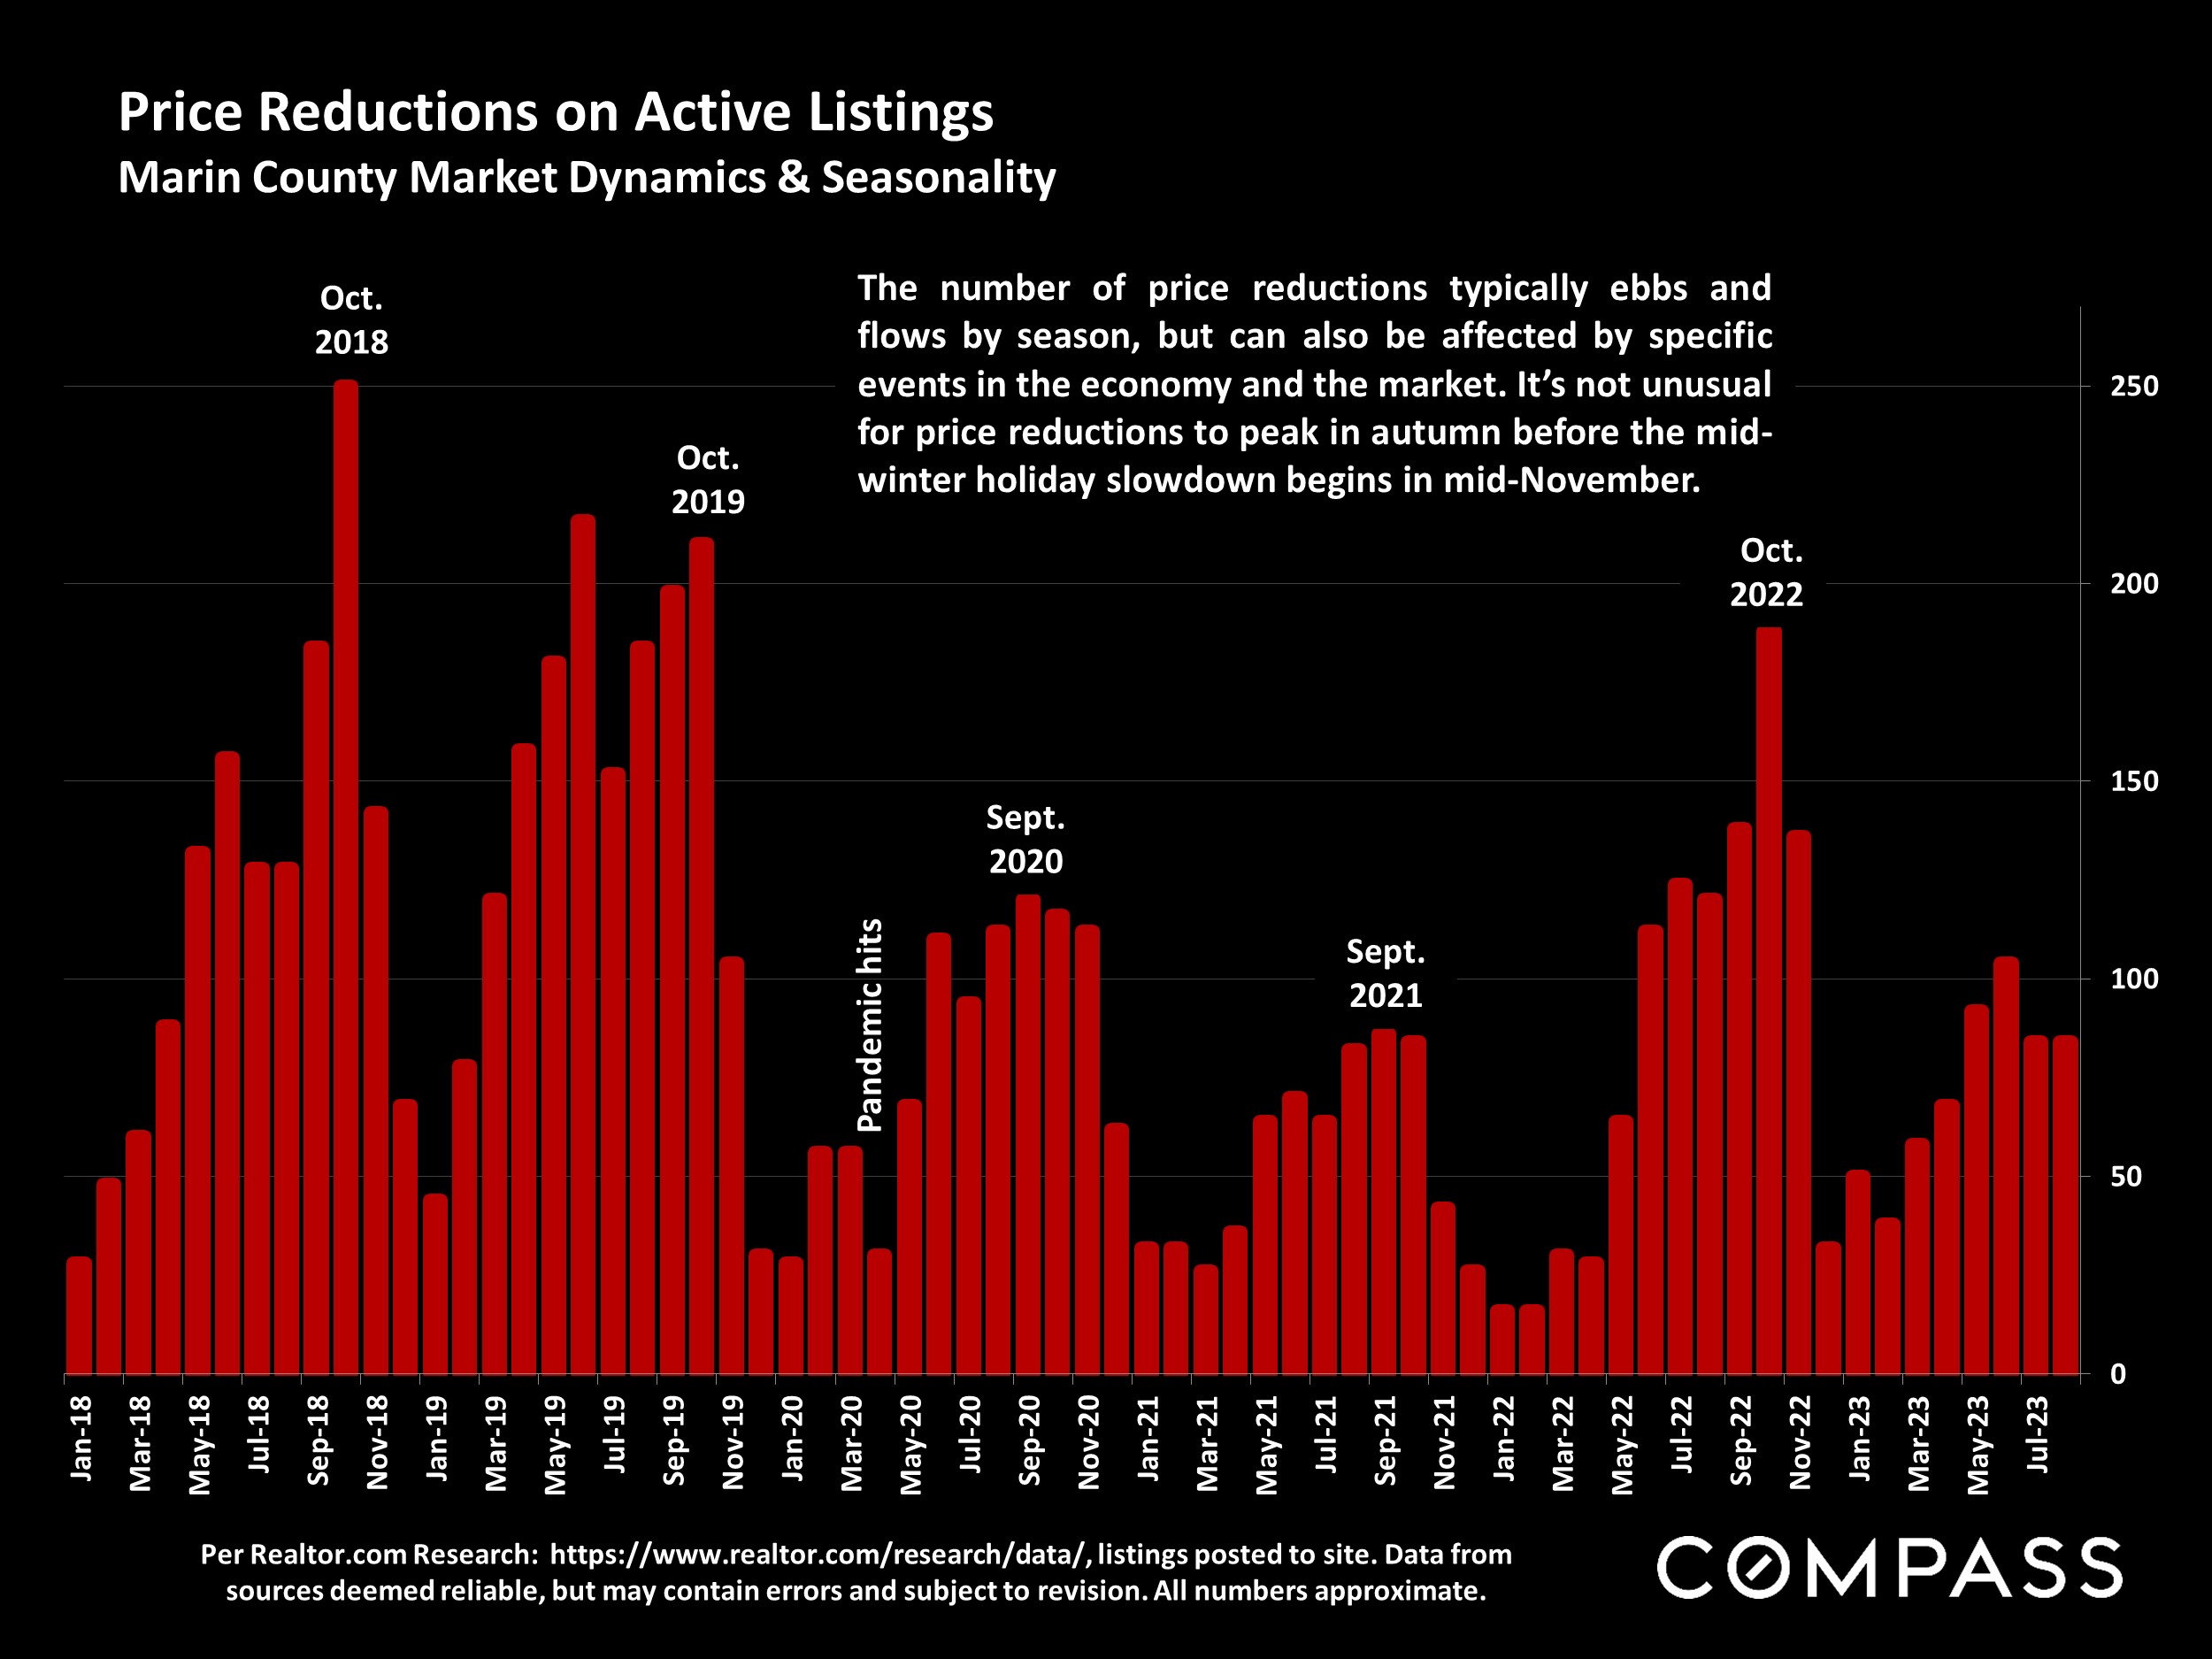
After the usual summer slowdown from spring, the autumn selling season began after Labor Day and runs until early-mid November, when the market typically begins its big, mid-winter holiday slowdown. By Thanksgiving, the number of new listings coming on the market has plummeted, and December commonly sees by far the lowest level of monthly sales activity, as defined by listings going into contract. 

In the meantime, we expect to see substantial activity this fall. September often sees a considerable jump in new listings coming on the market. 

Marin County Home Price Trends since 1990 Monthly Median House Sales Prices, 3-Month Rolling AverageMarin County House Value Trends since 2005 3-Month-Rolling Median Dollar per Square Foot Values*Marin County HOUSE Price Trends since 2005 Median House Sales Prices, 3-Month RollingMarin County House Price Appreciation Since 1995 Percentage Change, 3-Month-Rolling, Median Sales Price*Marin County Condo Price Trends since 2005 3-Month Rolling Median Condo Sales PricesMarin County House Market 6 Months House Sales by Price Segment*Marin County: Homes for Sale Active/Coming-Soon Listings*Average Days on Market: Speed of Sale Marin County: Market Dynamics & SeasonalityOverbidding List Prices in Marin County Percentage of Home Sales Closing over List Price, since 2018Average Sales Price to Original List Price Percentage Marin County Over/Under Bidding: Market Dynamics & SeasonalityNew Listings Coming on Market Marin County Market Dynamics & SeasonalityActive Listings on Market – Longer-Term Trends Marin County Market Dynamics & SeasonalityListings Accepting Offers (Going into Contract) Marin County Market Dynamics & SeasonalityMonthly Sales Volume Marin County Market Dynamics & SeasonalityMarin County Luxury Home Sales by Month Homes Selling for $4 Million+ & $6.5 Million+ since 2020Months Supply of Inventory (MSI) – of Active Listings on Market Marin County Real Estate Market since 2018, 3-Month Rolling AveragePrice Reductions on Active Listings Marin County Market Dynamics & SeasonalityMarin County: Not Every Home Sells Listings Taken Off Market Without Selling.S.Percentageo fAll-CashBuyers NationalMarketDynamicssince2015*MortgageInterestRates,2022- 2023YTD 30-YearConformingFixed-RateLoans,WeeklyAverageReadings PerFreddieMac(FHLMC),onSeptember7 , 2023,t h eweeklyaverage,30-yearinterest ratetickeddownt o7.12%.(For15-year loans,t h eratewas6.52%.) June 2022FinancialMarketsi n2023 Year-to-DatePercentageIncreasesi nt h eS & P5 0 0& Nasdaq

Want to learn more about Bay Area market trends?

Let’s connect! With relationships and networks across the city, there are a variety of ways I can help you make informed real estate decisions. Call, email, or text – I’m here to help.


Contact