Feature image for SF: April 2024 Market Stats

April 12, 2024

SF: April 2024 Market Stats

By Compass


Q2 May See the Hottest Market

Since the Peak of the Pandemic Boom

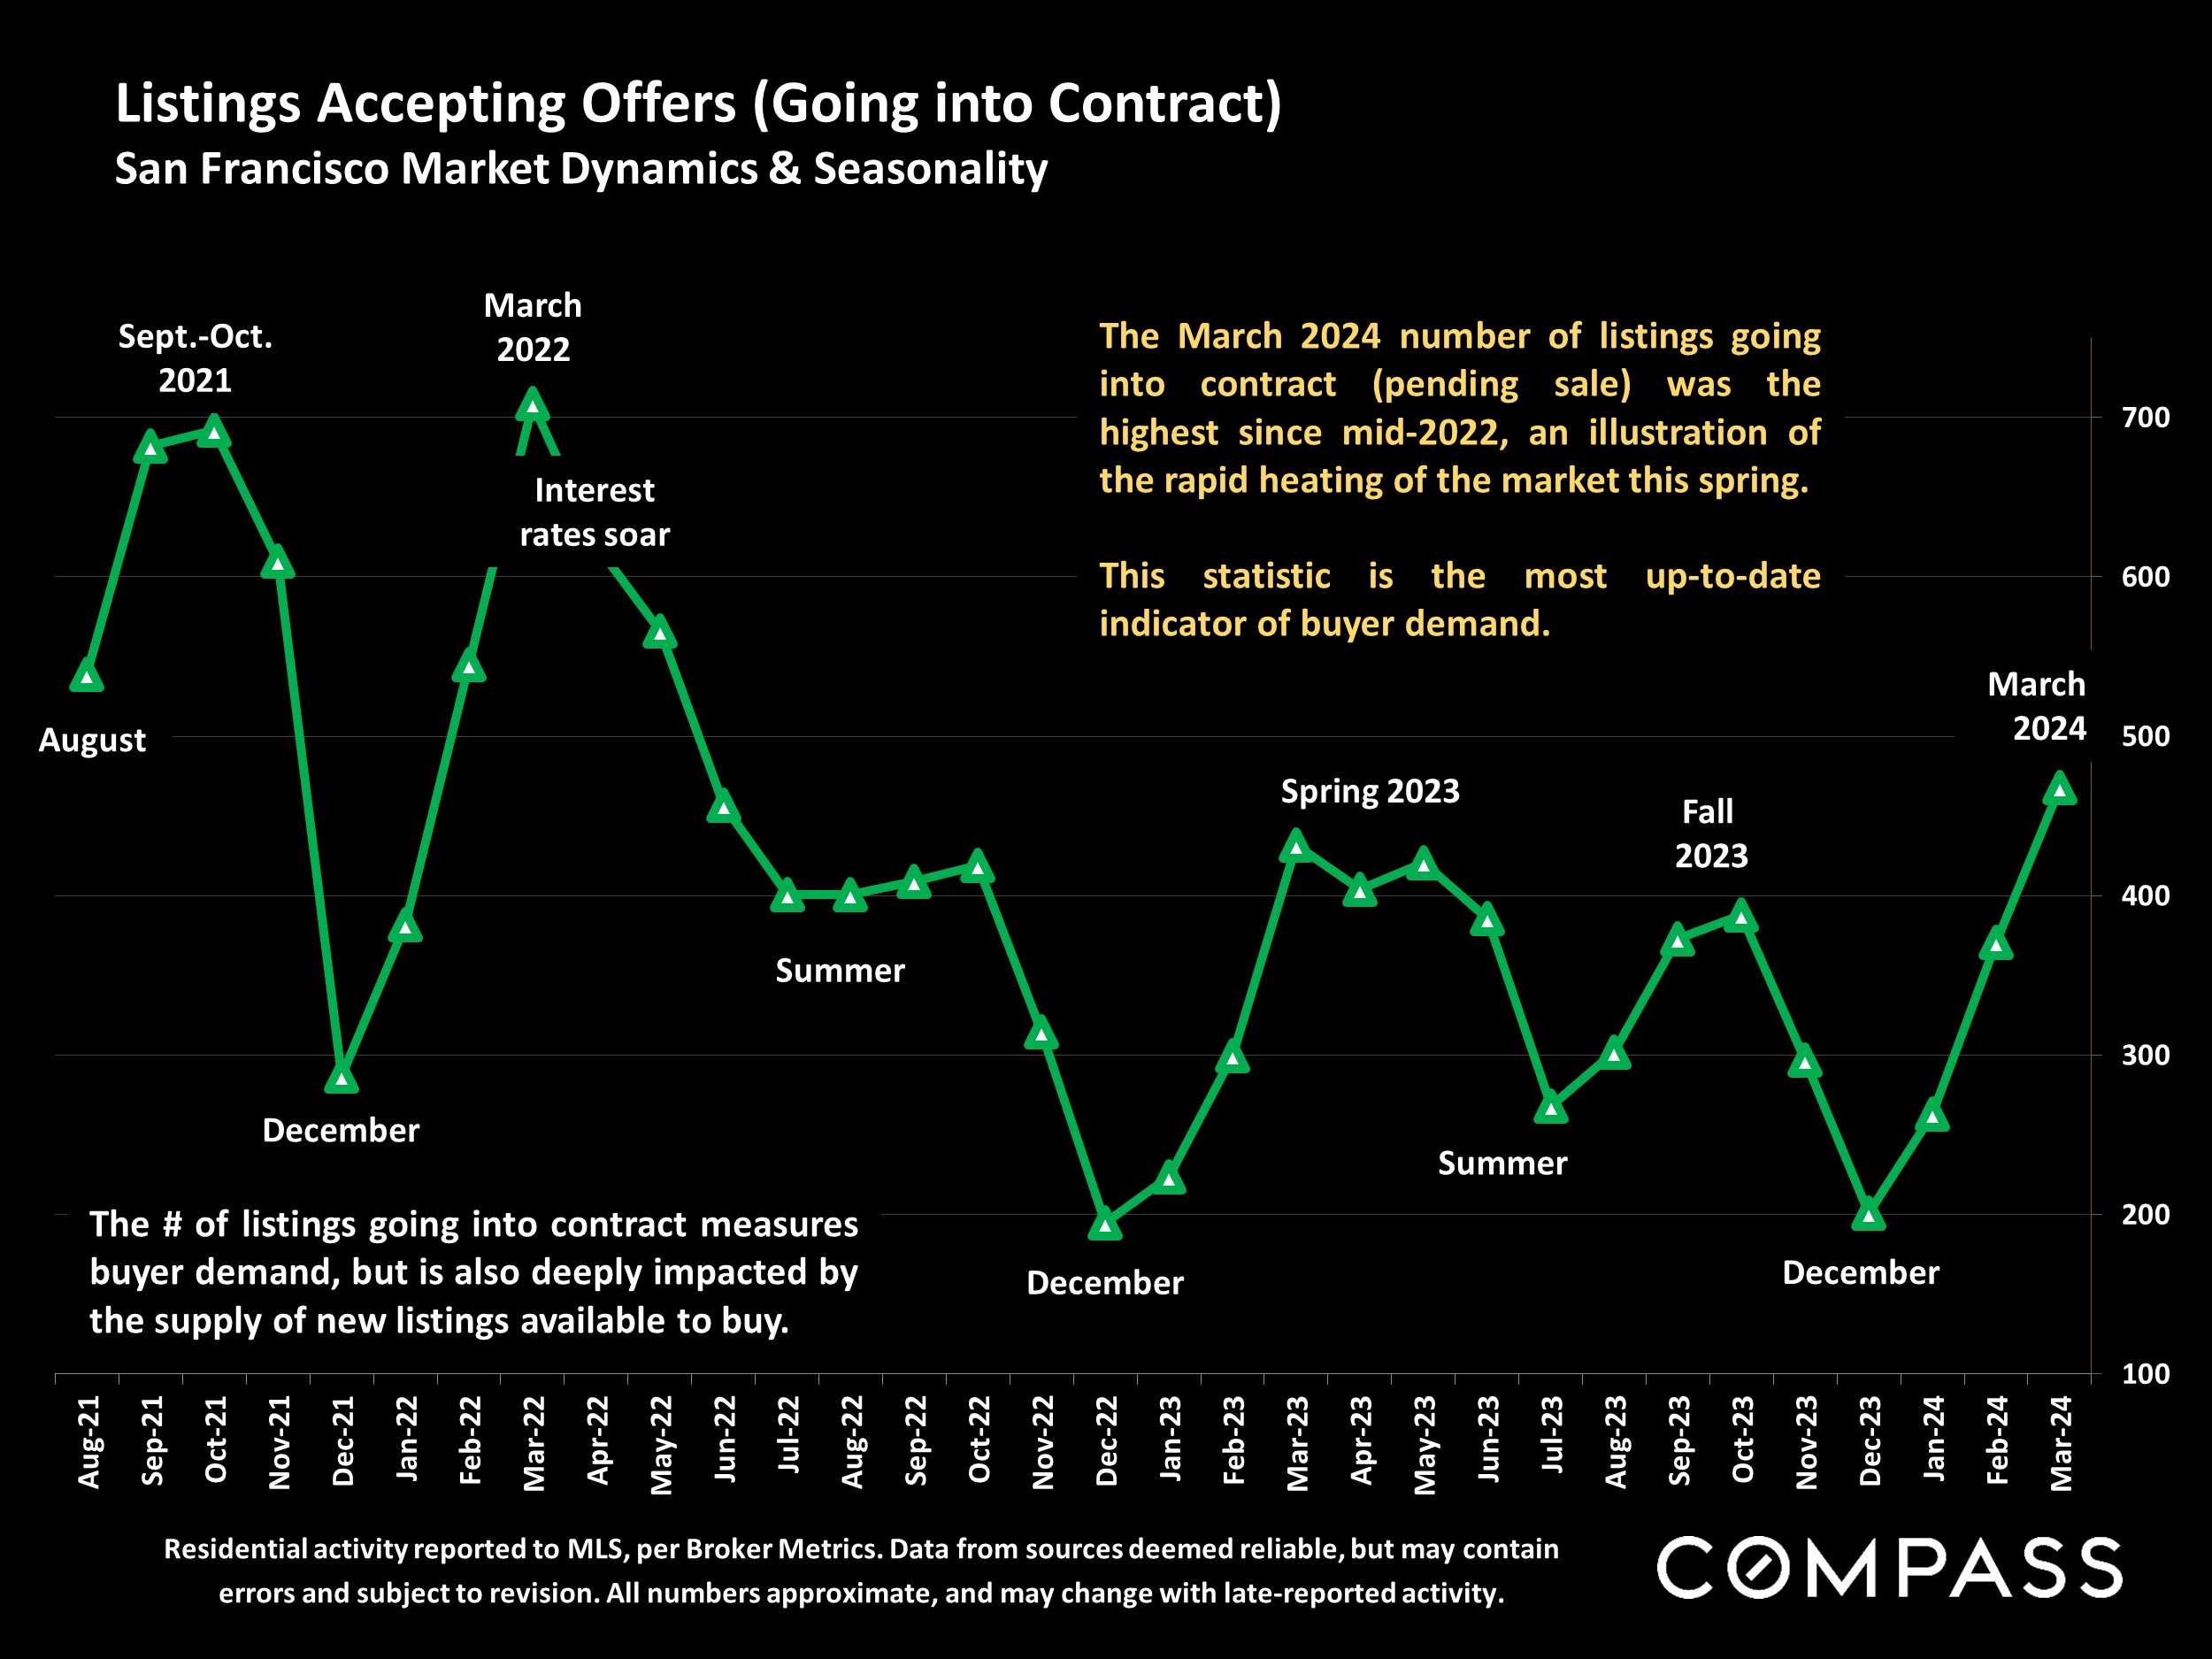
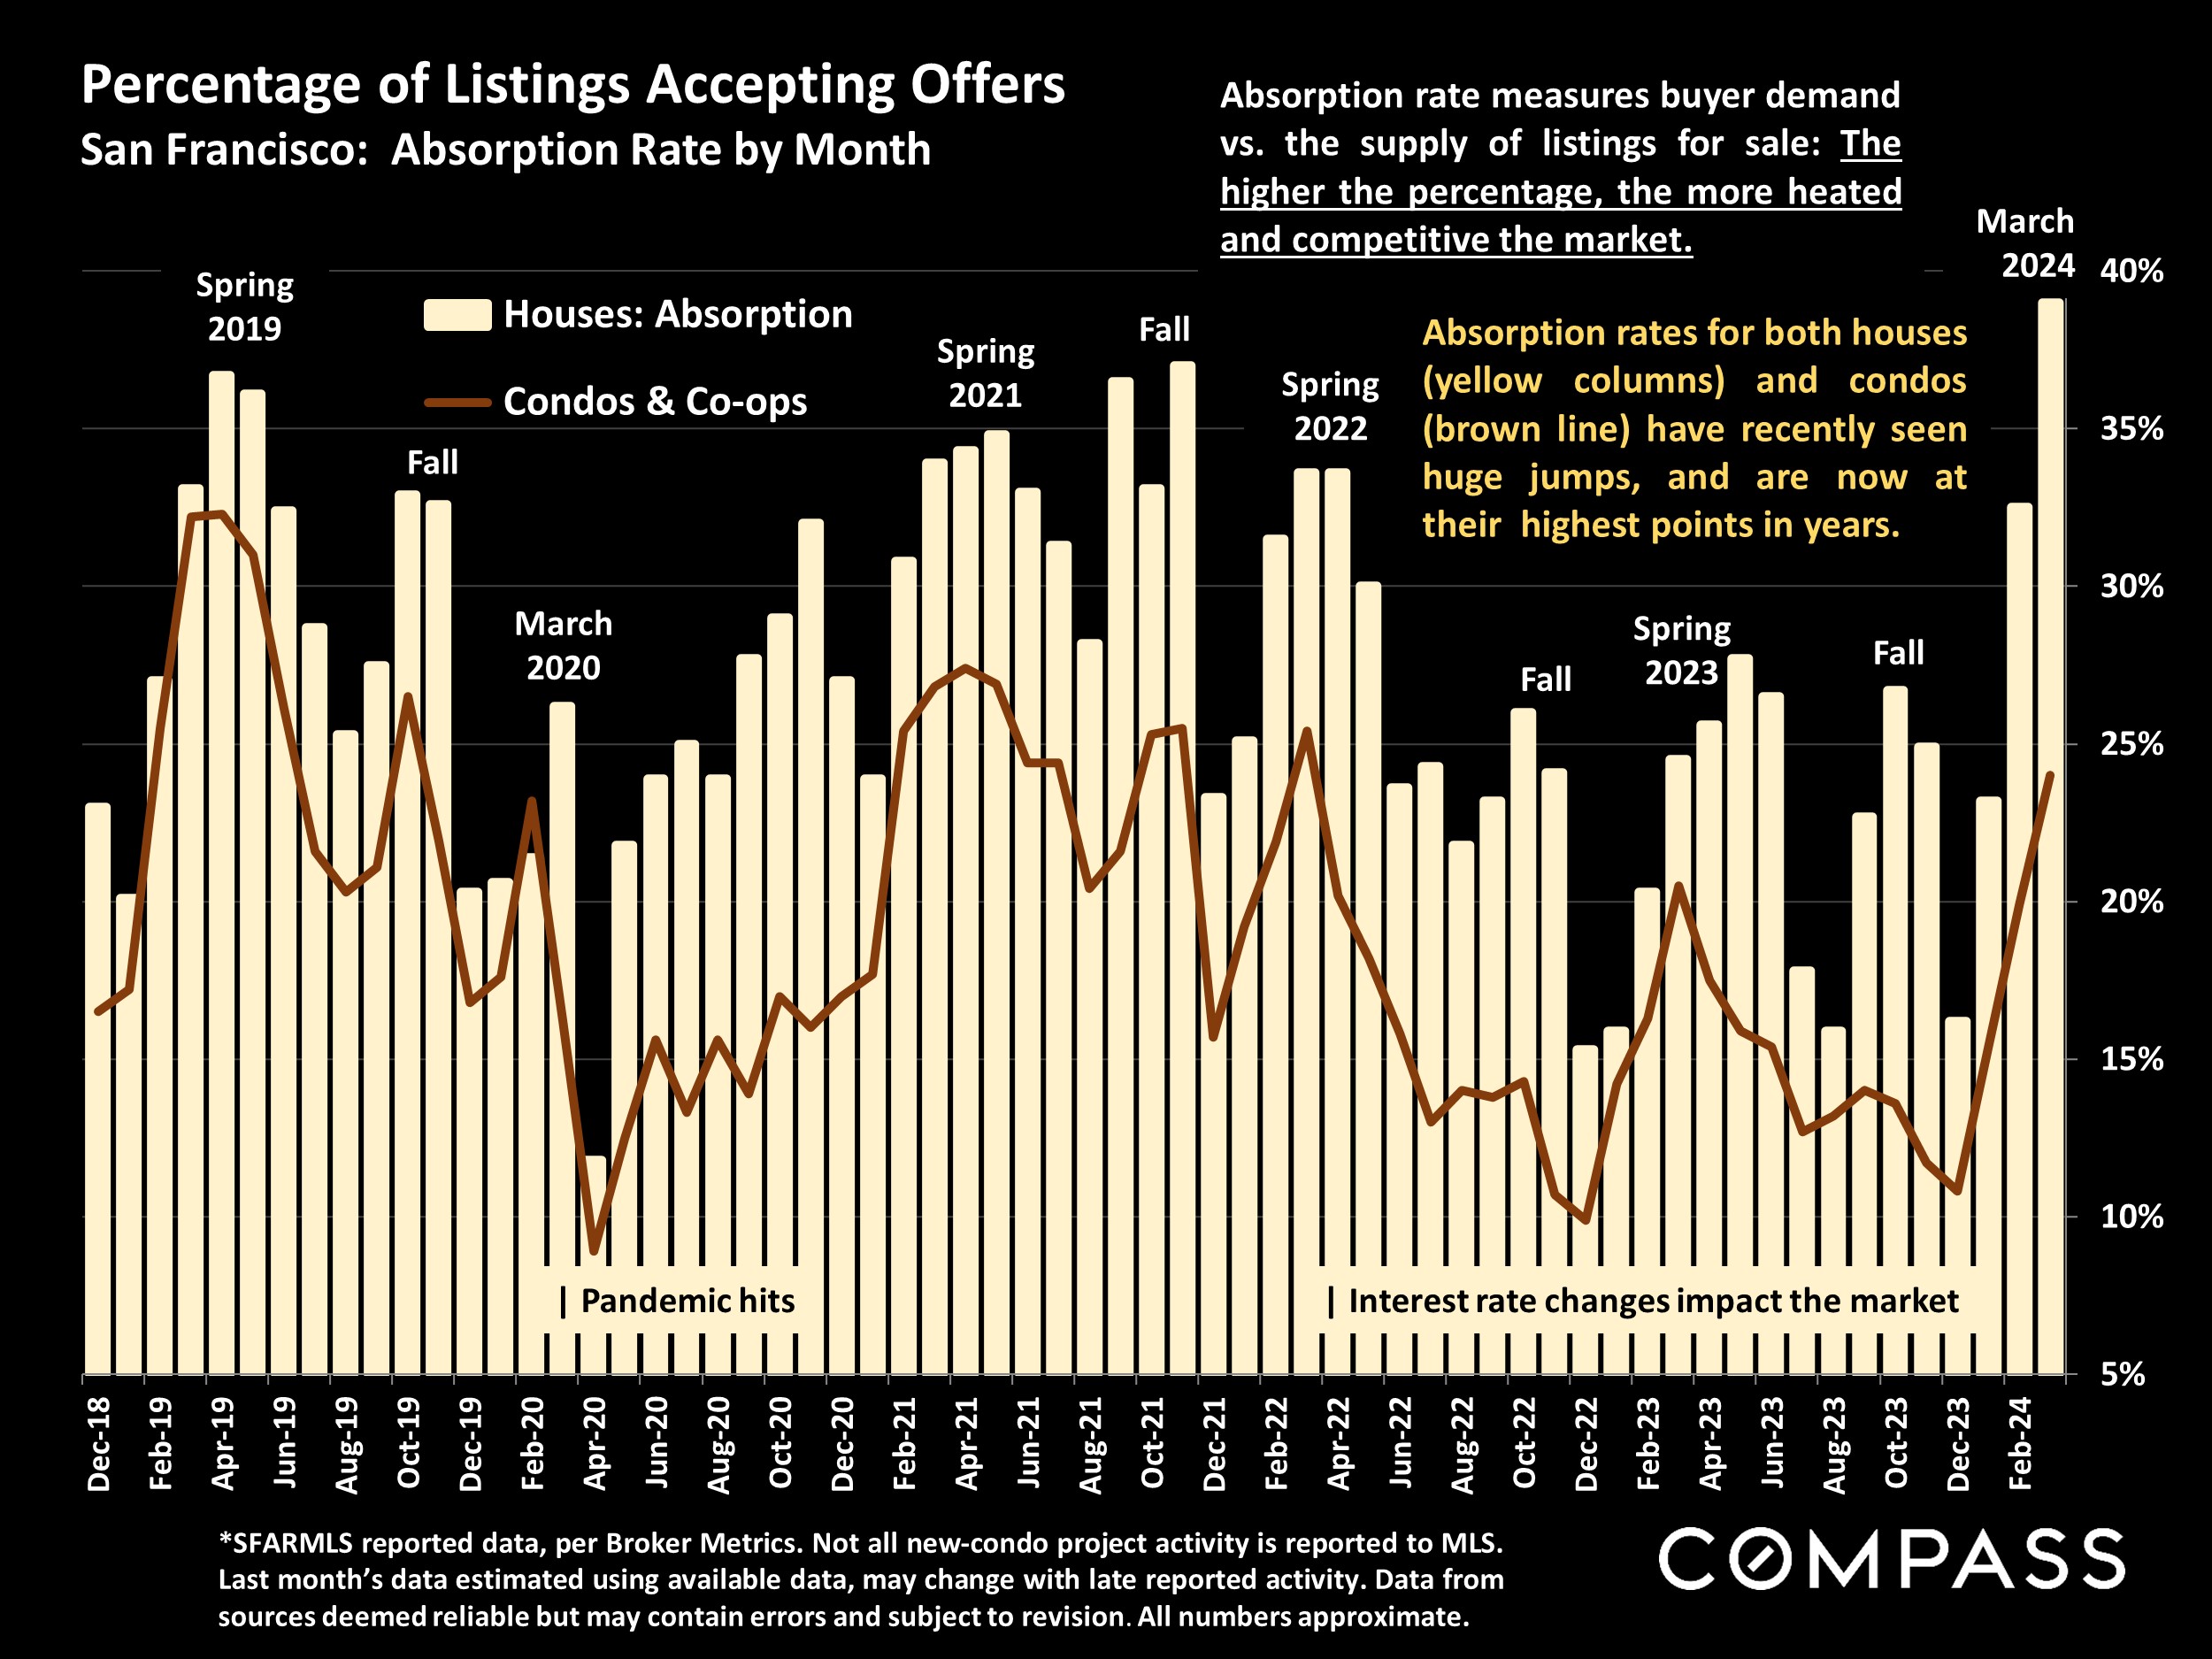
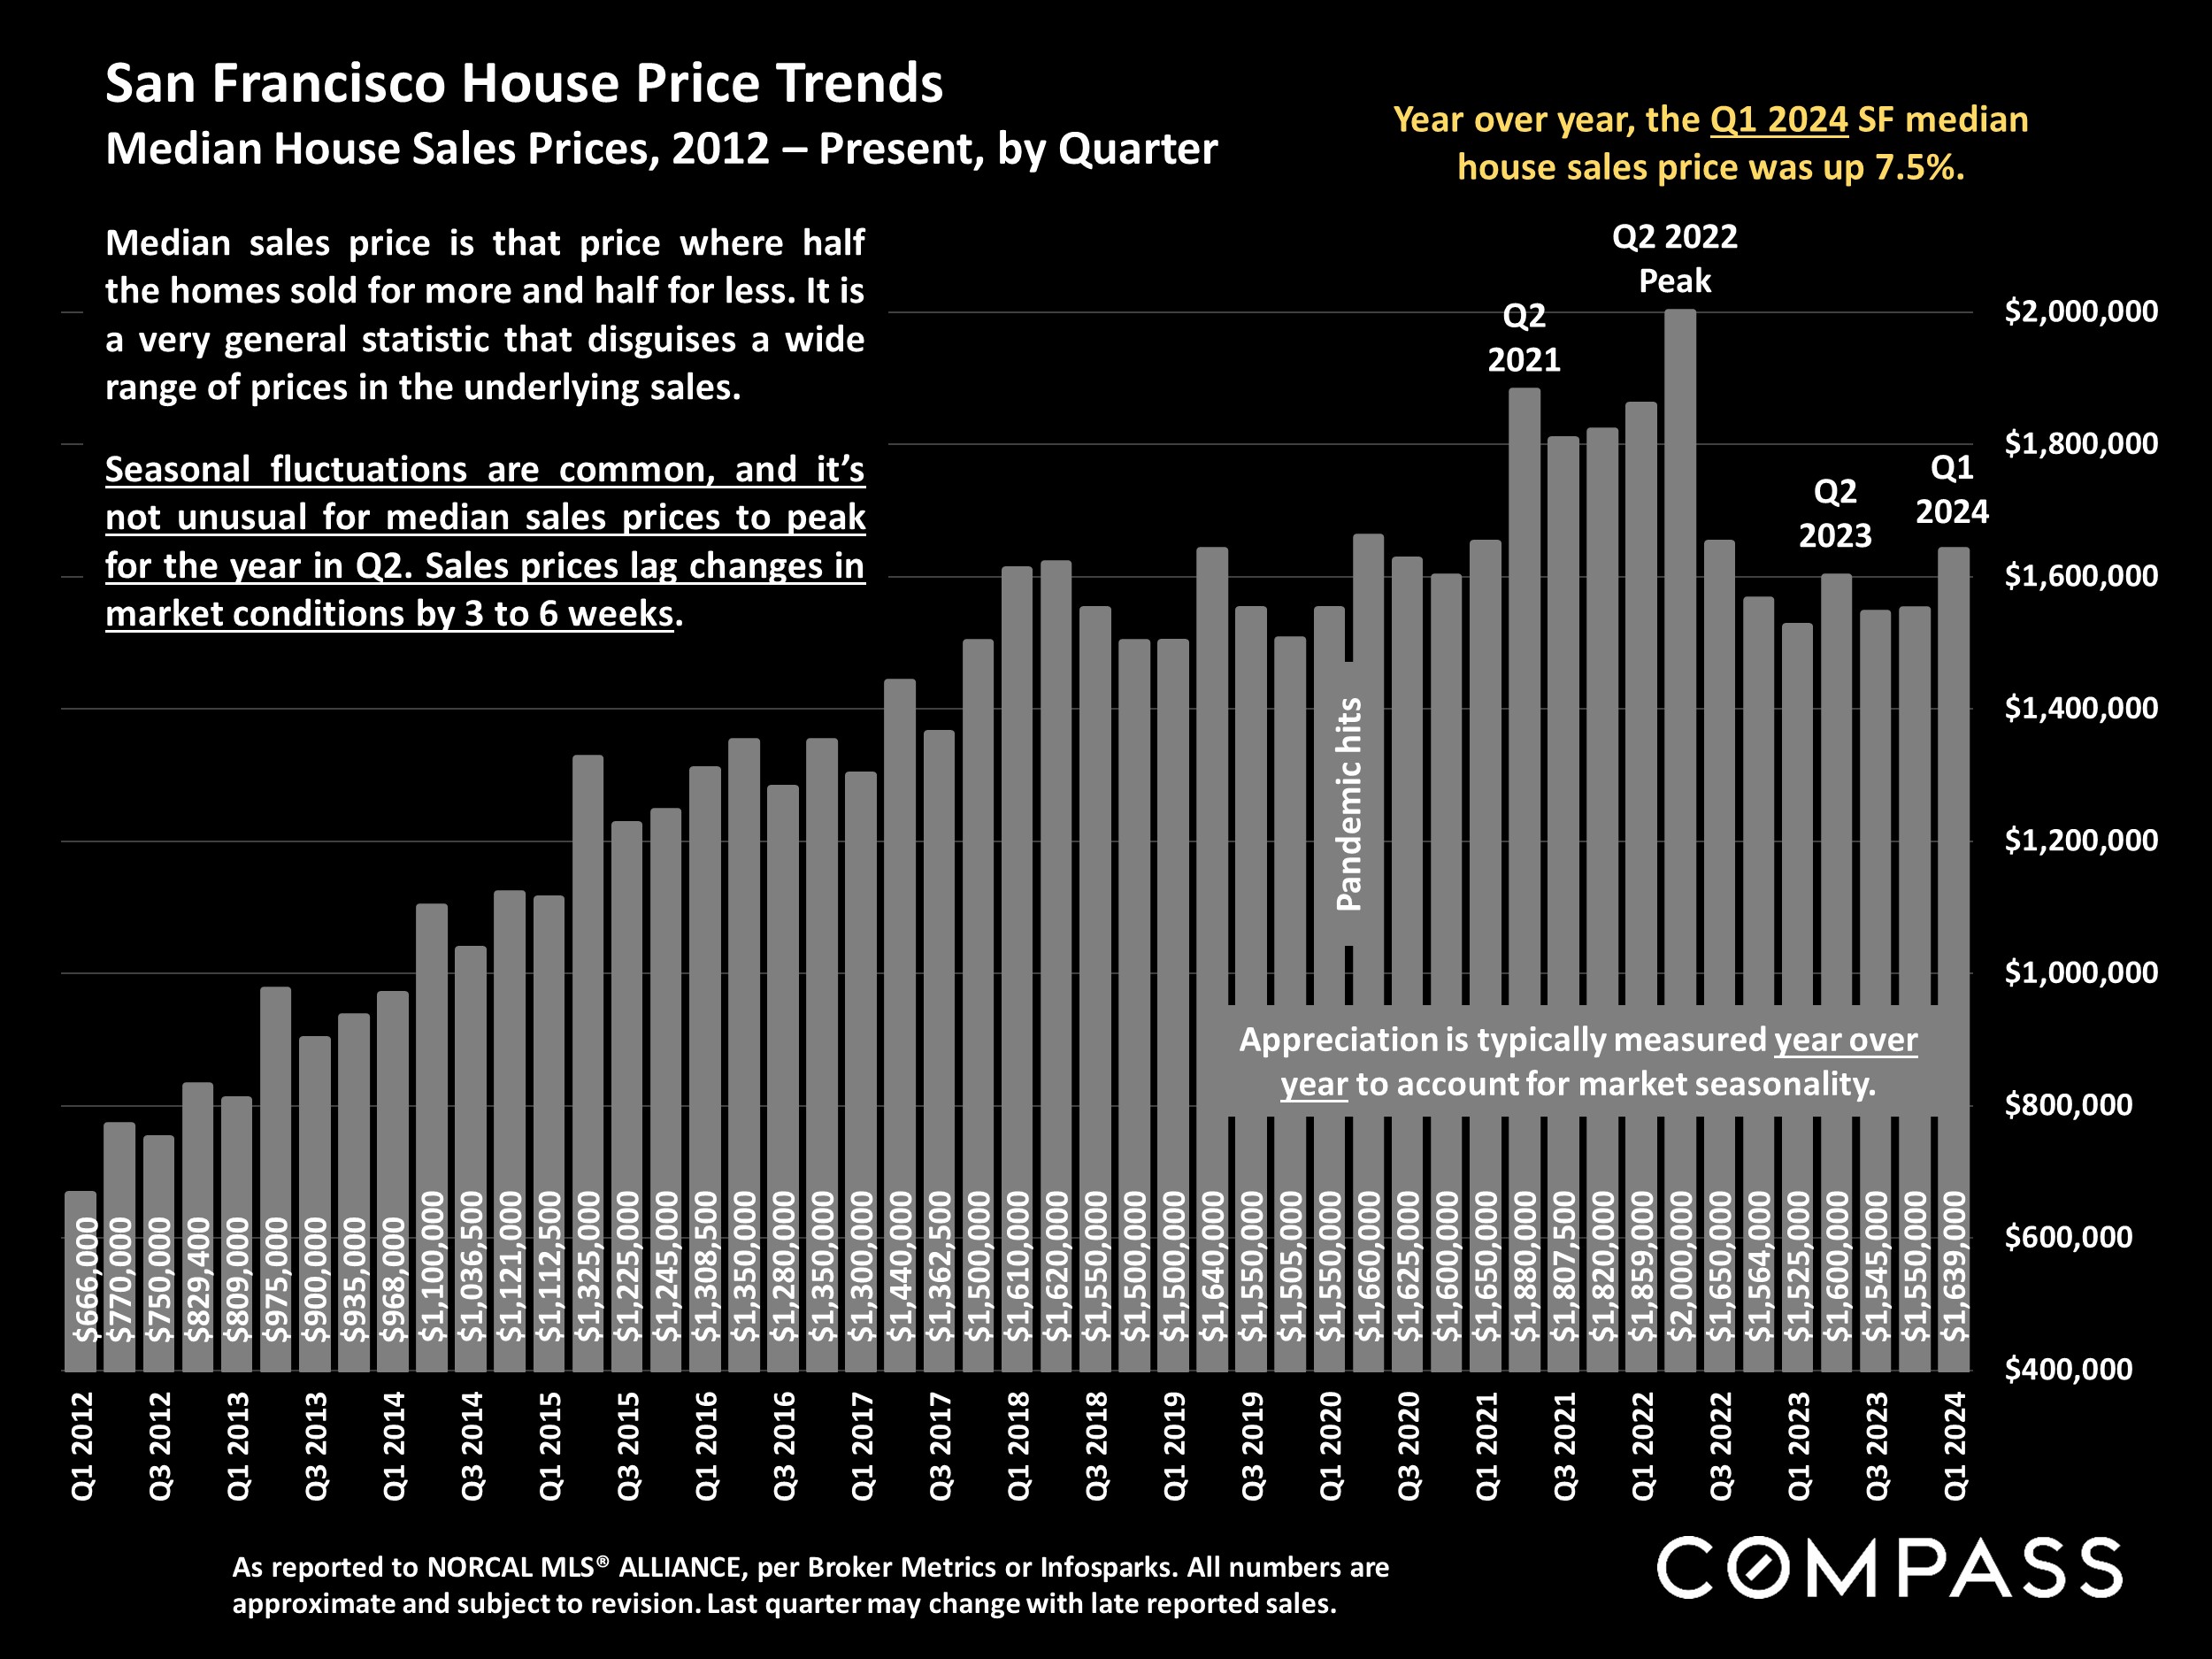
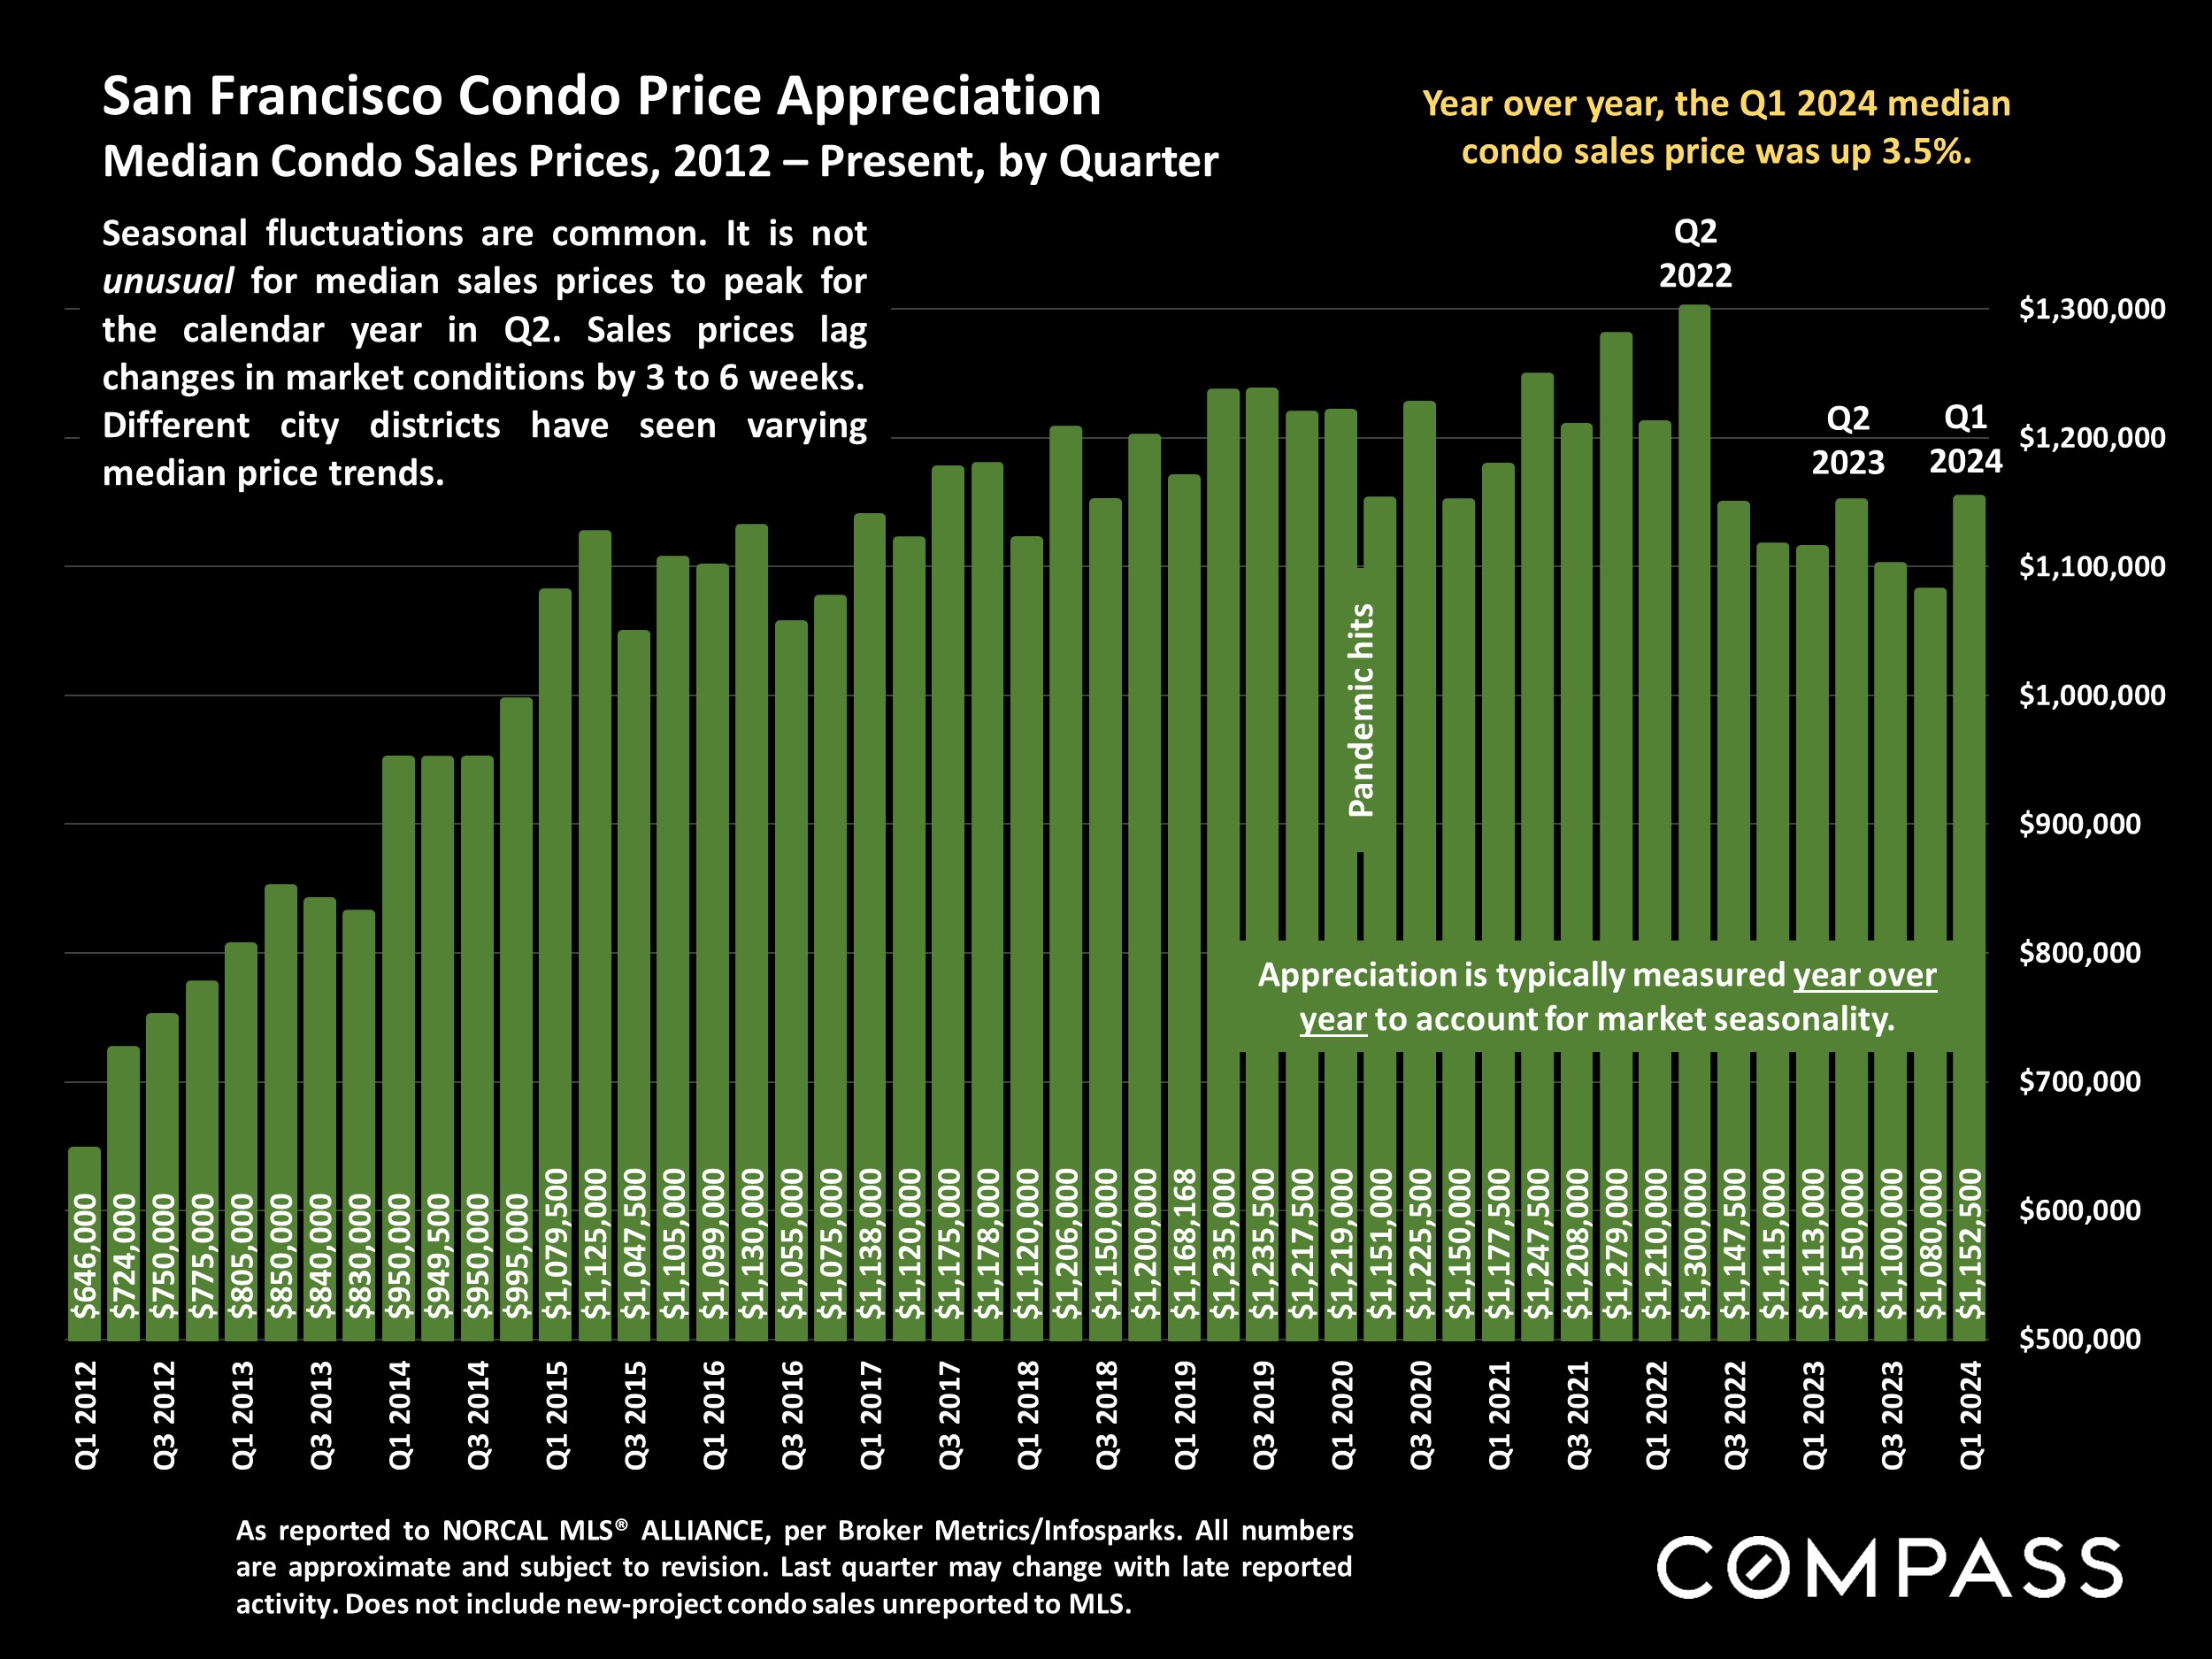
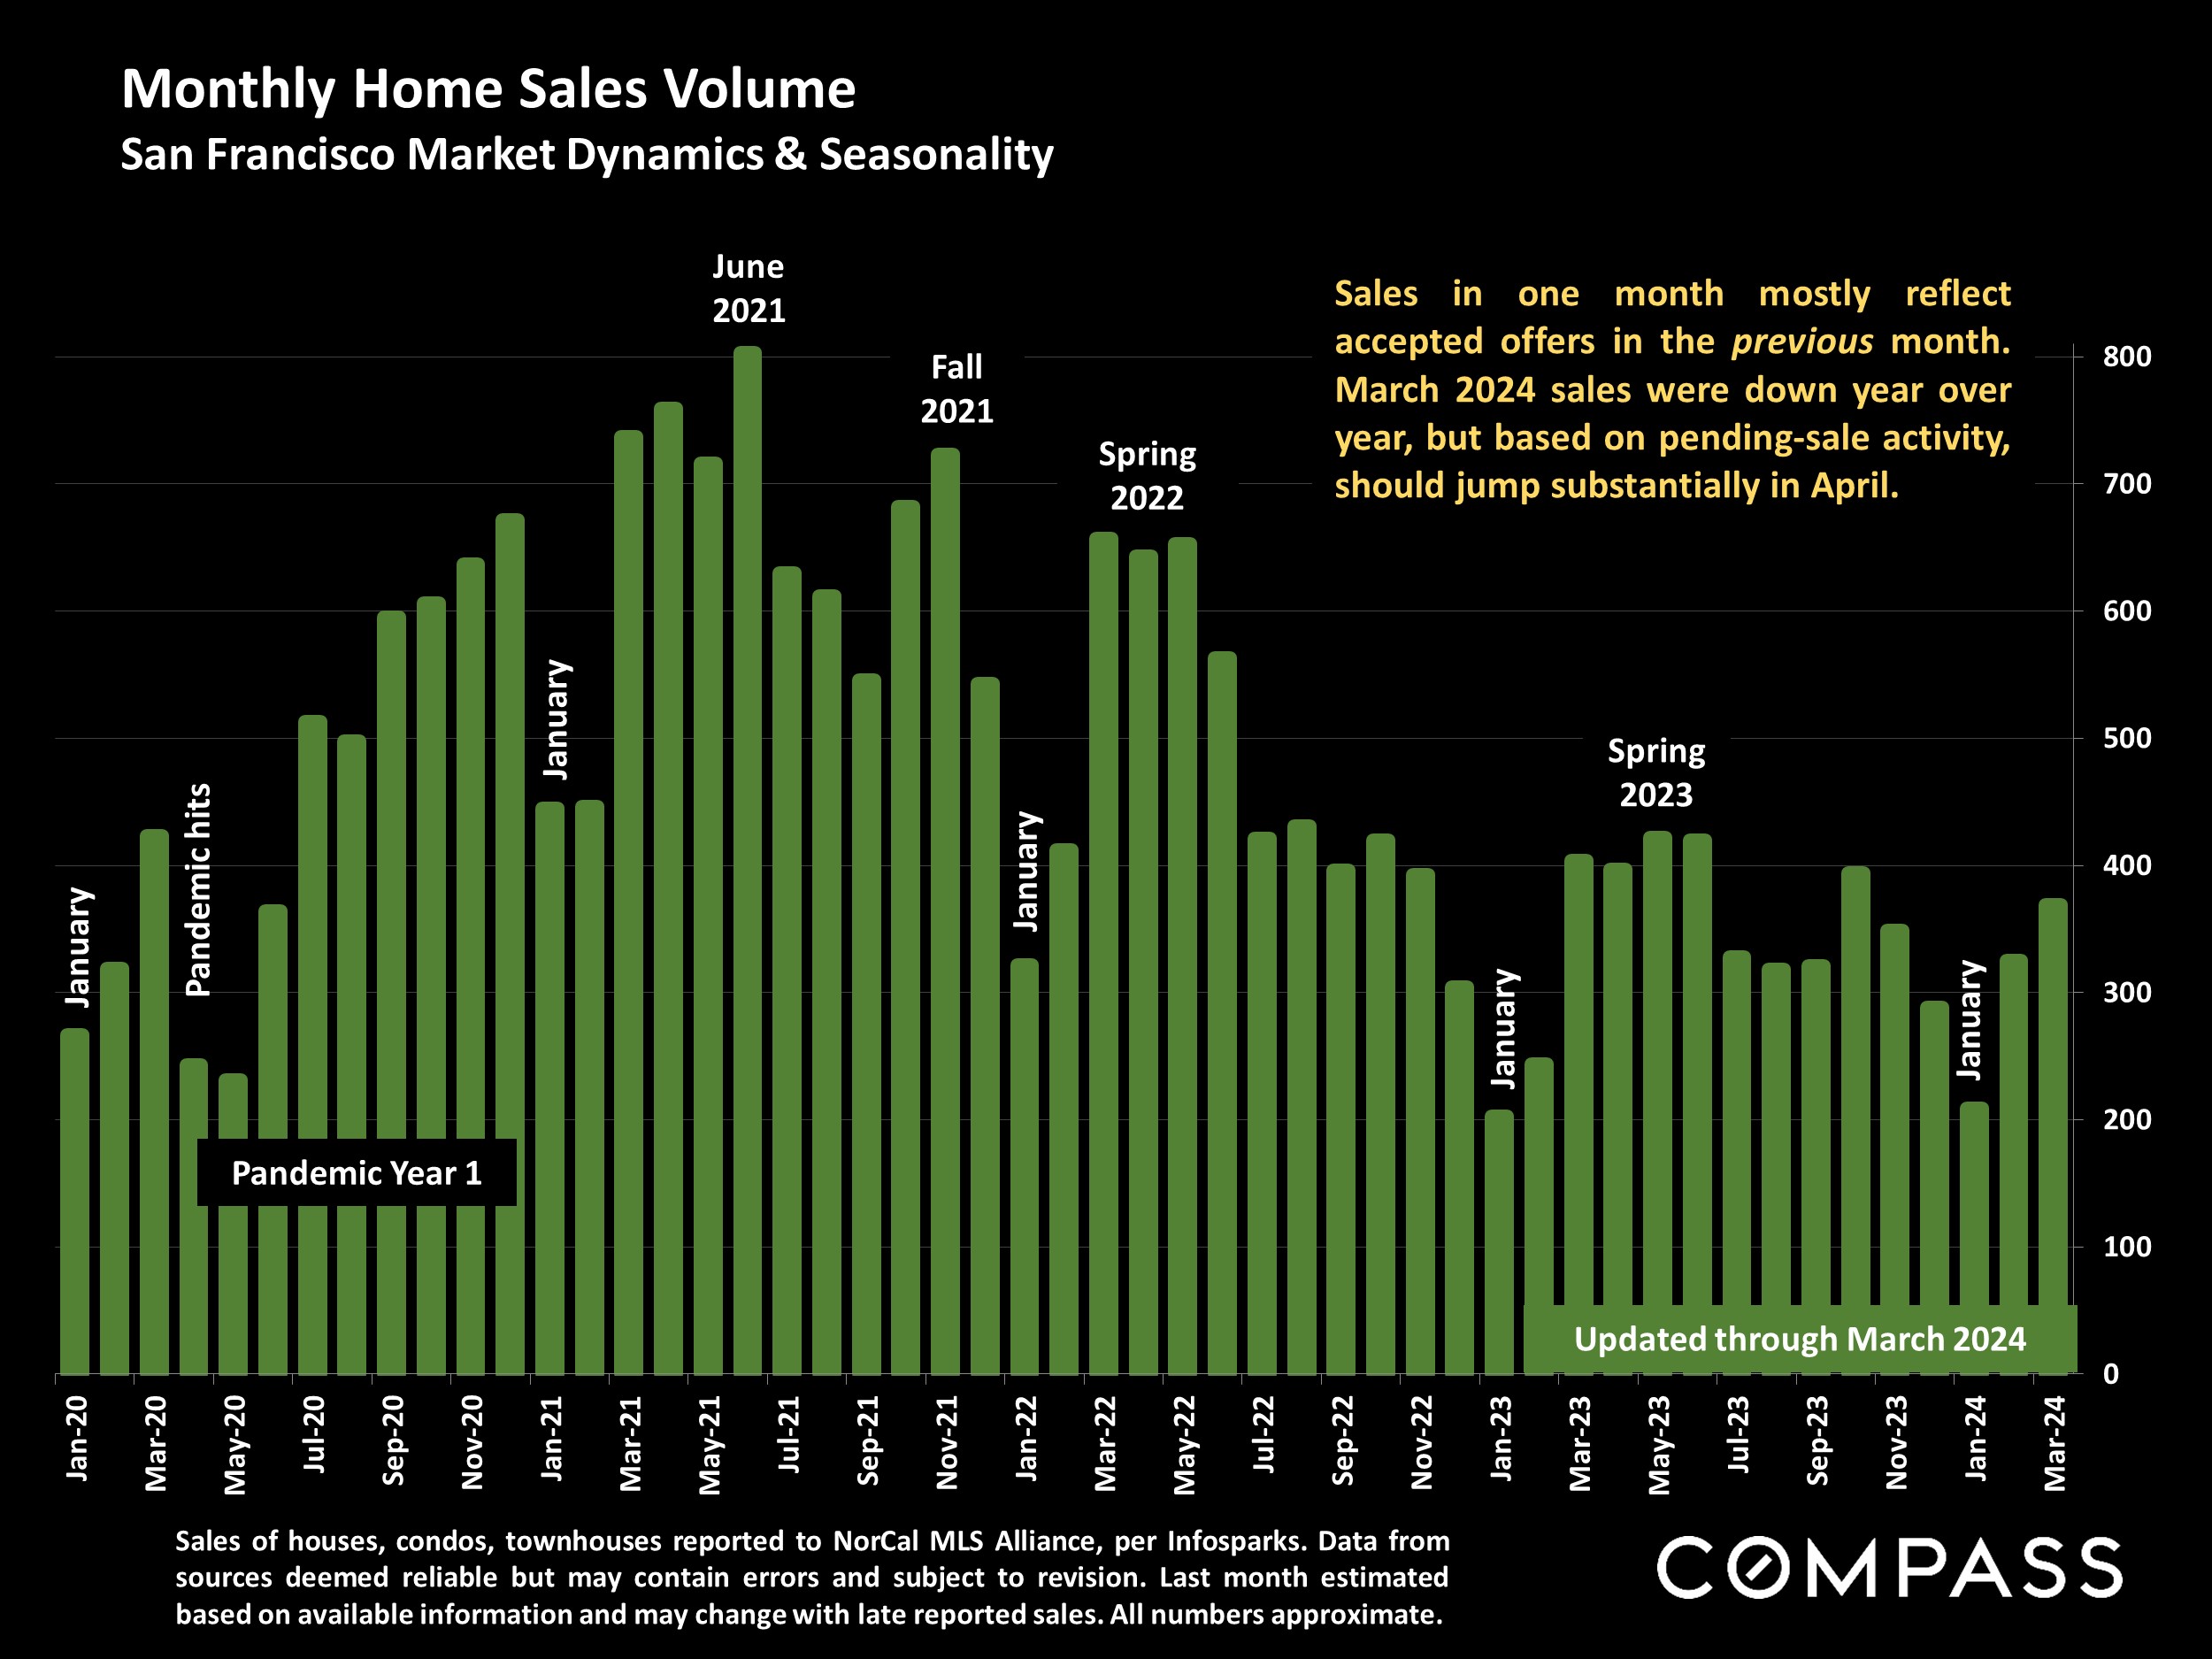
Ever since the beginning of the year, and now moving into the spring selling season, striking shifts in supply and demand have occurred and continued to accelerate, resulting in a dramatic leap in the heat and competitiveness of market conditions. Based on current indicators, and what is being experienced on the ground as new listings arrive on the market, deals are negotiated, and homes go into contract, it appears almost certain that significant home price increases will continue in Q2 2024.

Macroeconomic Conditions

In the 8 weeks through early April, the weekly average, 30-year conforming-loan interest rate has oscillated between 6.74% and 6.94%: Up from January, but still well down from last fall. In the last month, the S&P 500 & Nasdaq stock market indices continued to hit new all-time highs, with substantial effects on household wealth. After the big jump in December-January, consumer confidence is at its highest point in almost 3 years. Monthly inflation rates have remained stable since October, ranging from 3.1% to 3.3%: Higher than the Fed's 2% goal, but reductions in its benchmark rate later this year are still commonly expected.

Both the latest national and San Francisco unemployment readings, at 3.8%, remain close to historic lows.

Listings Accepting Offers (Going into Contract) San Francisco Market Dynamics & SeasonalityPercentage of Listings Accepting Offers San Francisco: Absorption Rate by MonthSan Francisco House Price Trends.Median House Sales Prices, 2012 - Present, by QuarterSan Francisco Condo Price Appreciation.Median Condo Sales Prices, 2012 - Present, by QuarterSan Francisco CONDO Prices: Downtown vs. Non-Downtown 3-Month-Rolling, Median Condo Sales Prices since 2005*Bay Area Median House Values by County Early Spring 2024 Update: By Bedroom/Bath Count*San Francisco Value Trends since 2005 3-Month Rolling, Median Dollar per Square Foot Values*Bay Area Median House Values by County Early Spring 2024 Update: By Bedroom/Bath Count*Bay Area Median Condo & Townhouse Values by County Early Spring 2024 Update: By Property Type & Bedroom/Bath Count*New Listings Coming on Market San Francisco Market Dynamics & SeasonalitySan Francisco Homes Market Active & Coming-Soon Listings on 1st of Month*San Francisco Residential Market Market Dynamics by Price Segment/Property TypeMonthly Home Sales Volume San Francisco Market Dynamics & SeasonalitySan Francisco Higher-Price Home Sales* Homes Selling for $3 Million+Average Days on Market - Speed of Sale San Francisco Market Dynamics & SeasonalityOverbidding List Prices in San Francisco Percentage of Home Sales Closing over List PriceAverage Sales Price to Original List Price Percentage San Francisco Over/Under Bidding: Market Dynamics & SeasonalityPrice Reductions on Active Listings San Francisco Market Dynamics & SeasonalityMedian Household Income.San Francisco County since 2000*San Francisco Population Trends since 2010 U.S. Census Estimates, July 1st to July 1stSan Francisco Year-over-Year Population Change U.S. Census Annual Estimates, Percentage Change, July 1st to July 1stSan Francisco Employment Trends Number of Employed Residents since 2000San Francisco Residential Rents - Approximate, Good Faith Estimates* Average Asking Rent, 1994 - Present, Q1 Data Points (except as noted)

If you have any questions or want to talk more about local market statistics, please don't hesitate to reach out. I'd be happy to grab a coffee or chat via phone. 

Thank you,
Shannon

Want to learn more about Bay Area market trends?

Let’s connect! With relationships and networks across the city, there are a variety of ways I can help you make informed real estate decisions. Call, email, or text – I’m here to help.


Contact