
April 9, 2025
SF: April 2025 Market Stats
By Compass
It's hard to know what to say regarding the staggering volatility and uncertainty that has recently characterized political and economic conditions, much less predict how they will play out over either the short or long term. As of the week ending April 4th, both consumer confidence and financial markets have seen enormous declines. Whether this will continue, or reverse direction is unknown: Policies, actions and reactions have been changing very quickly in 2025.
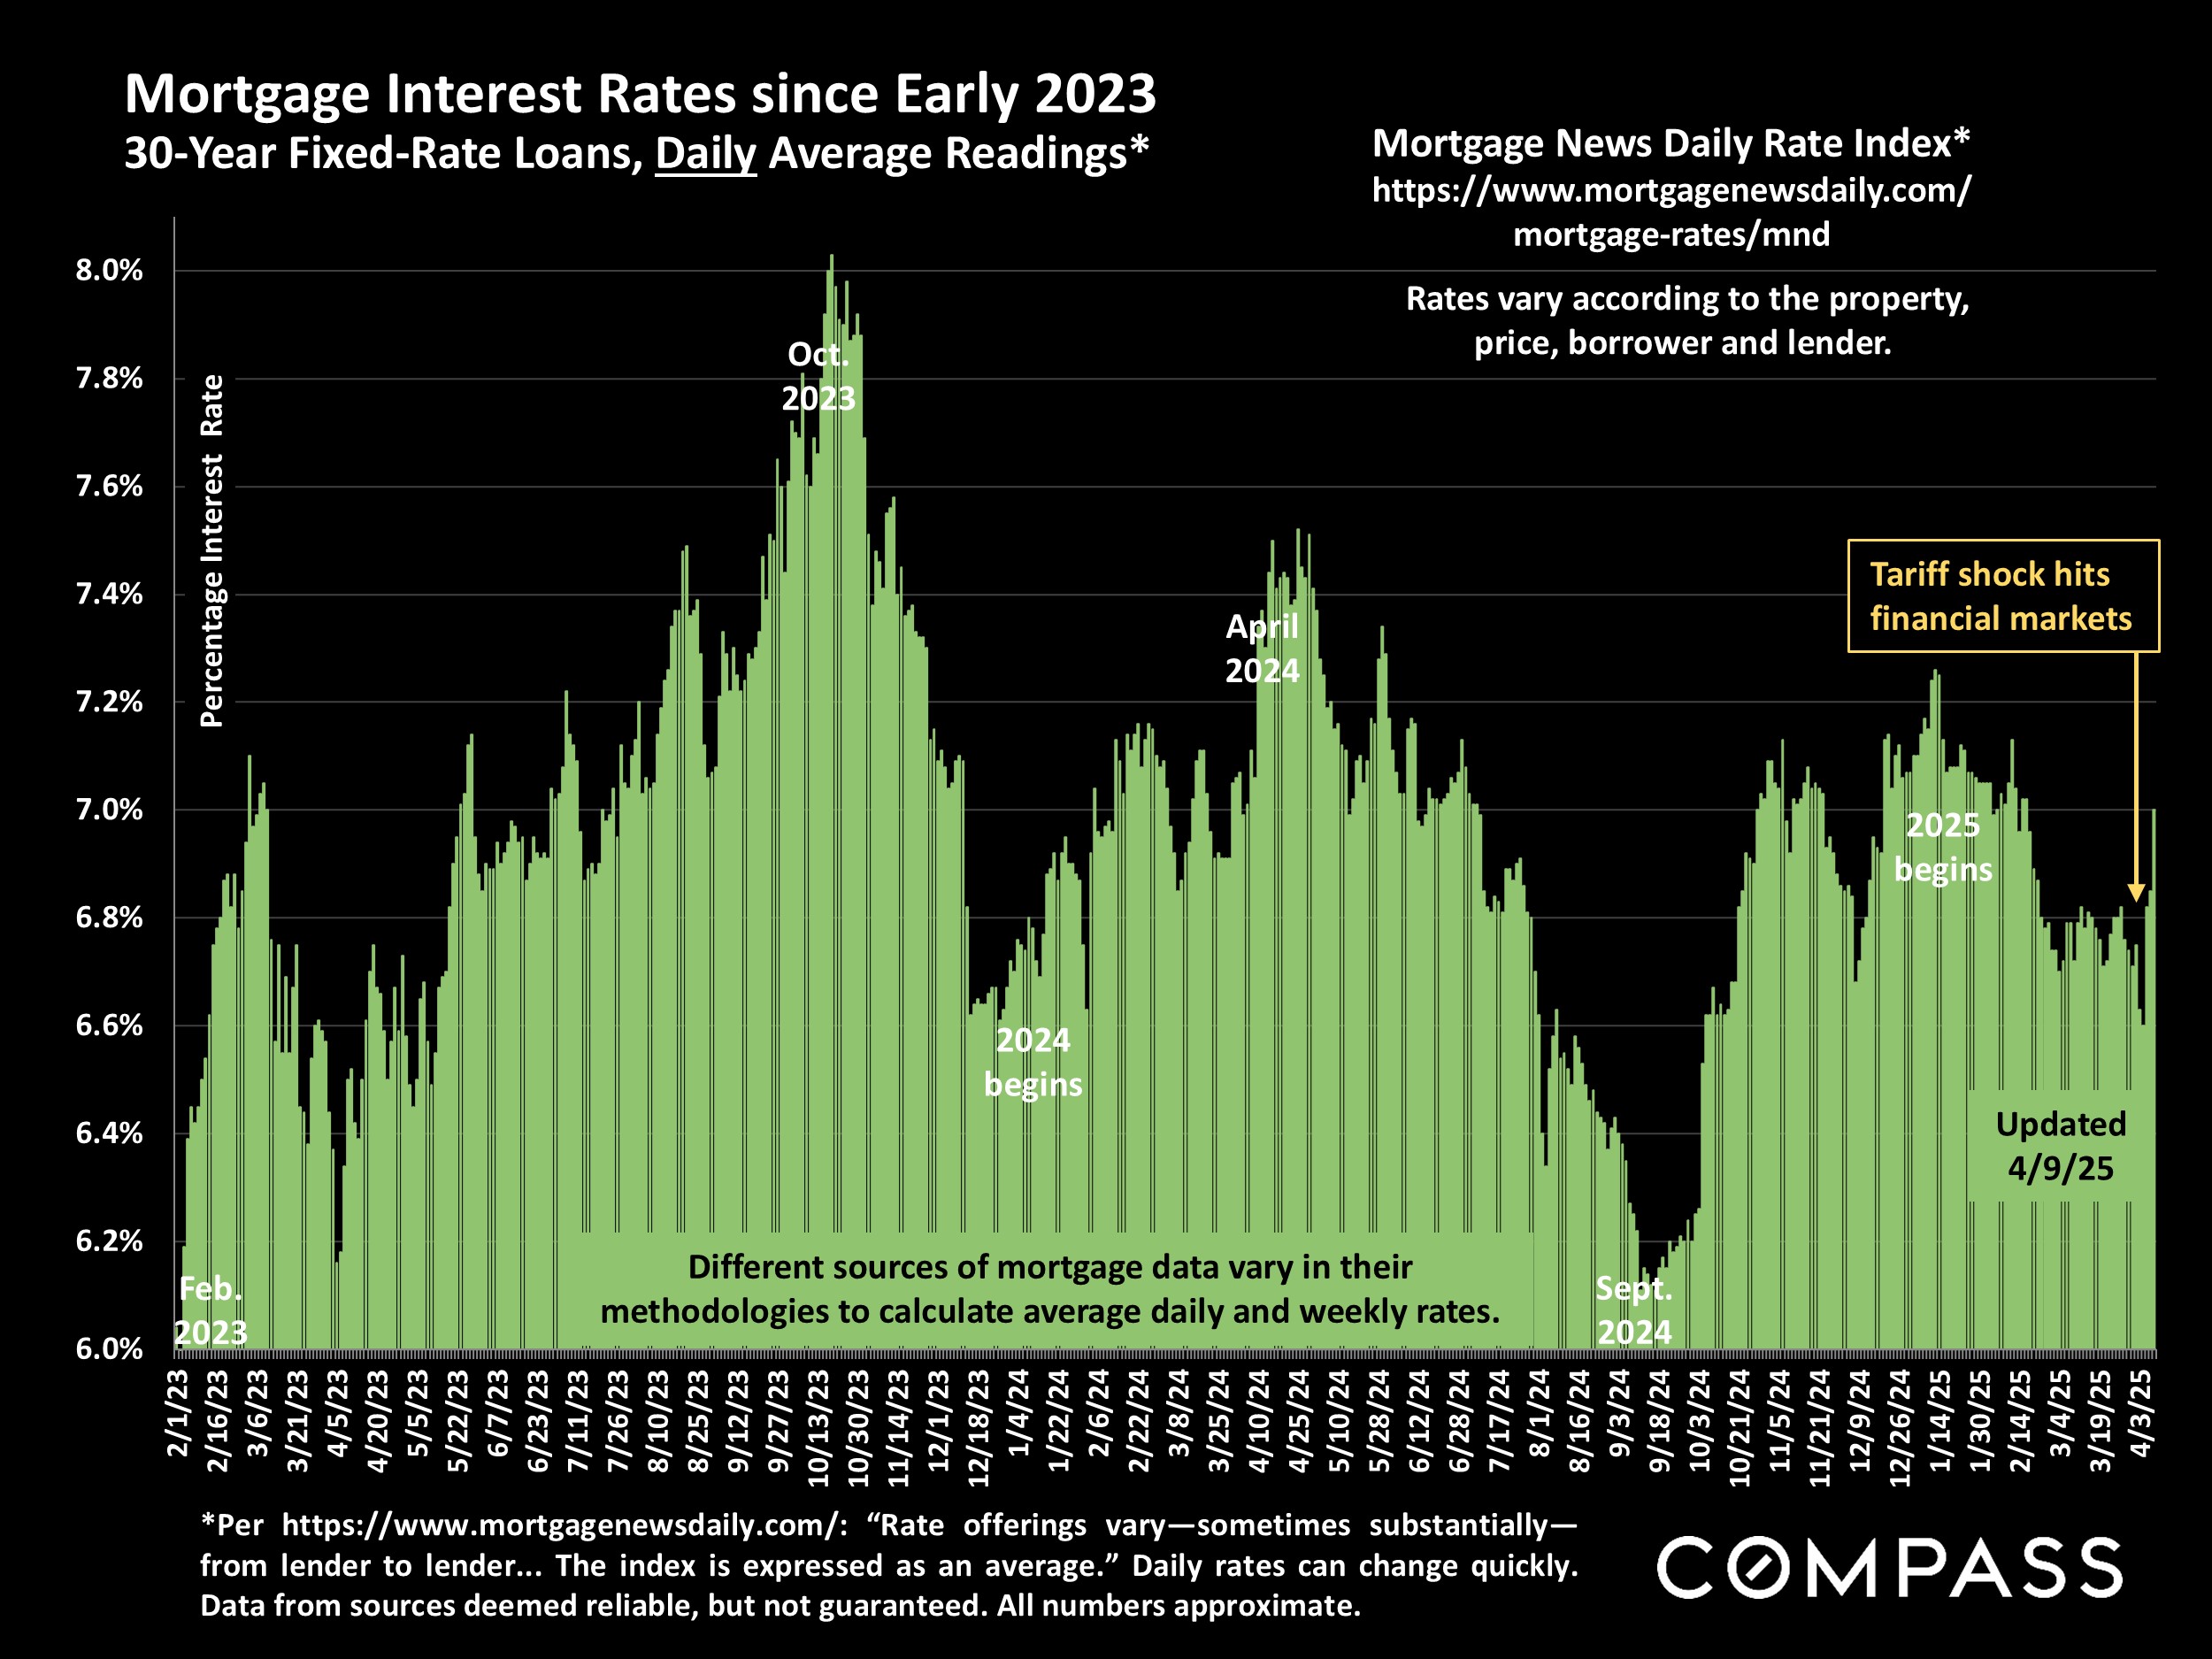
Uncertainty, much less economic pessimism and plunging household wealth, is not typically a positive factor for housing markets, and increasing affluence from stock gains has played a large role in stimulating demand since late 2023. Unfortunately, interest rates have been climbing as well amid the shock of these developments, and tariffs and new immigration policies will almost certainly increase home construction costs. However, the current administration maintains that any short-term pain will be far outweighed by positive, long-term economic benefits.
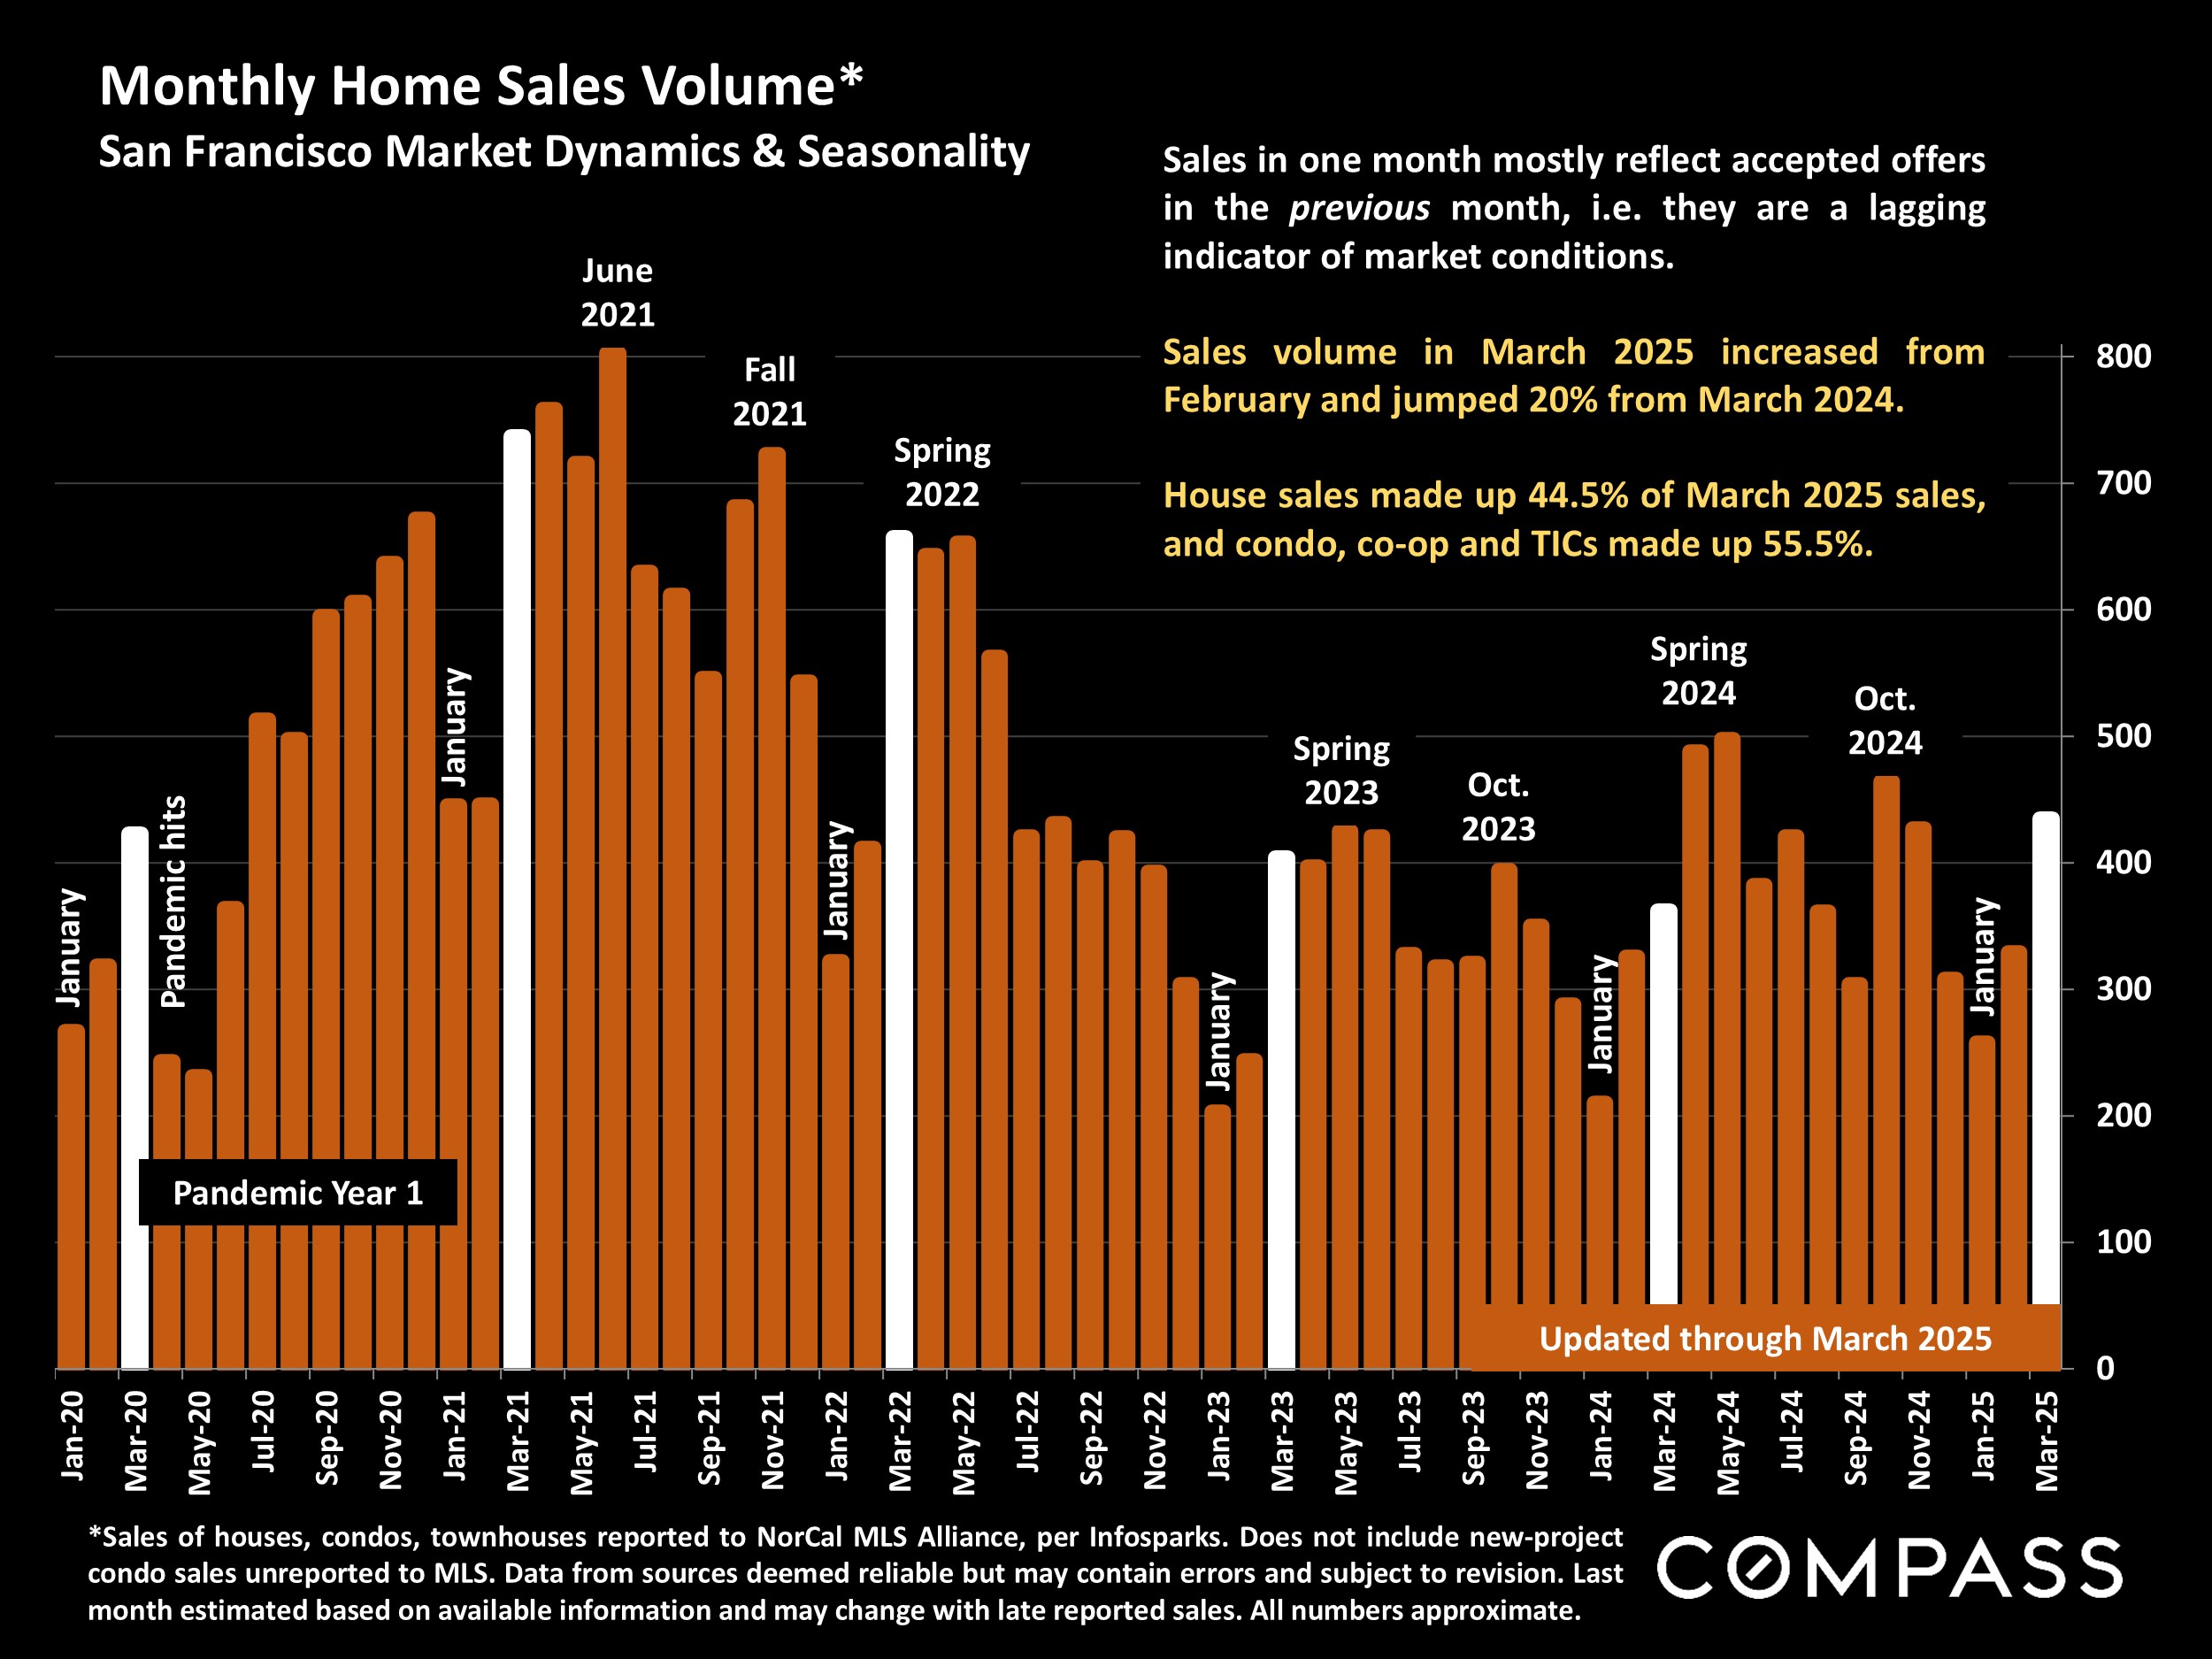
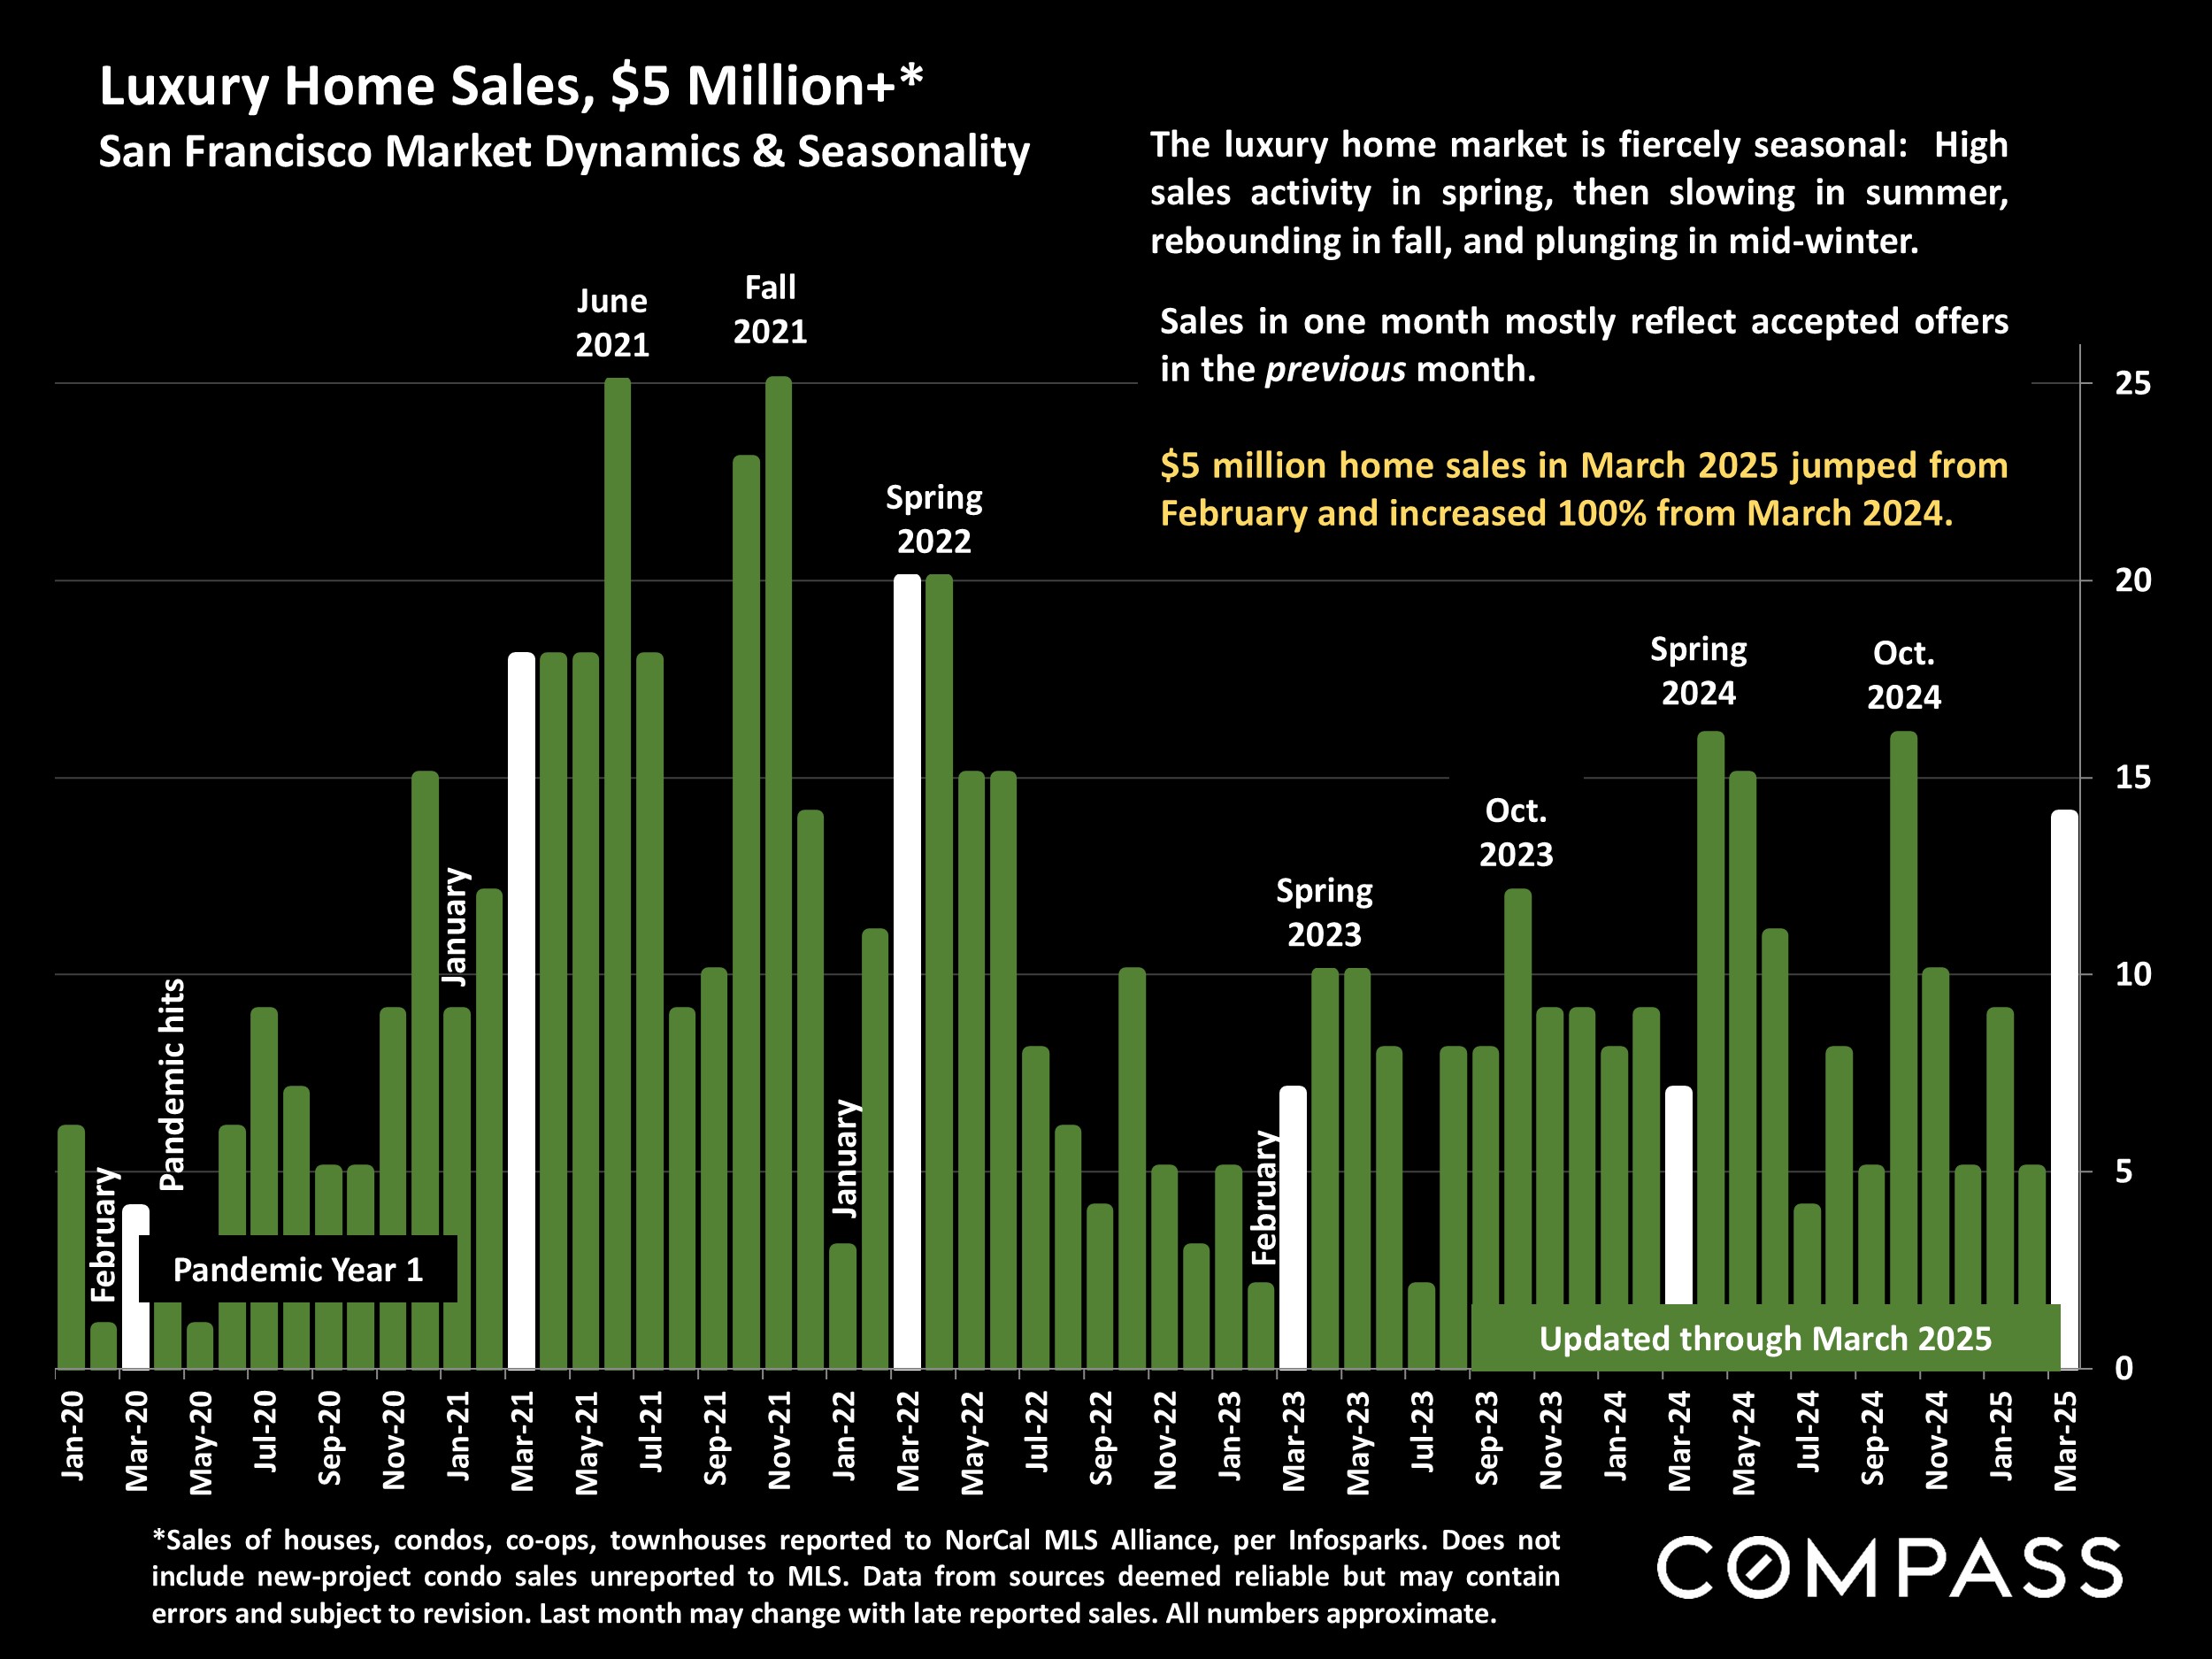
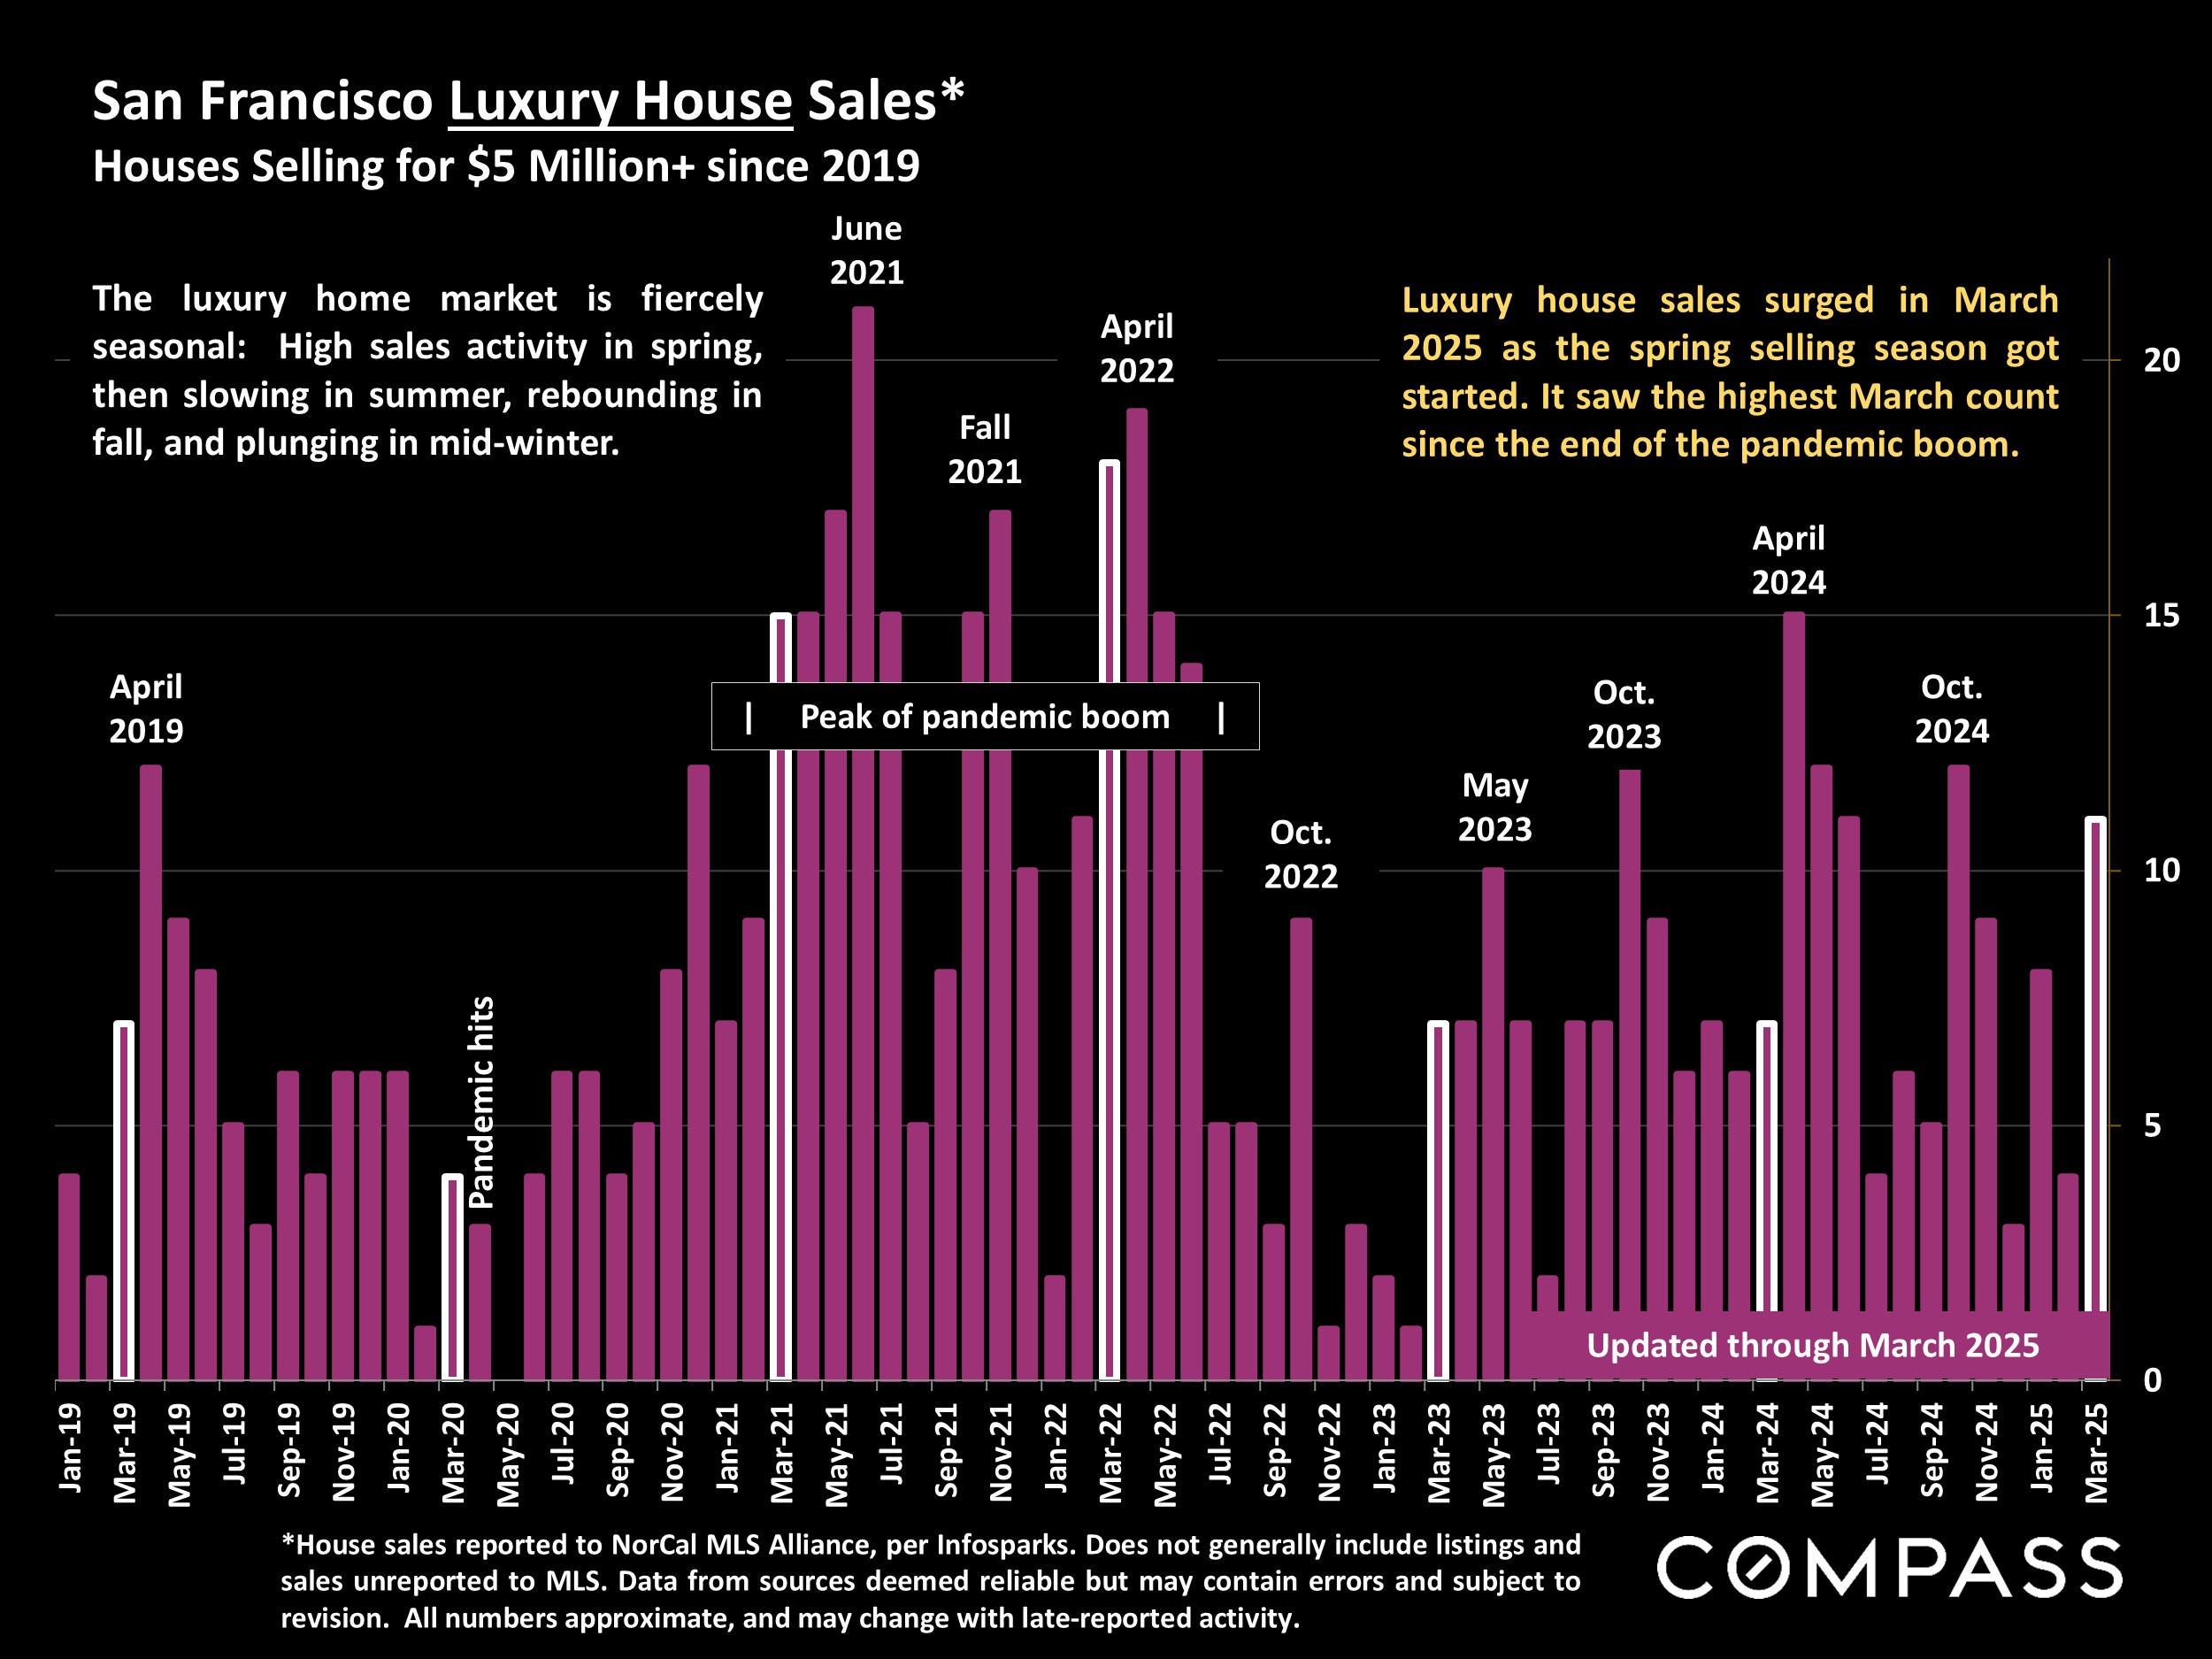
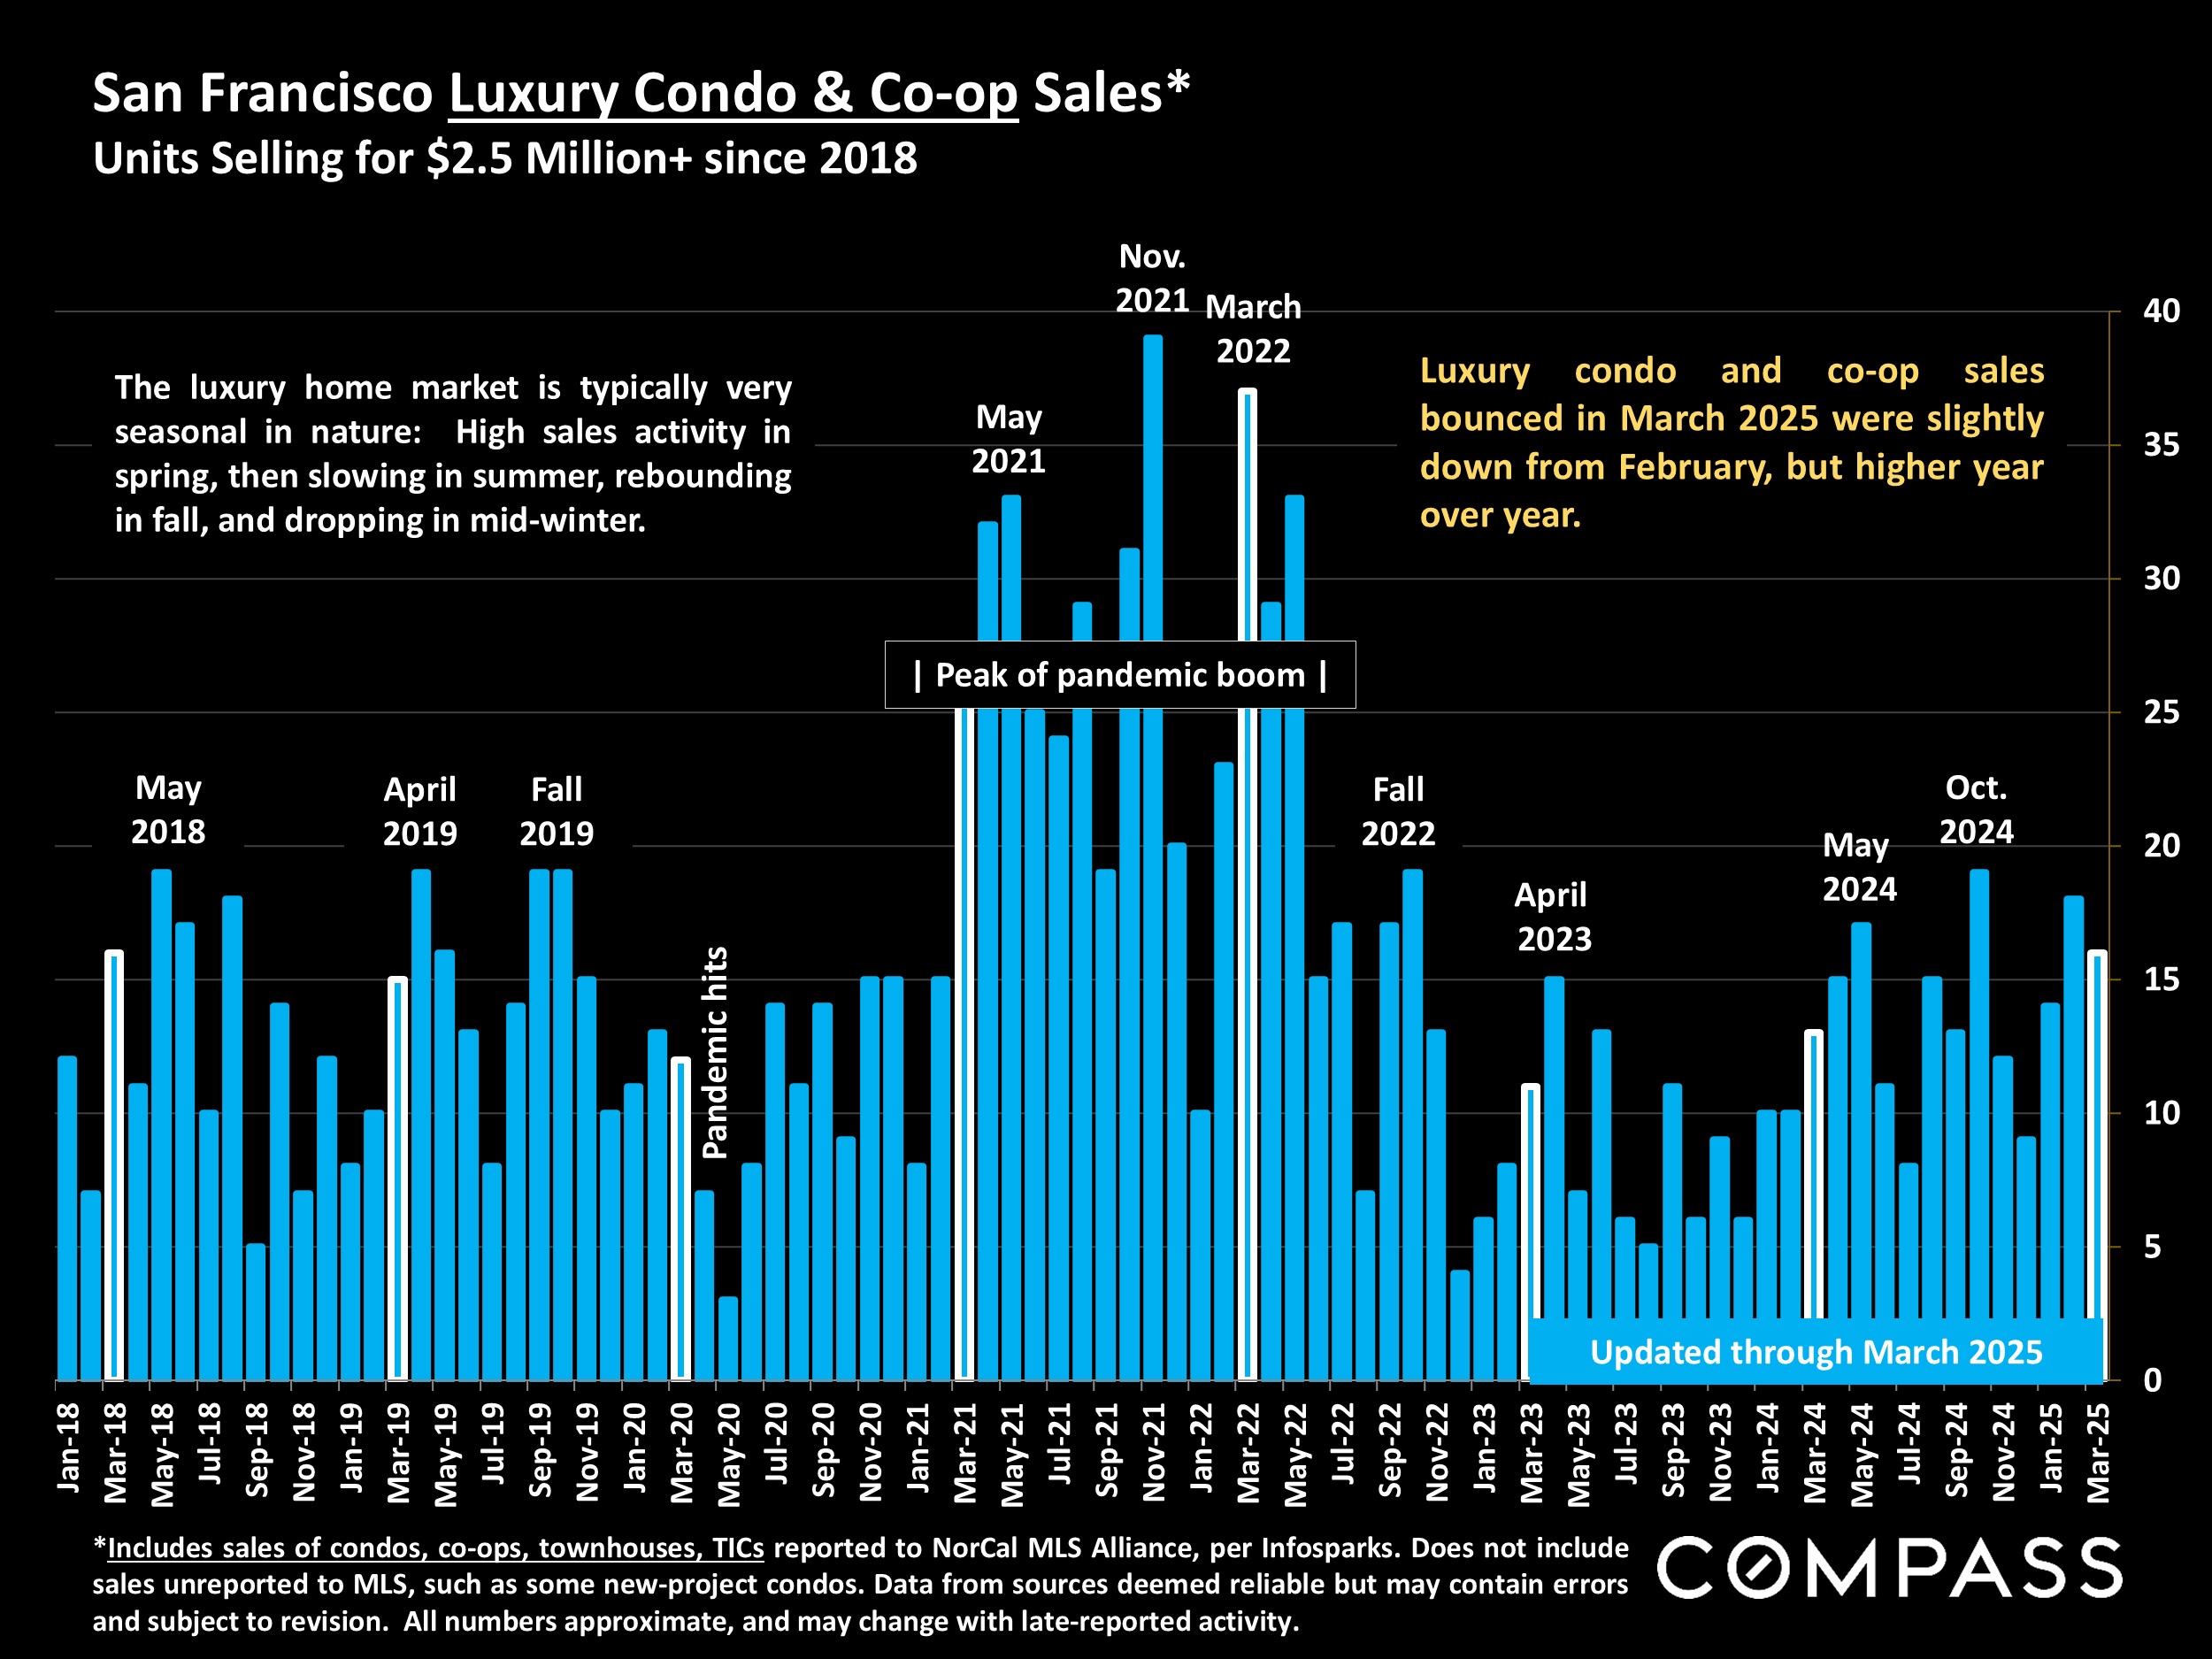
Numbers pertaining to closed-sales data in this report mostly reflect market conditions that predate the most dramatic of recent financial developments. (Because of the typical 3 to 6 week time lapse between deals being made, i.e. listings going into contract, and sales closing escrow, sales data is a lagging indicator of market trends.) The quantifiable, hard-data effects of these new circumstances, should they continue, will come into better focus in the coming weeks and months.
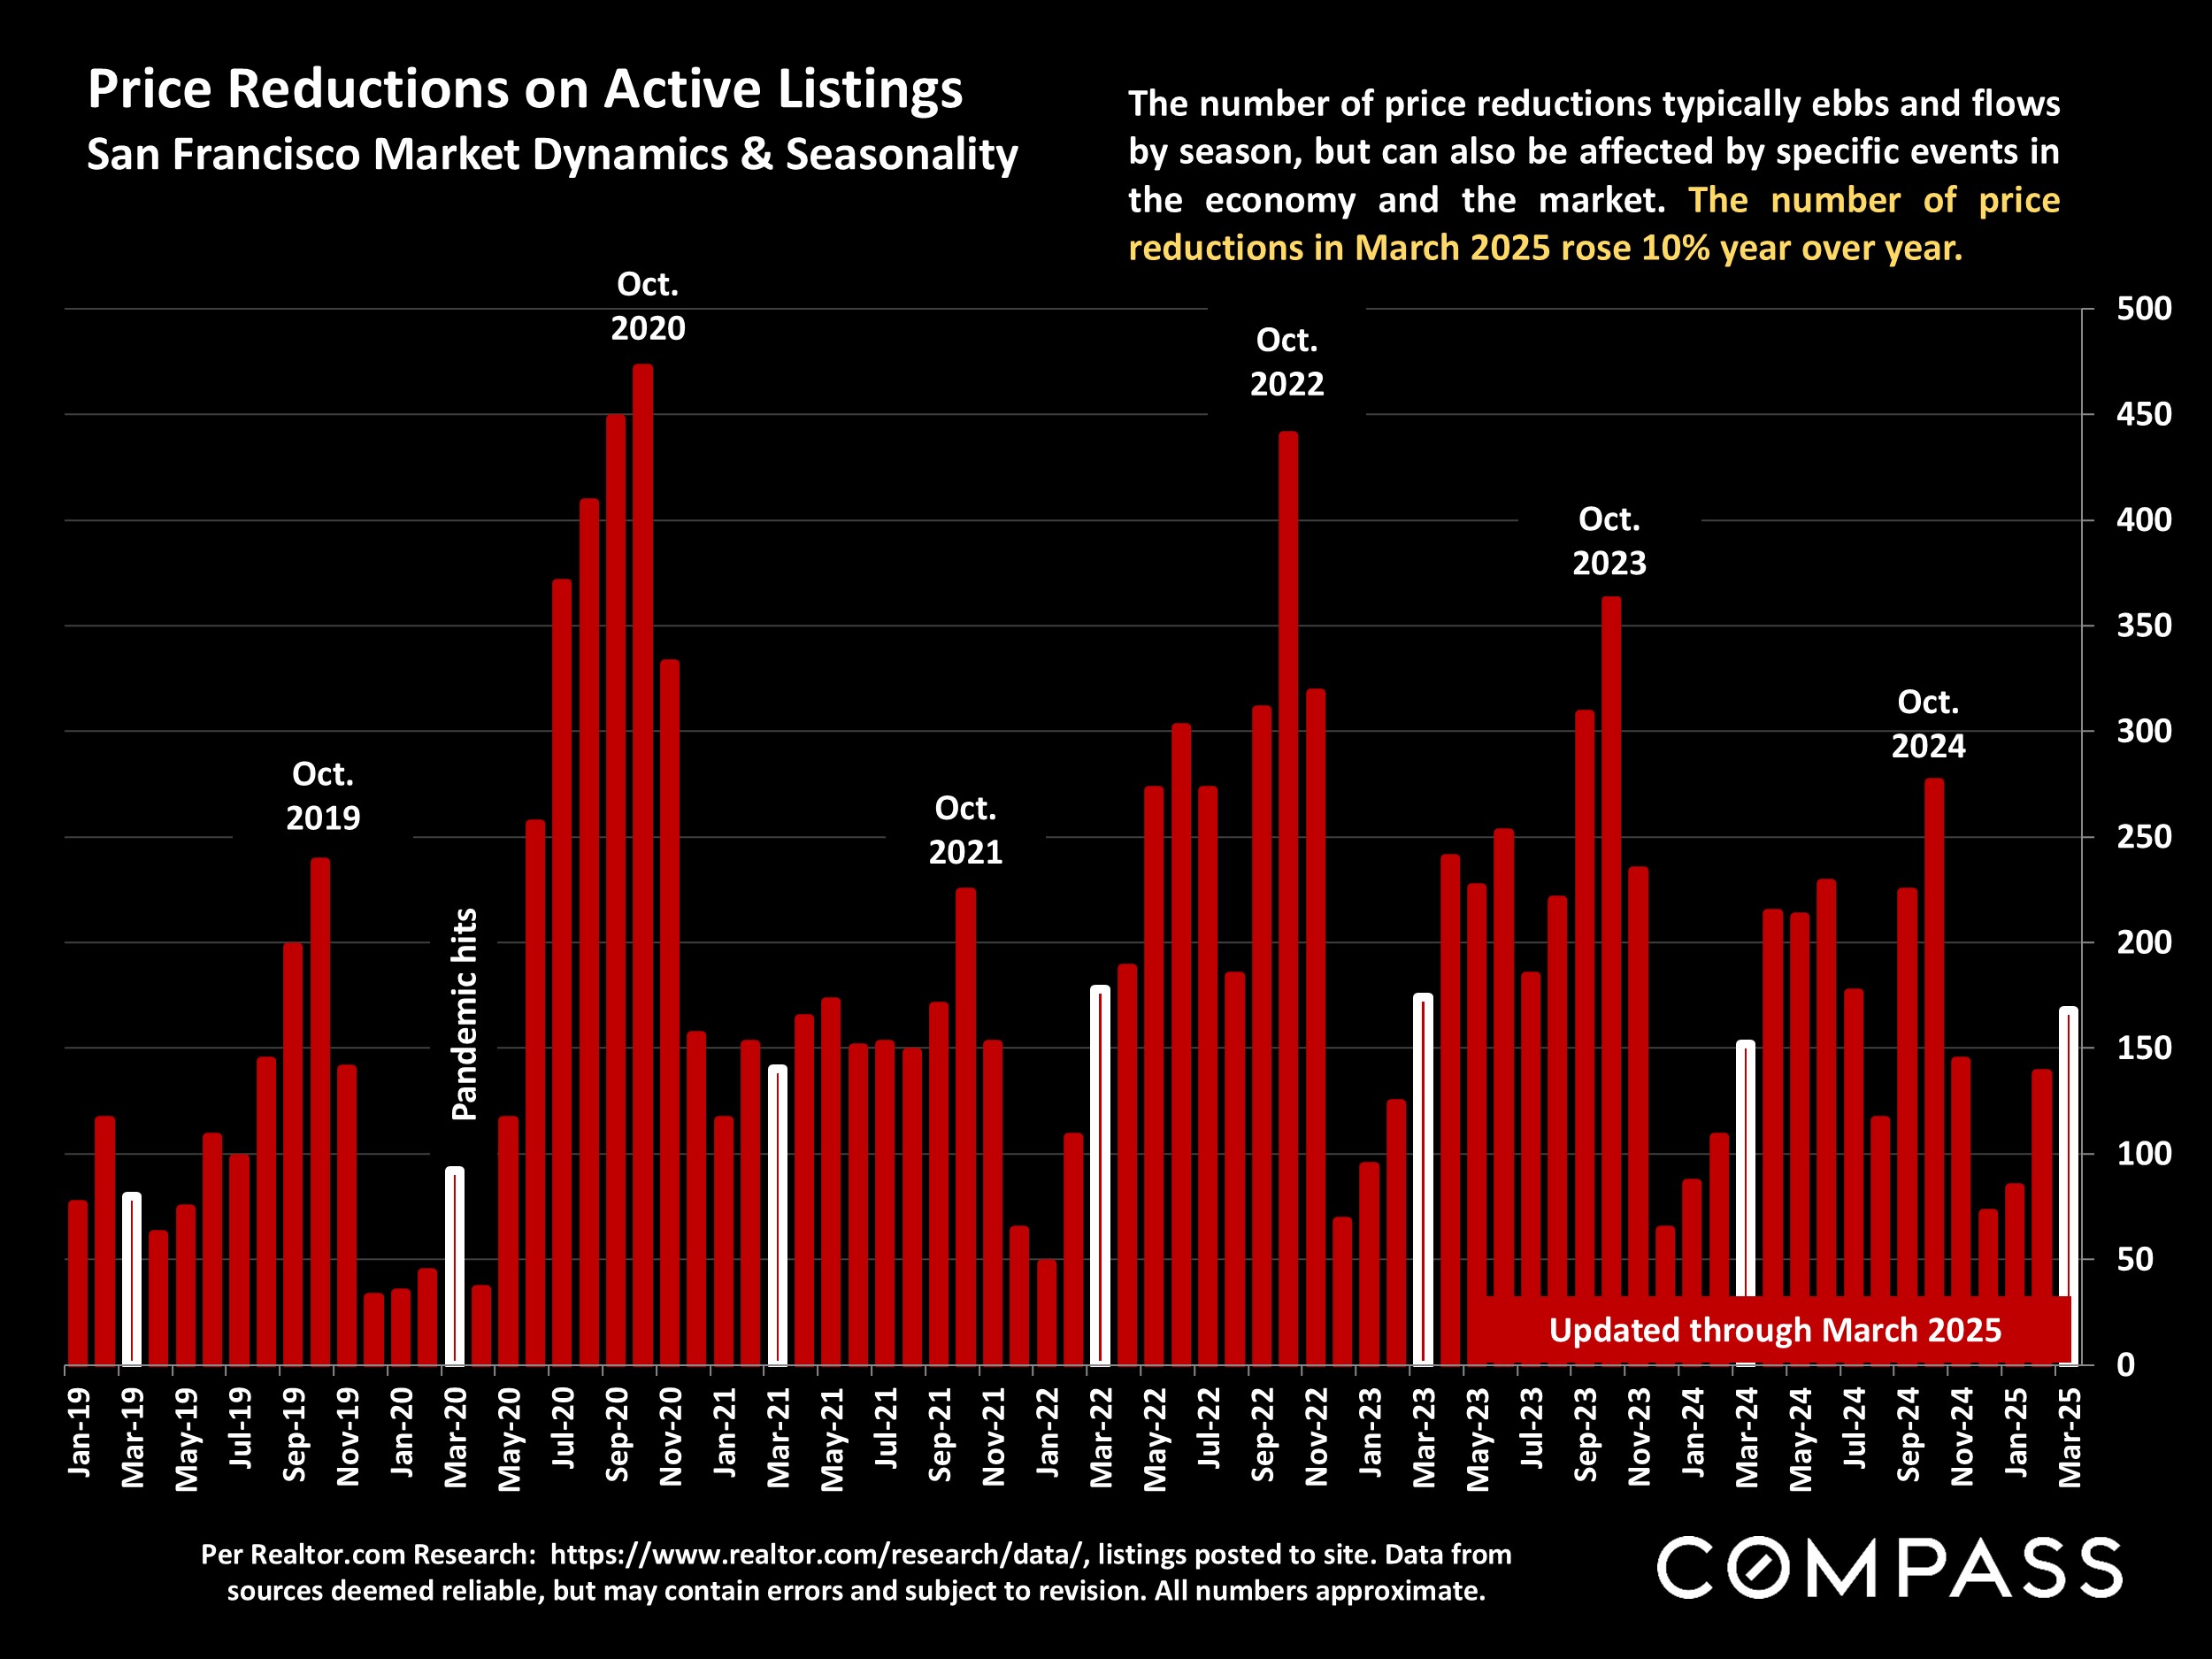
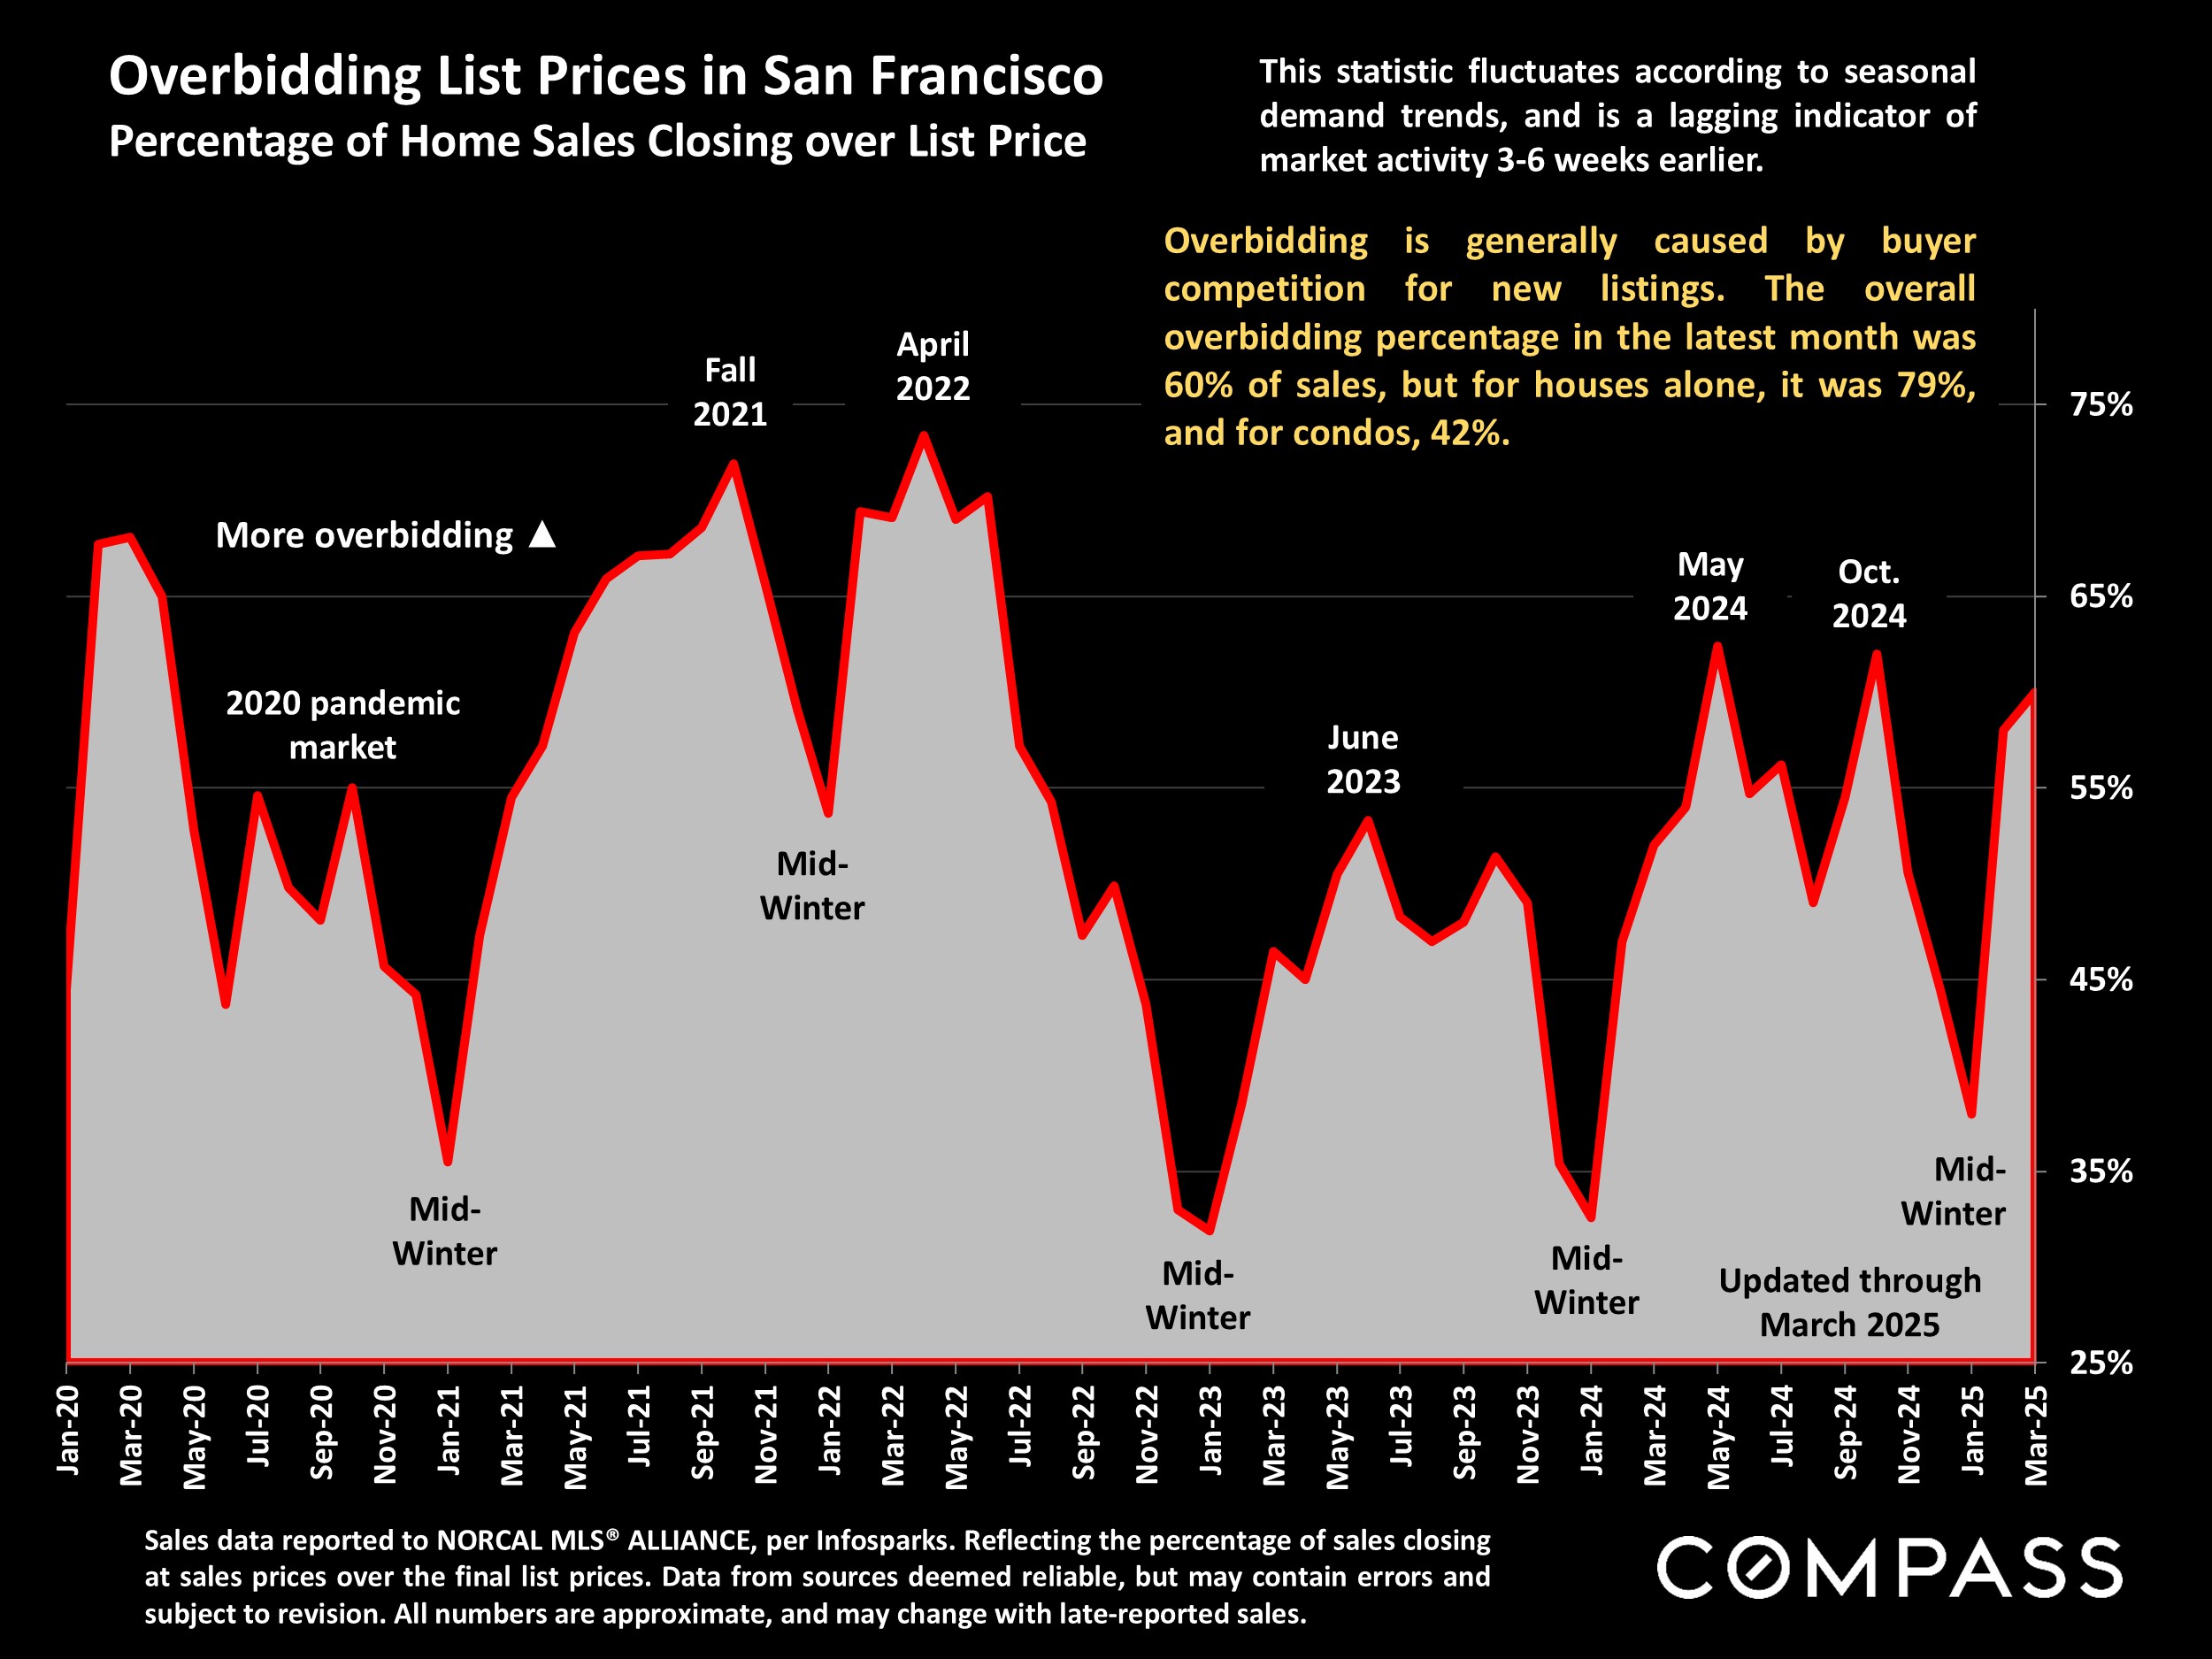
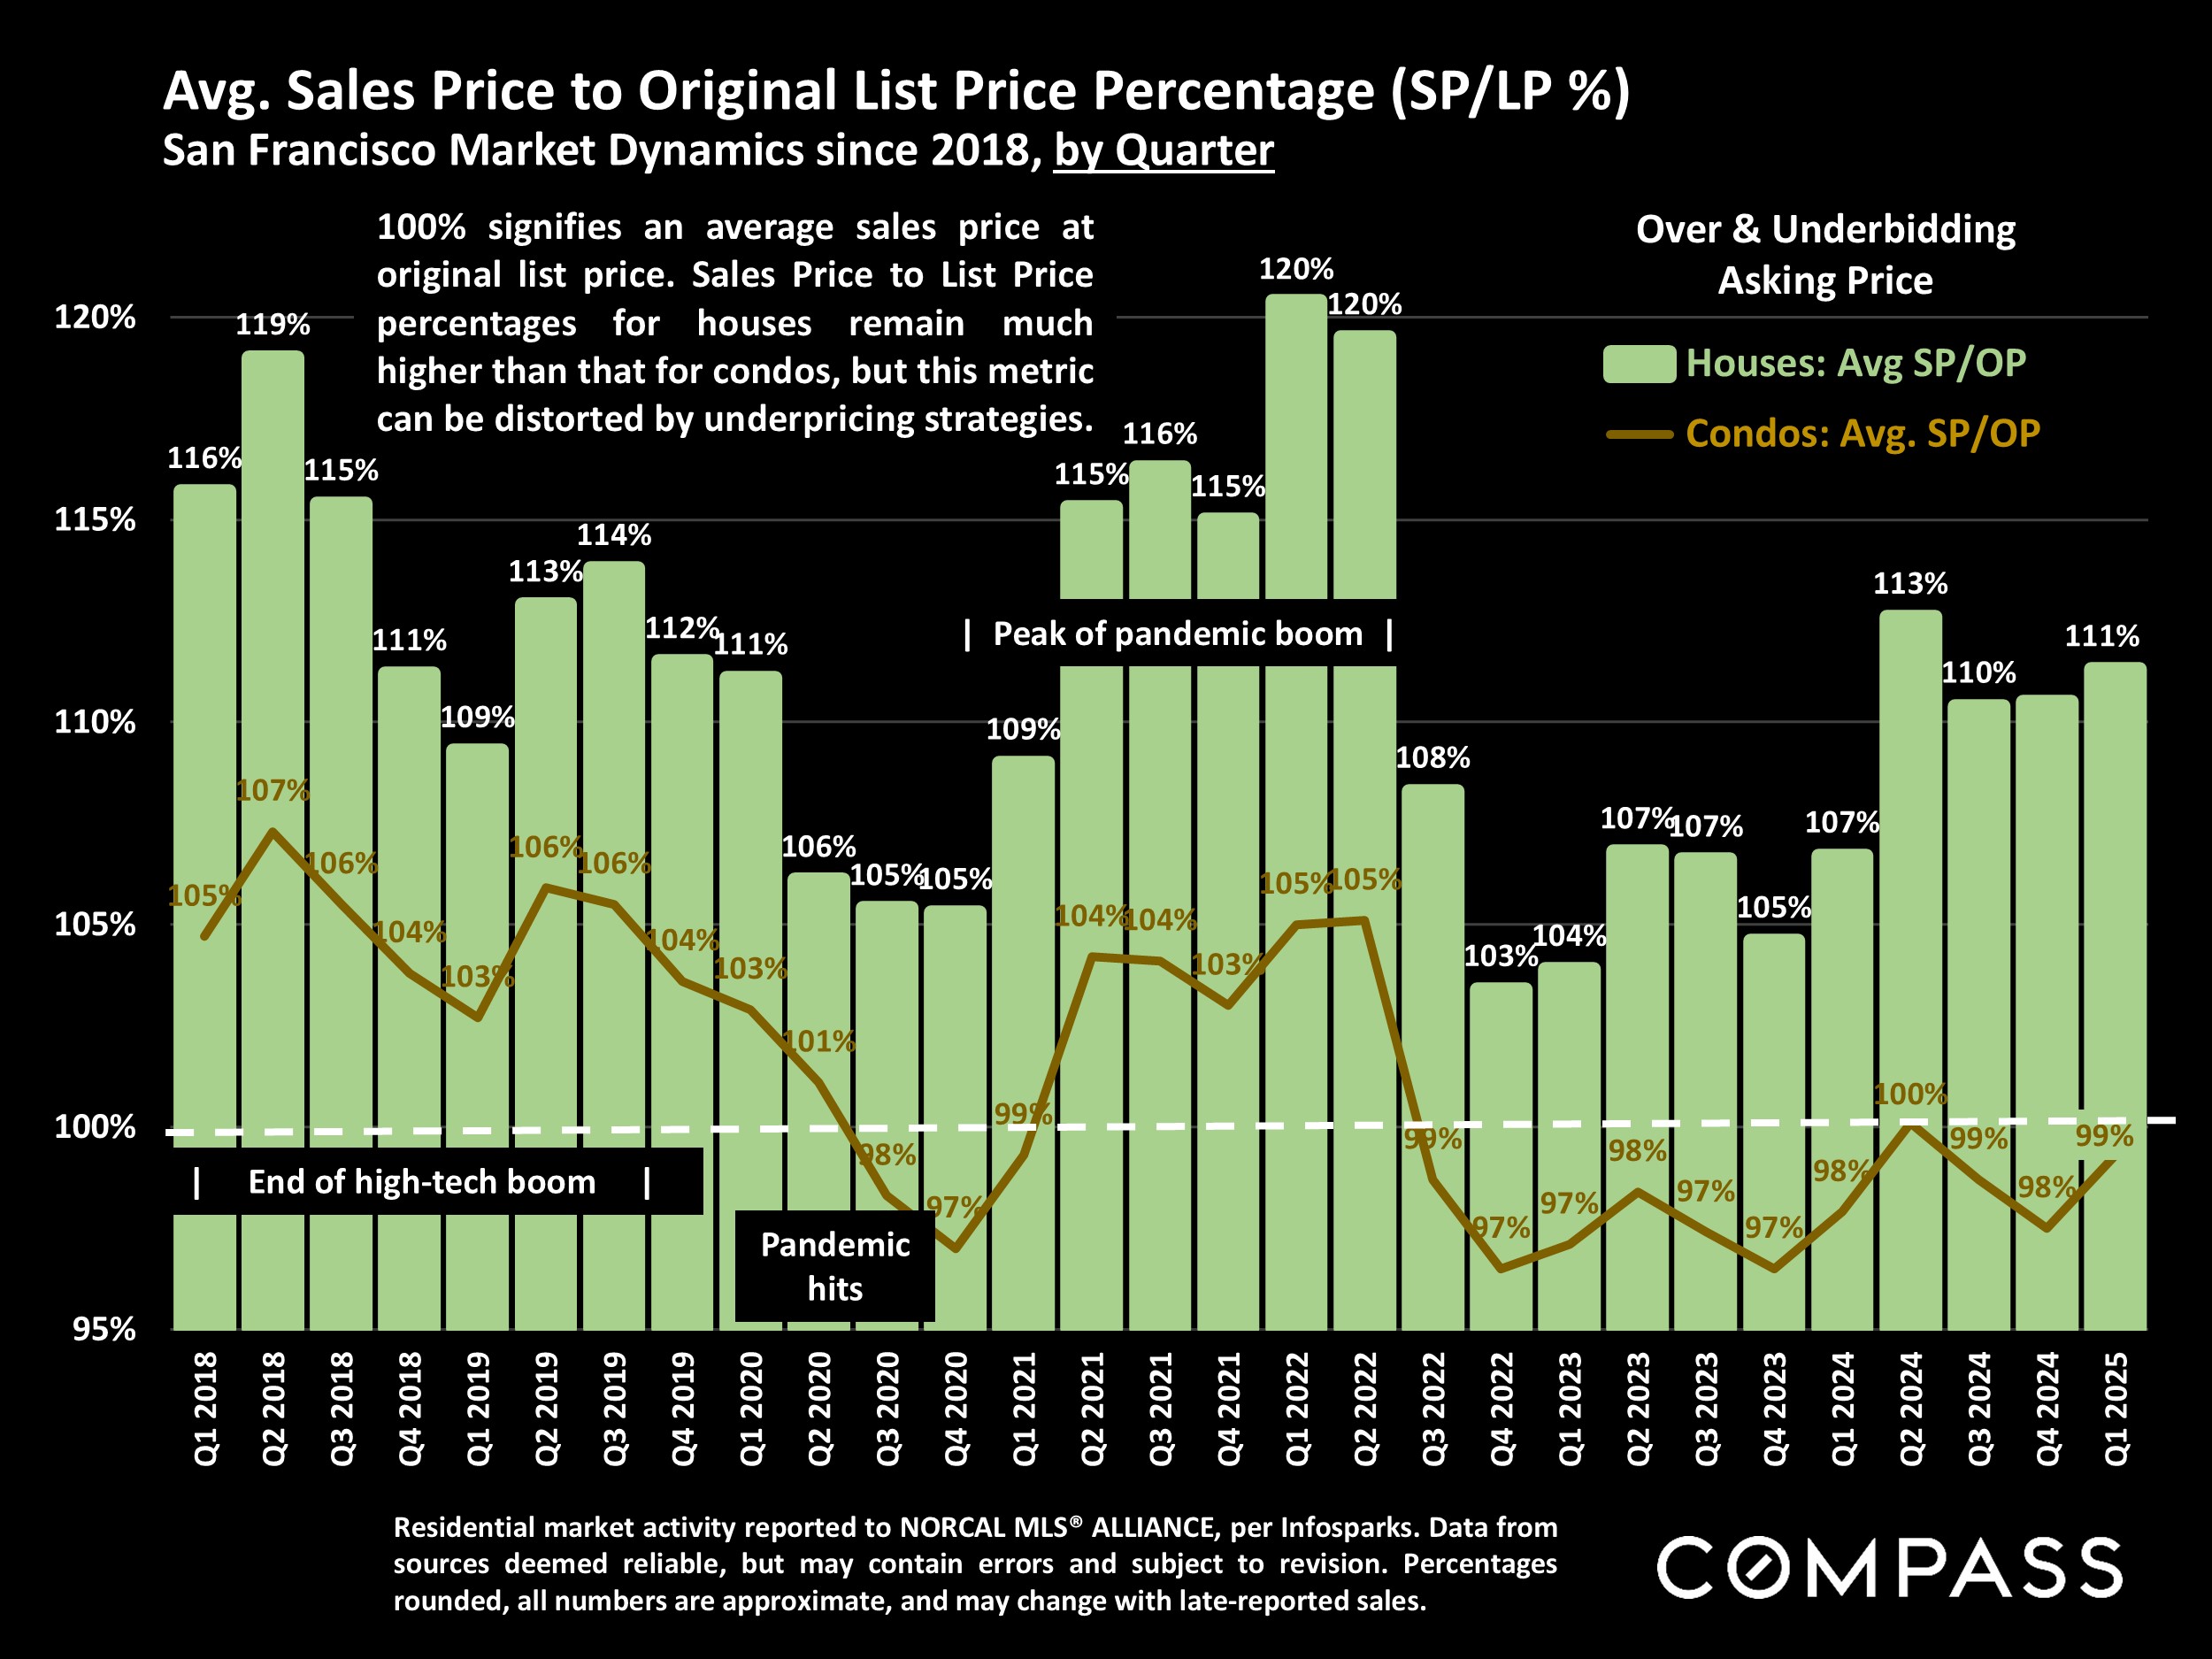
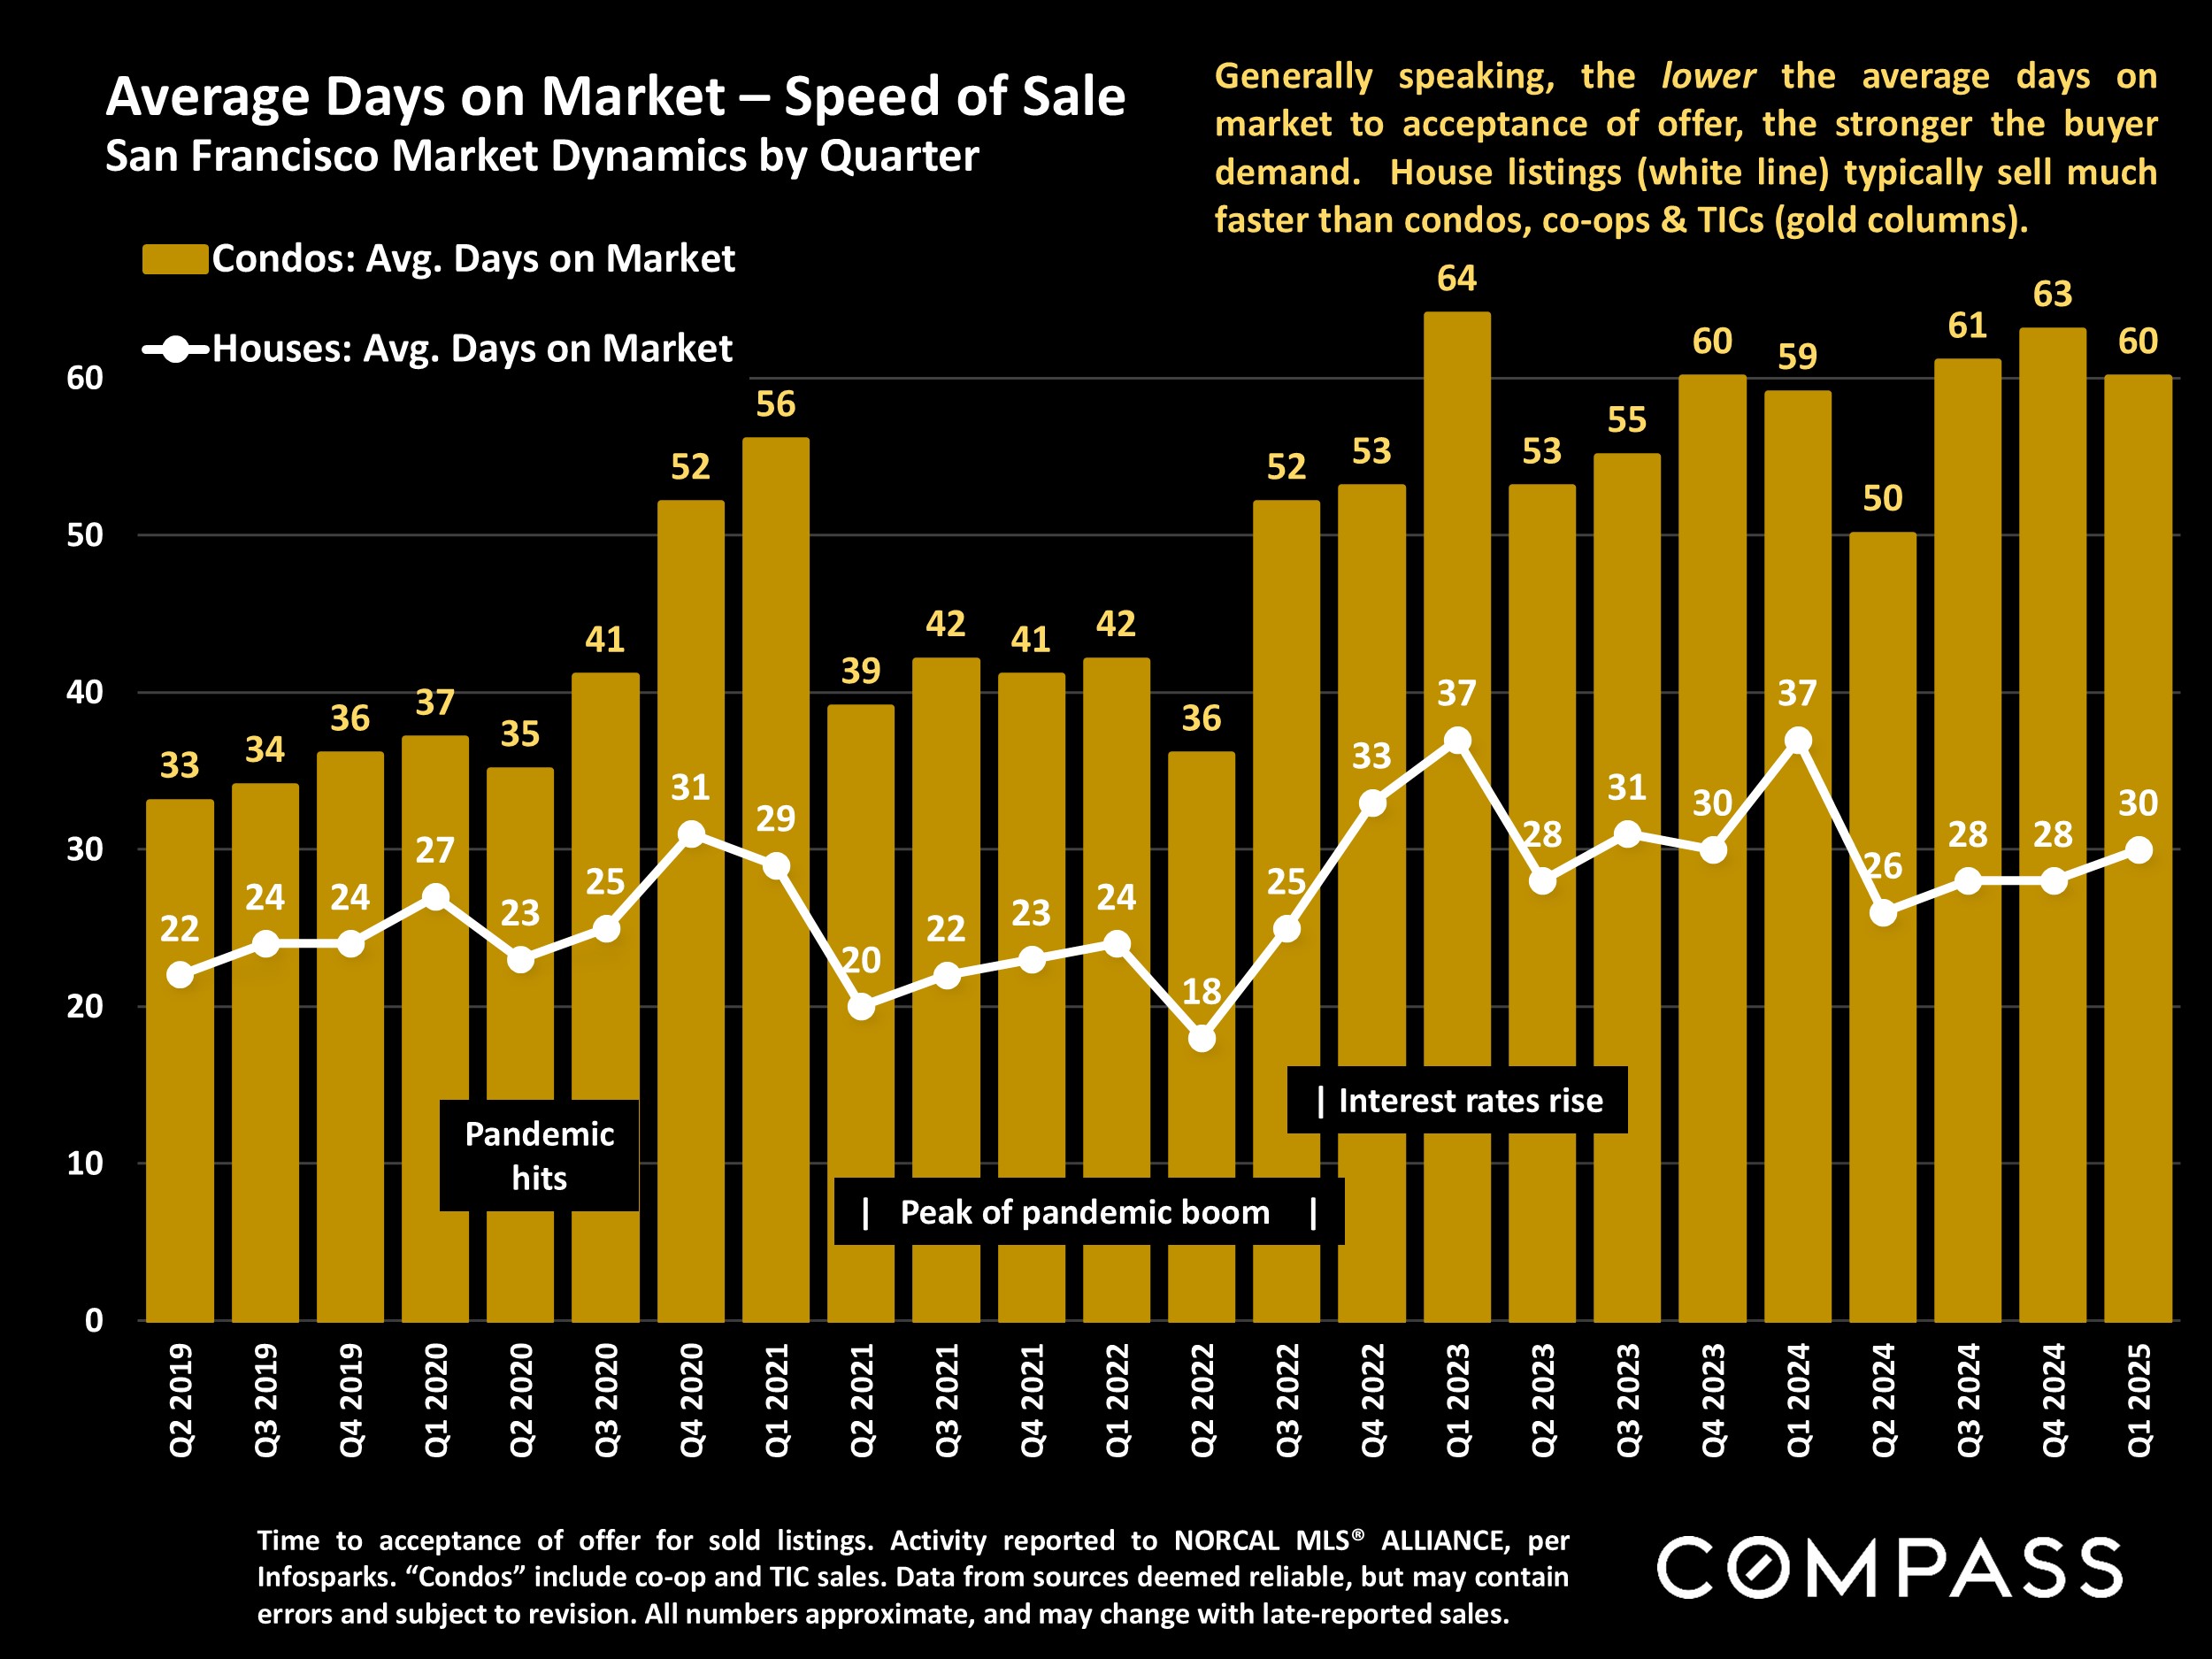
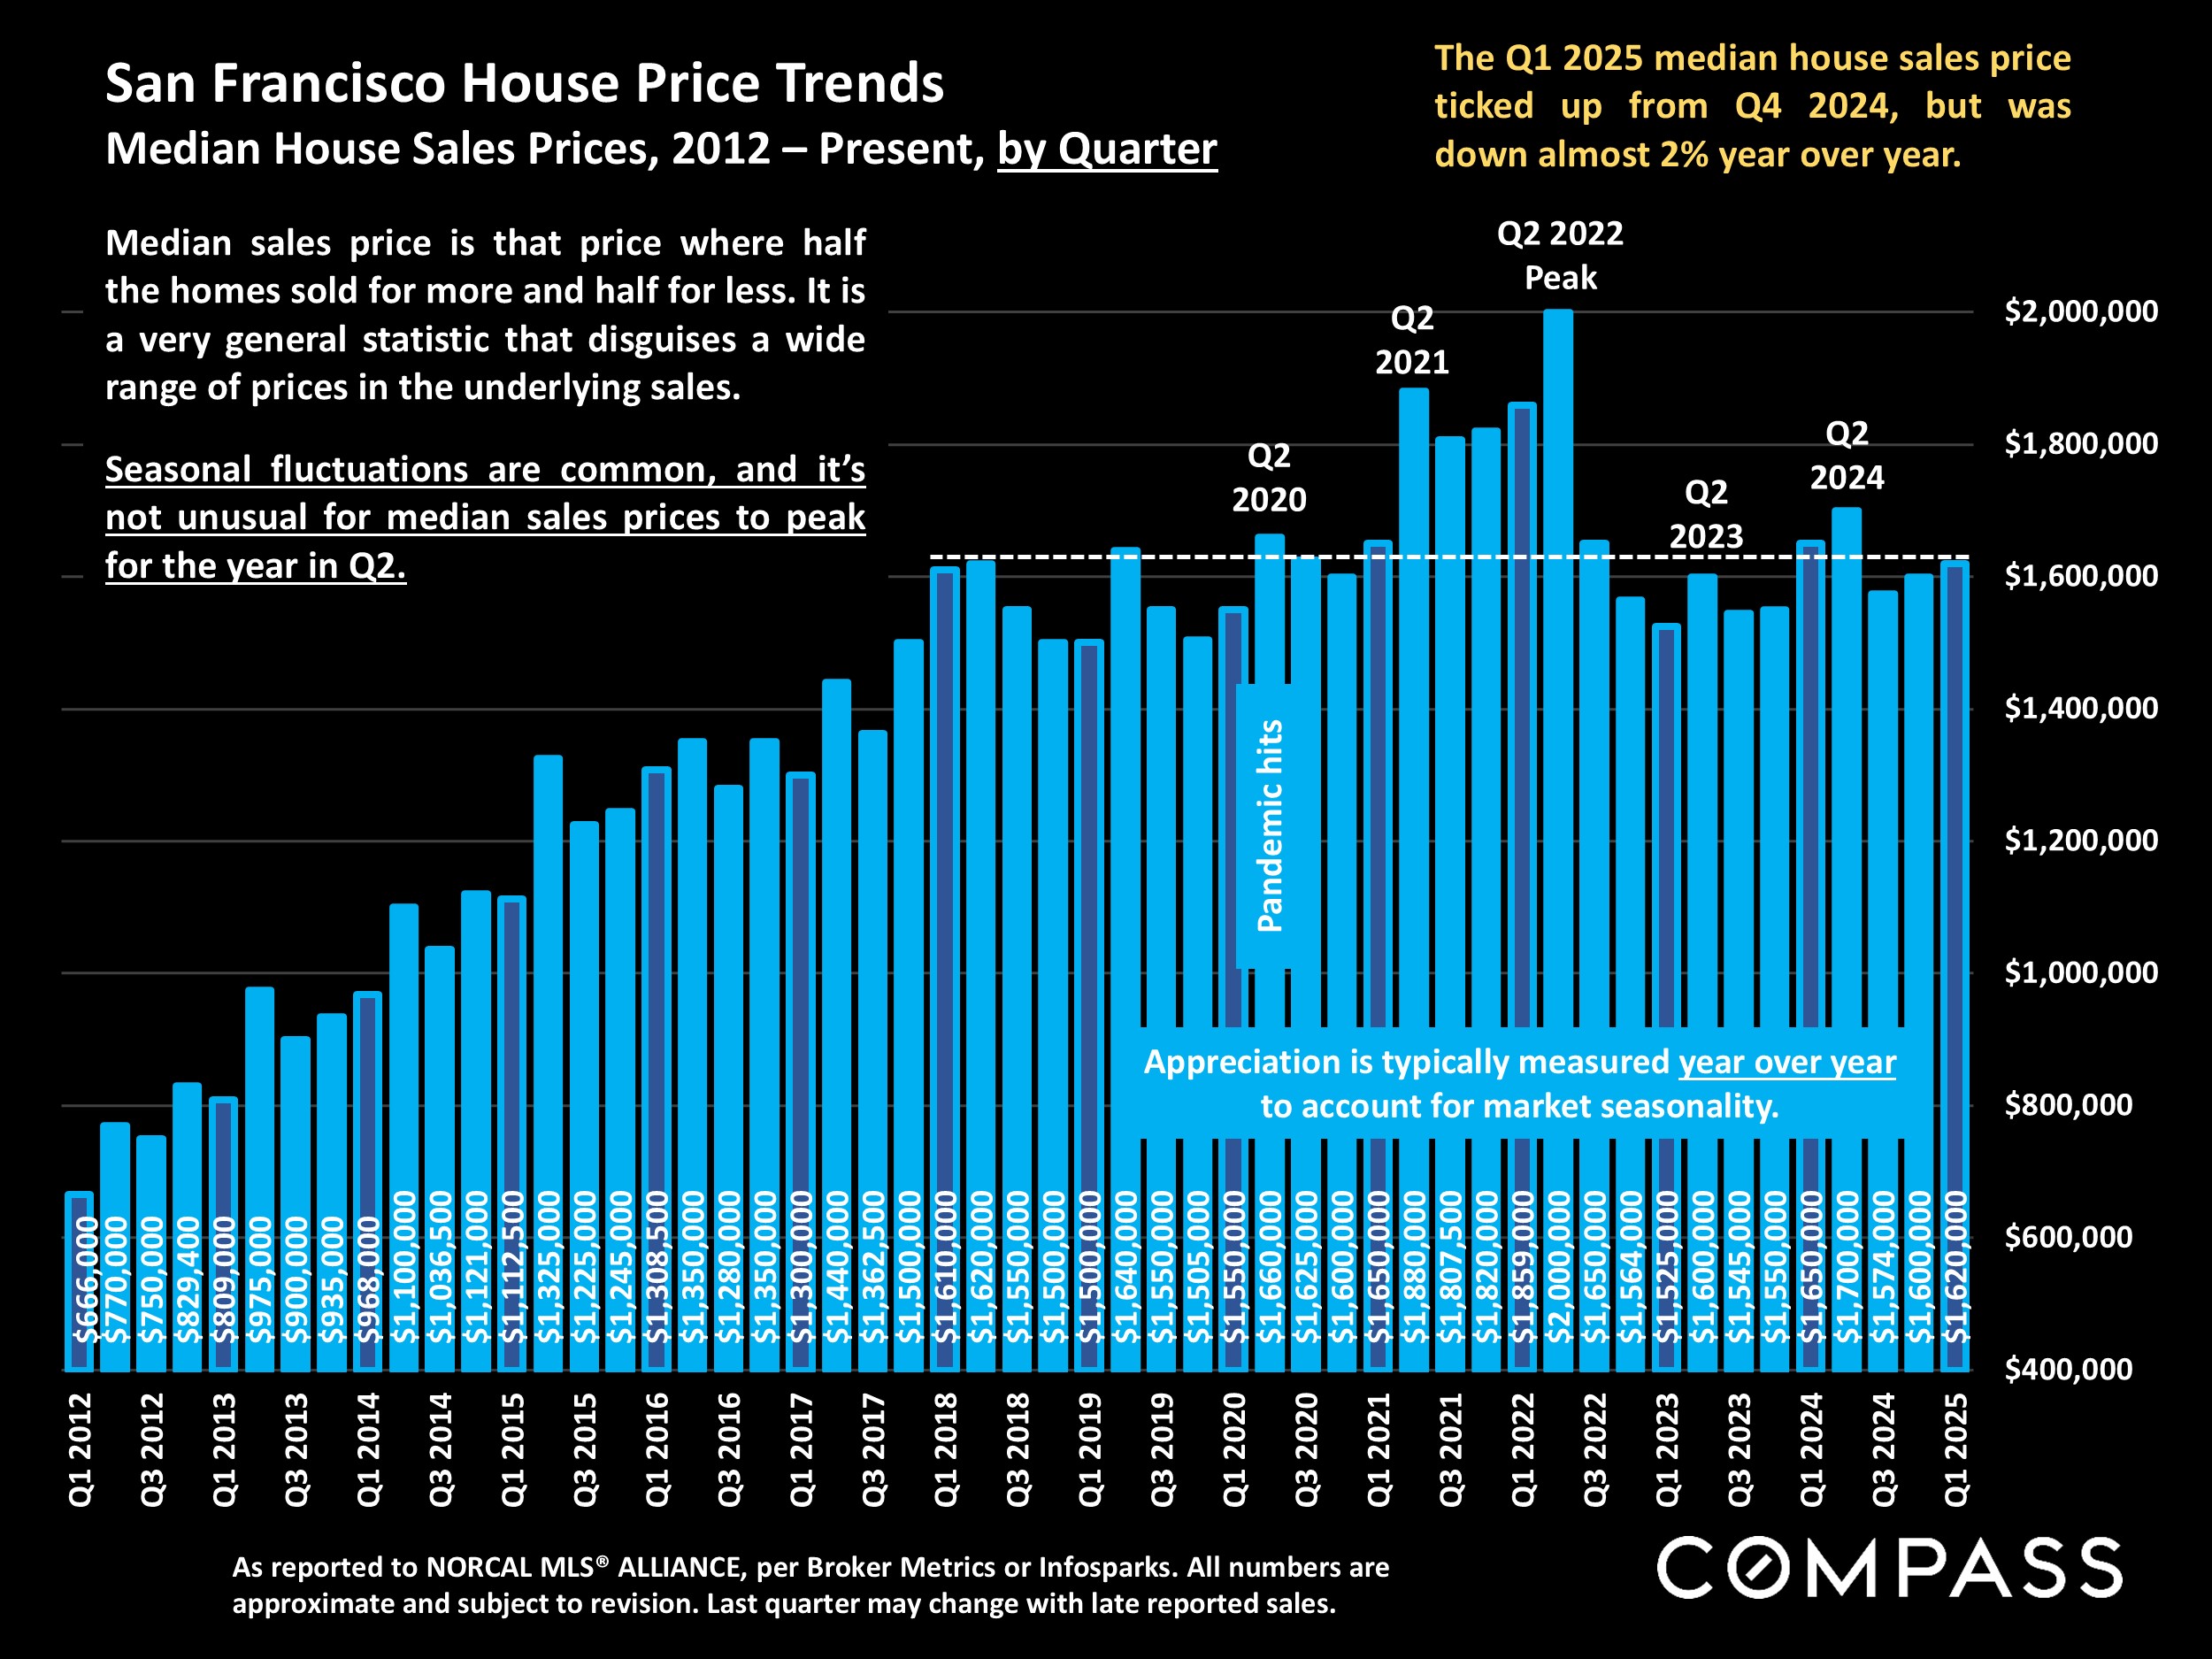
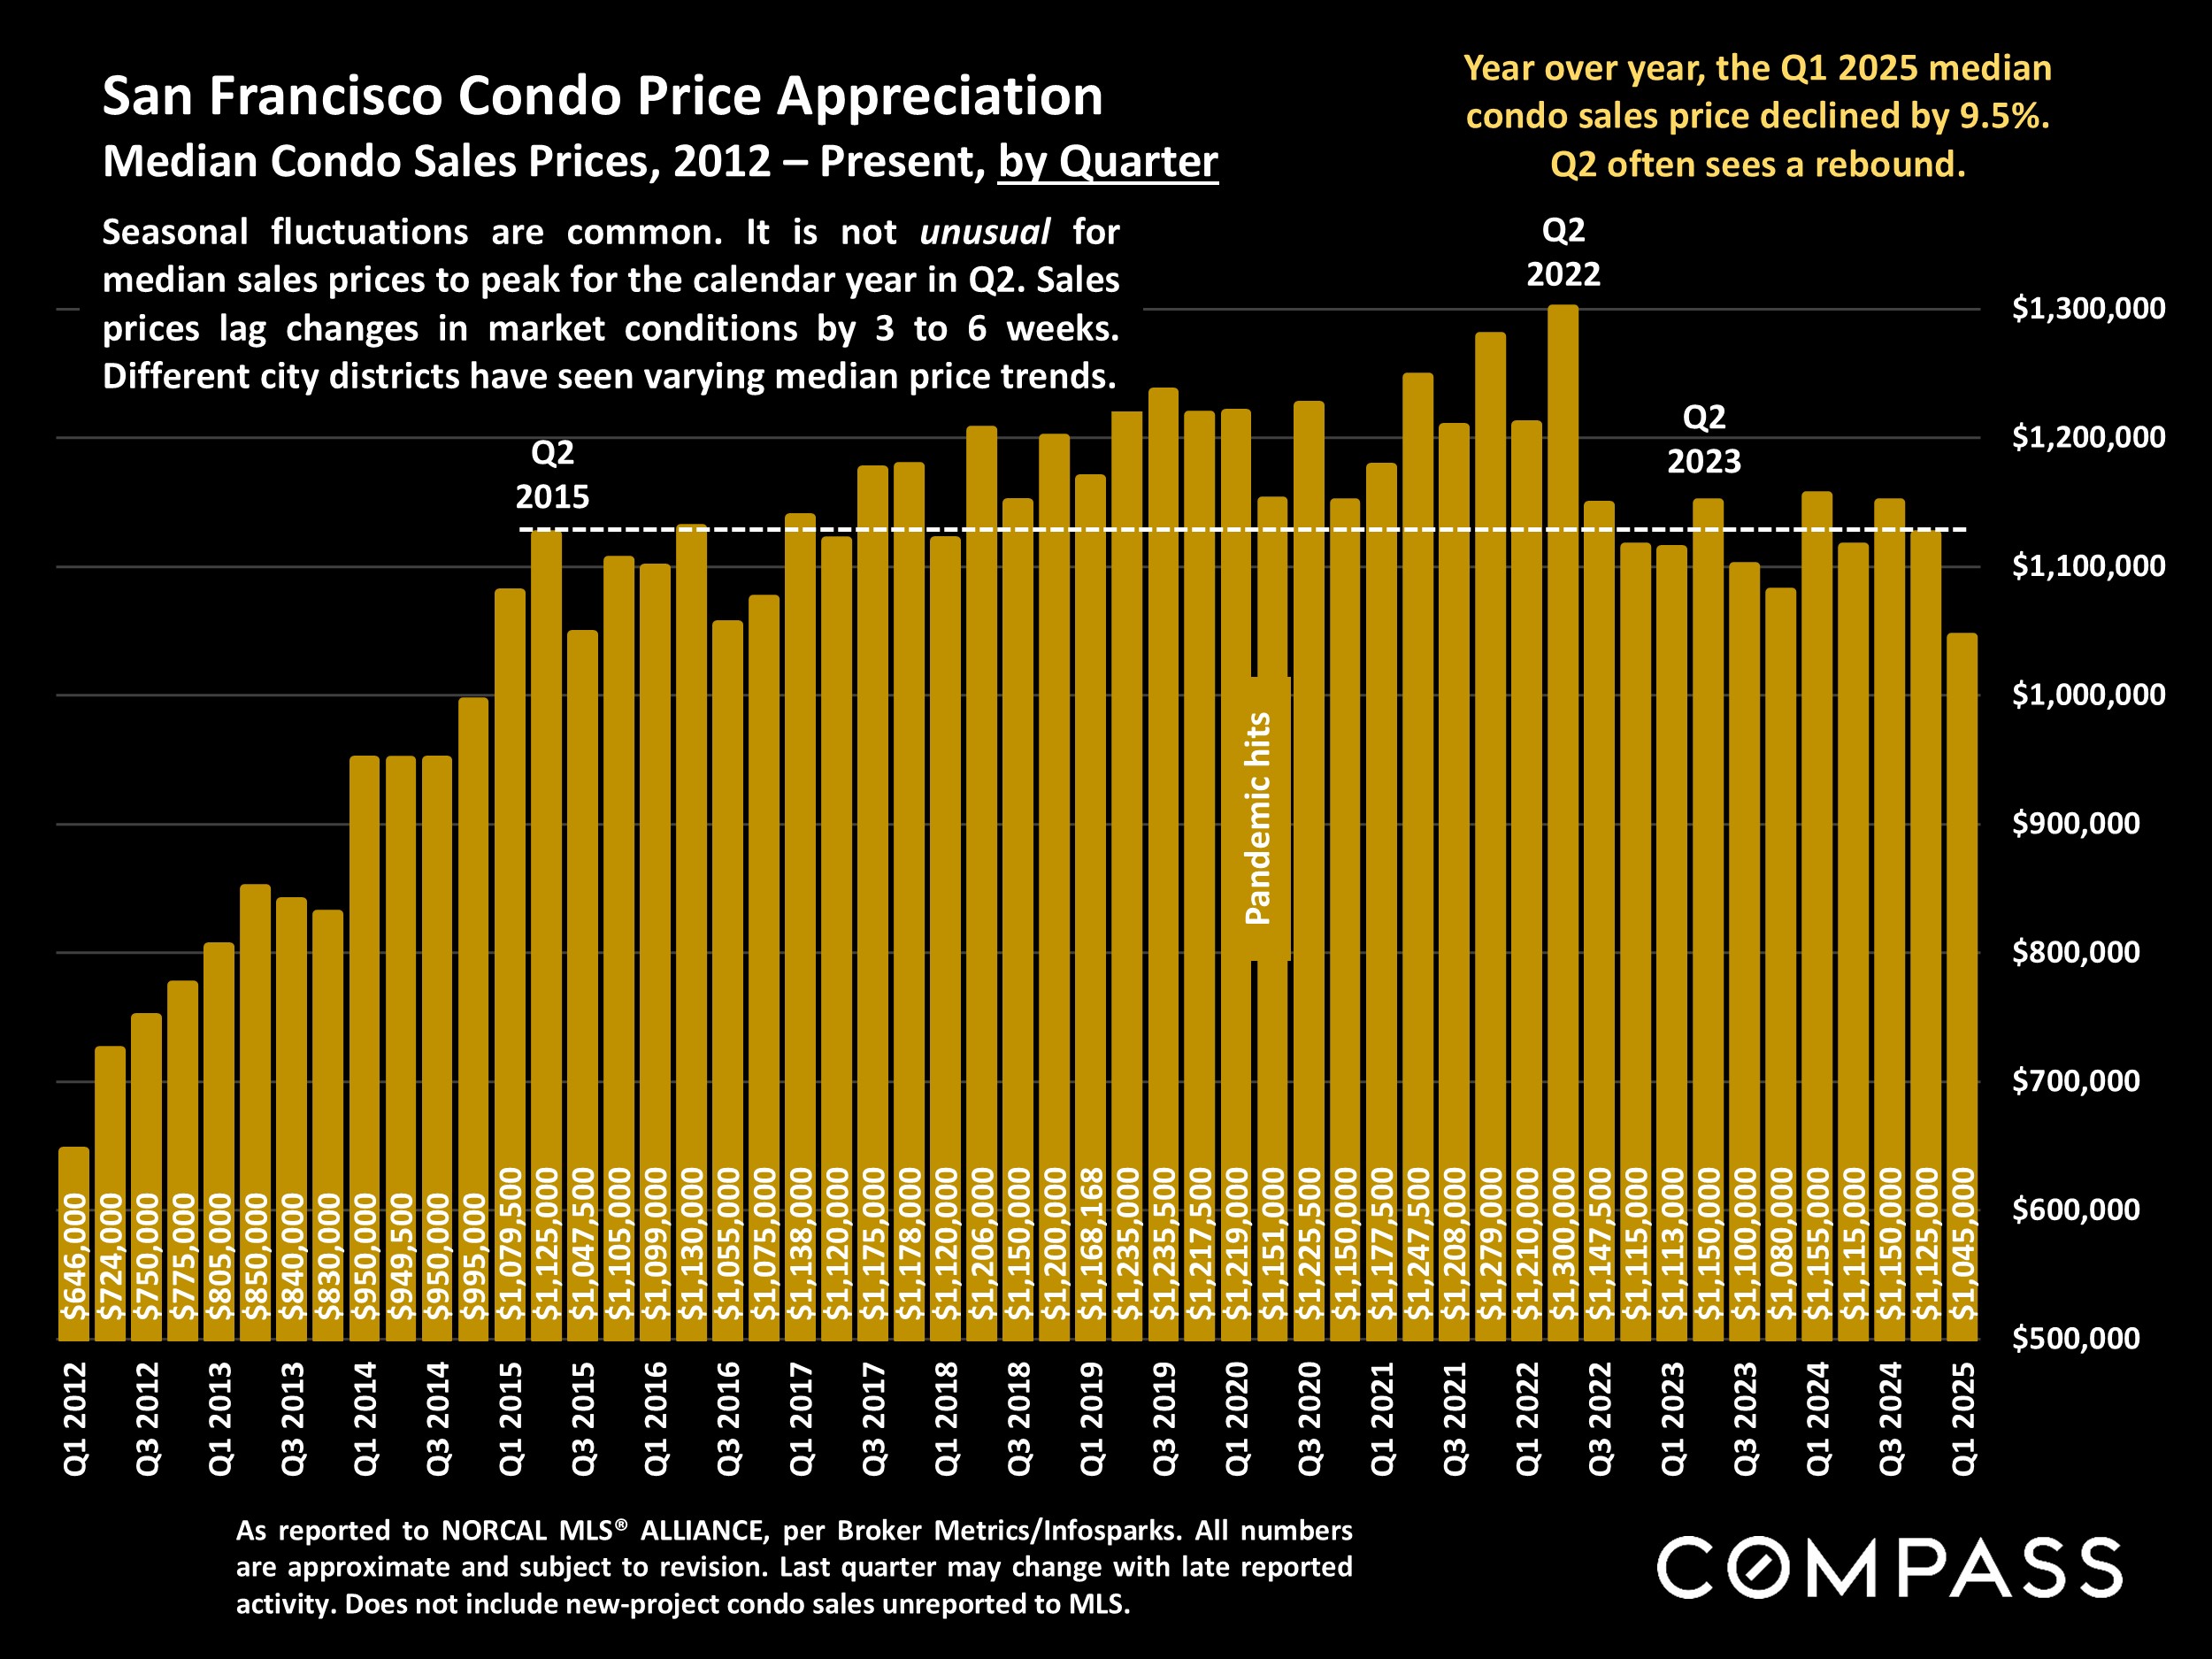
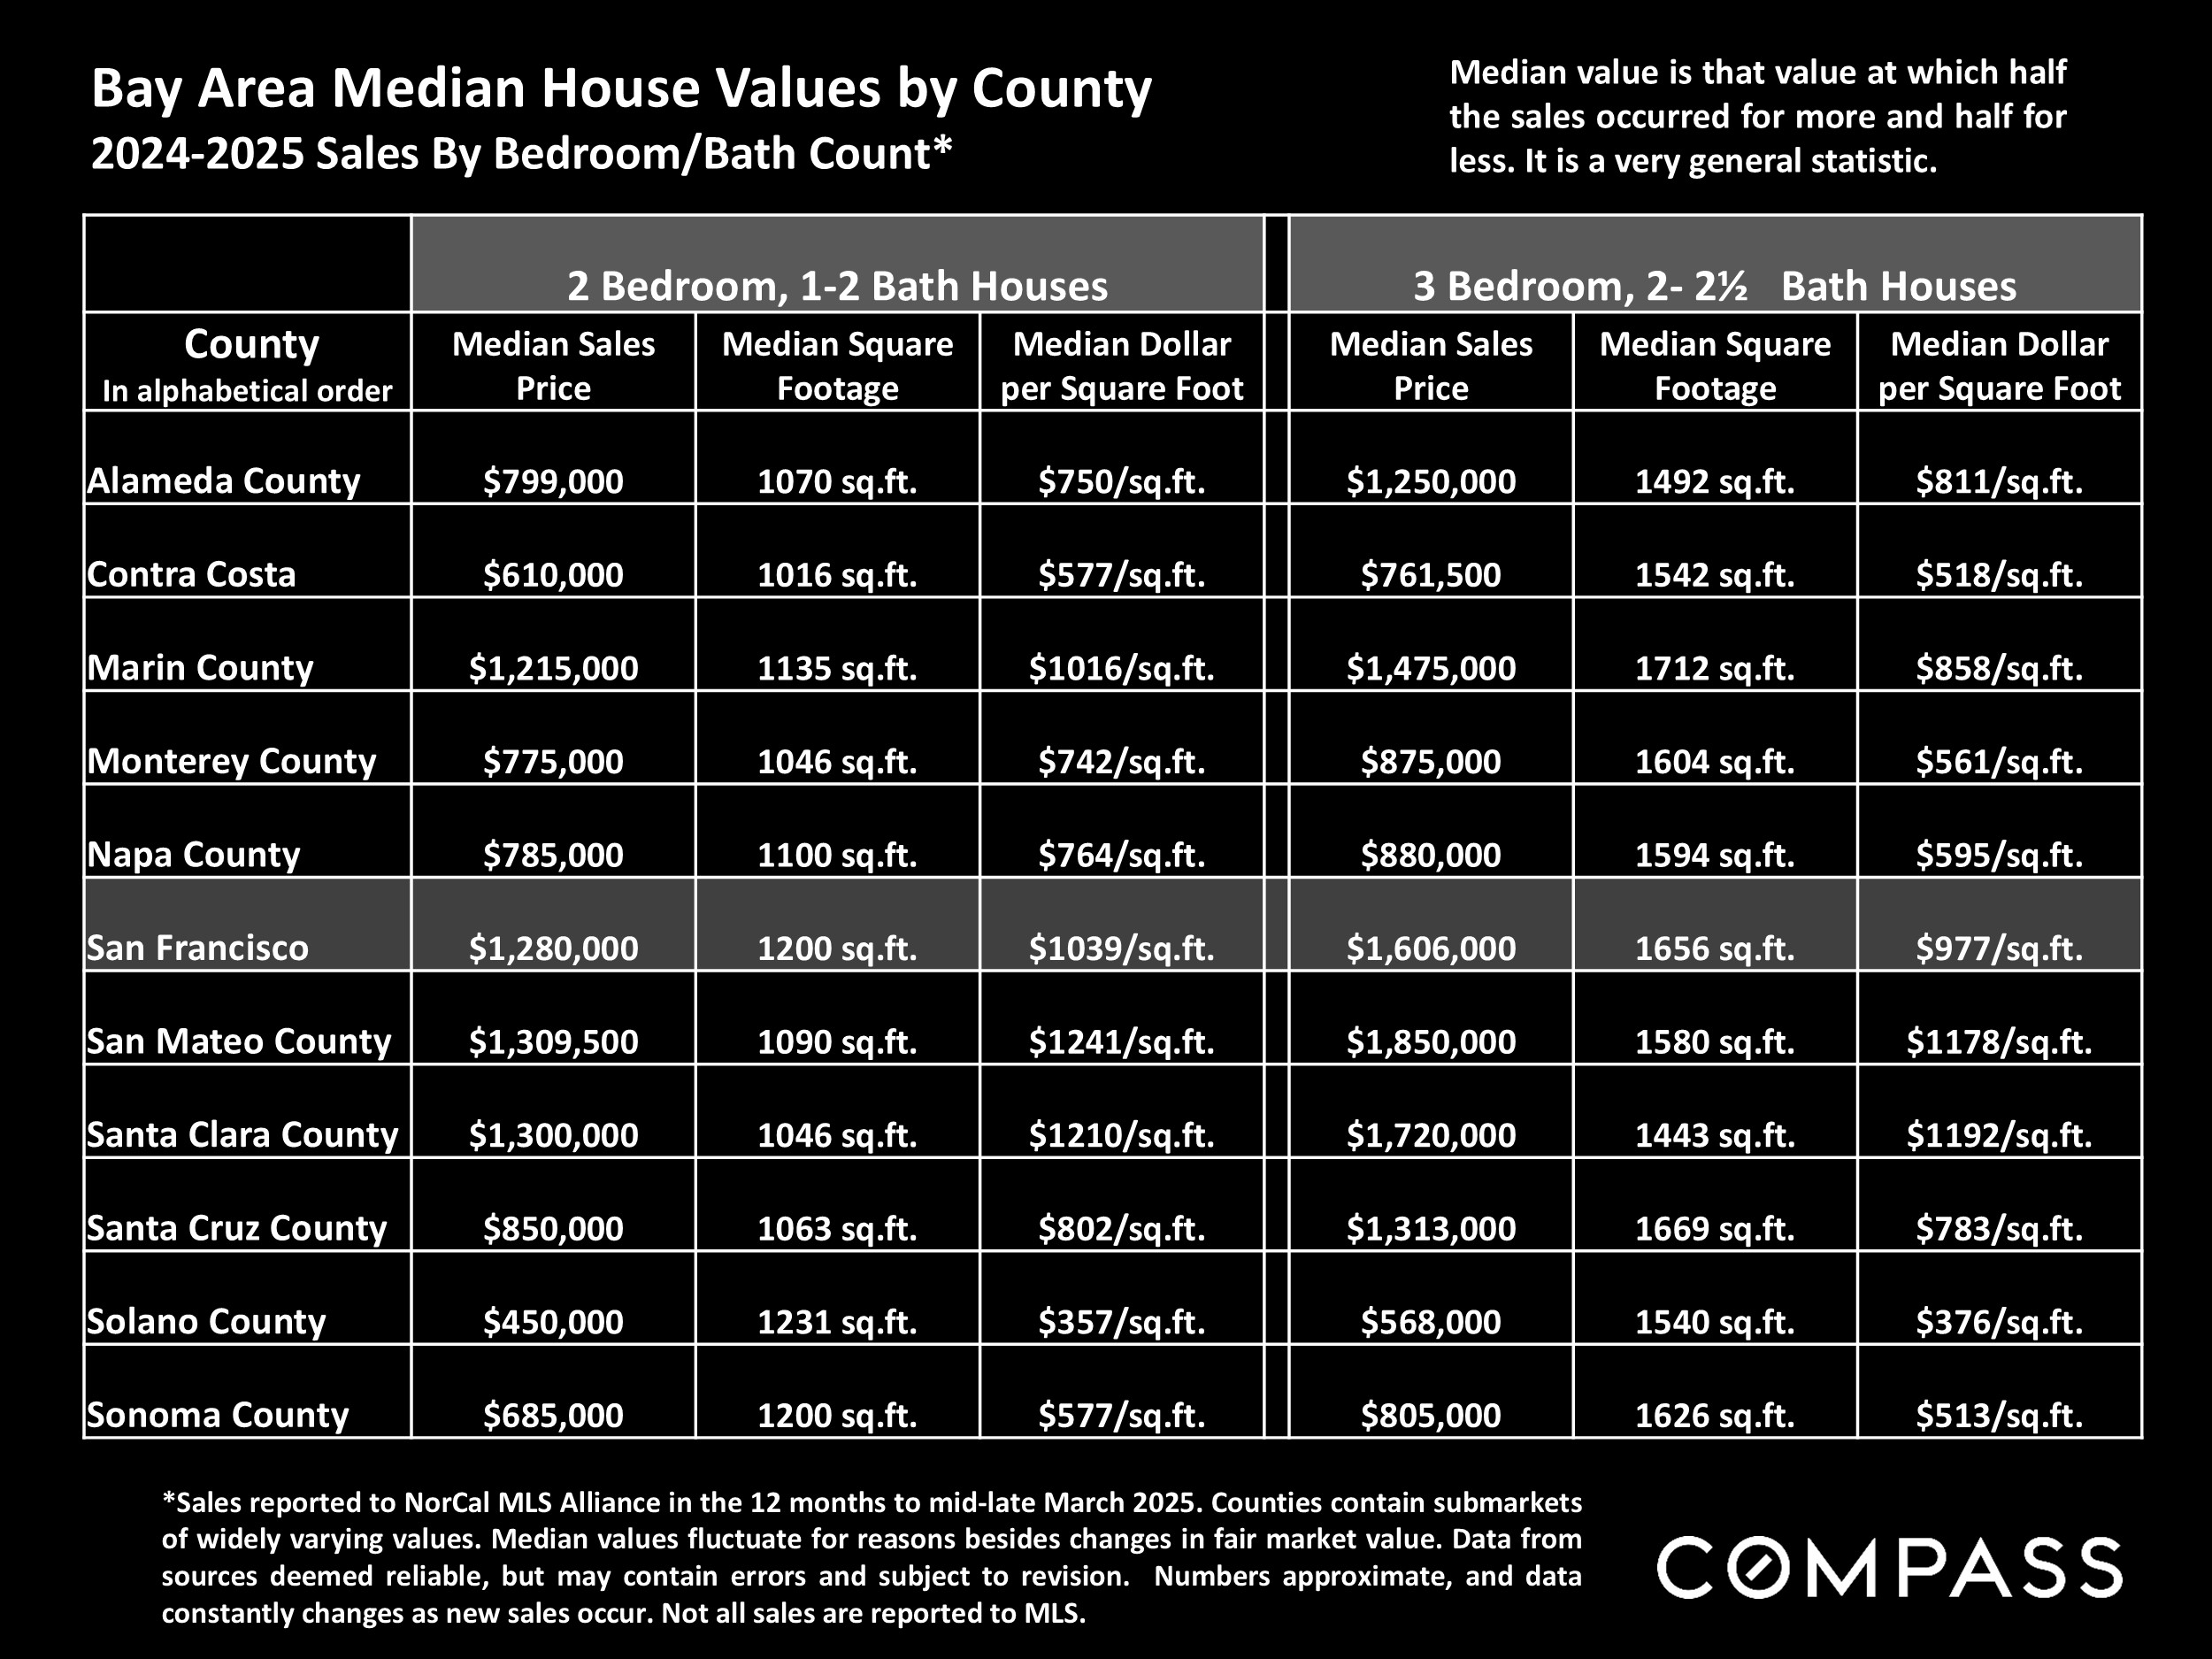
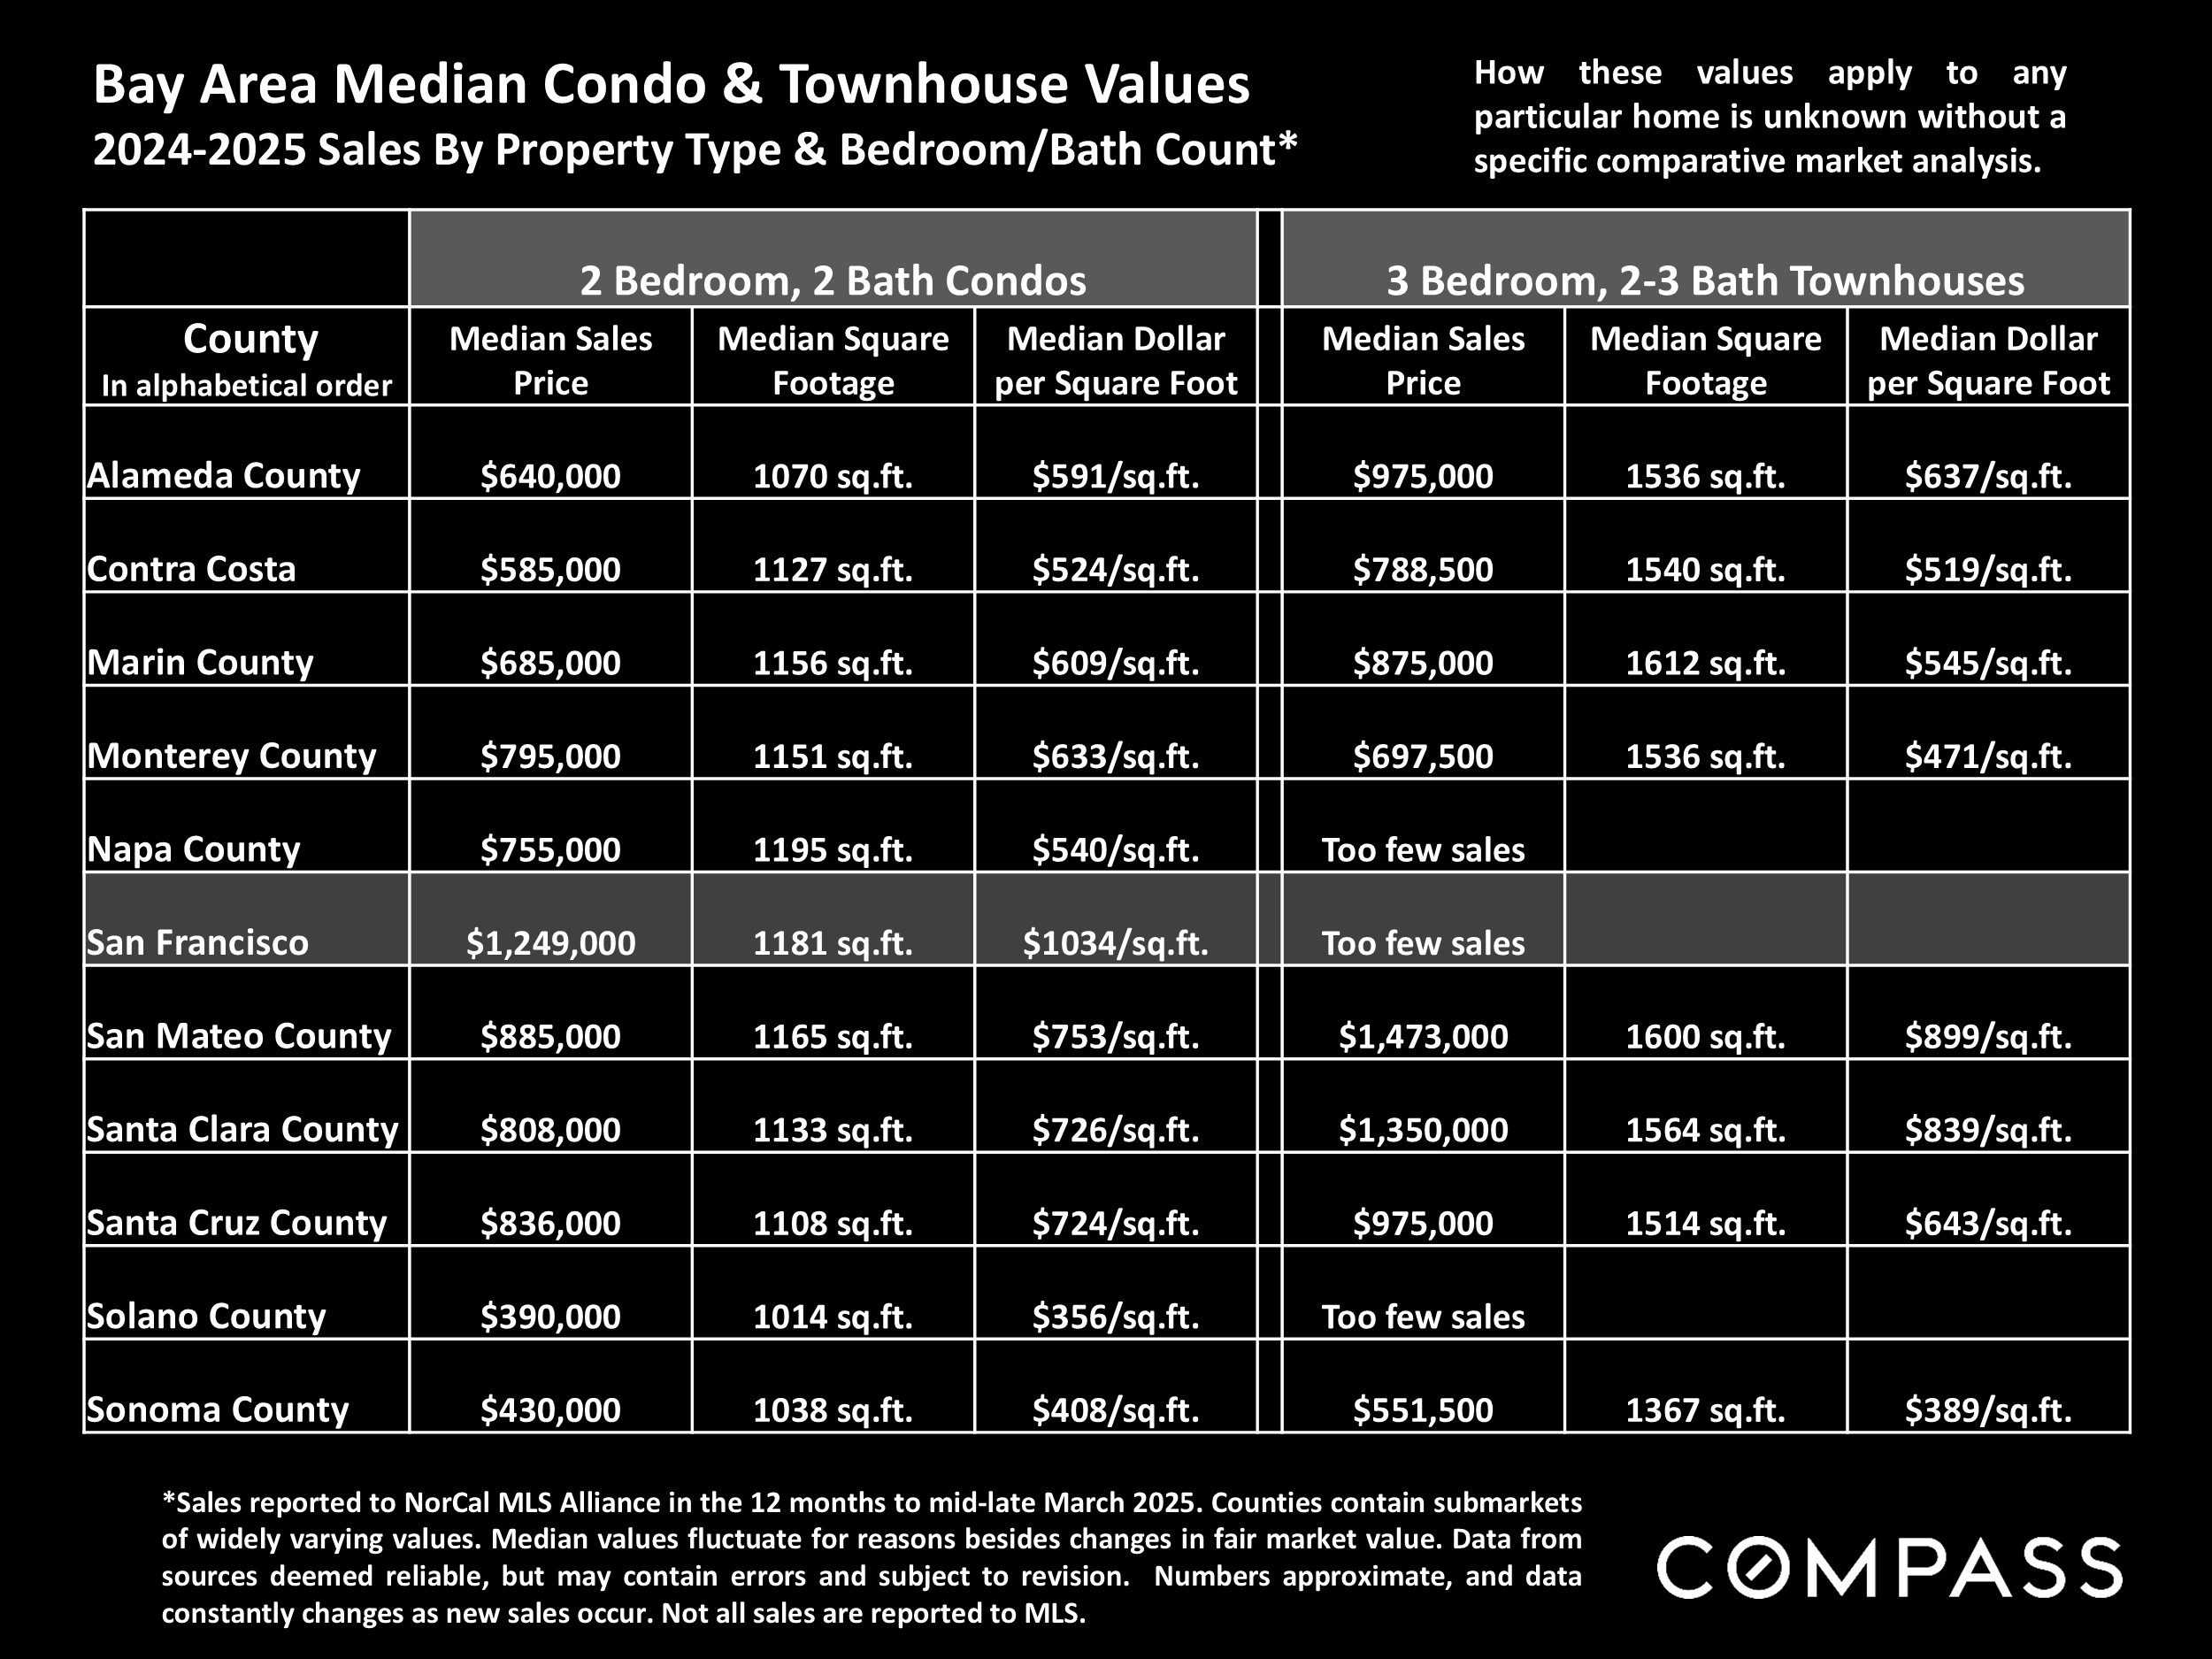
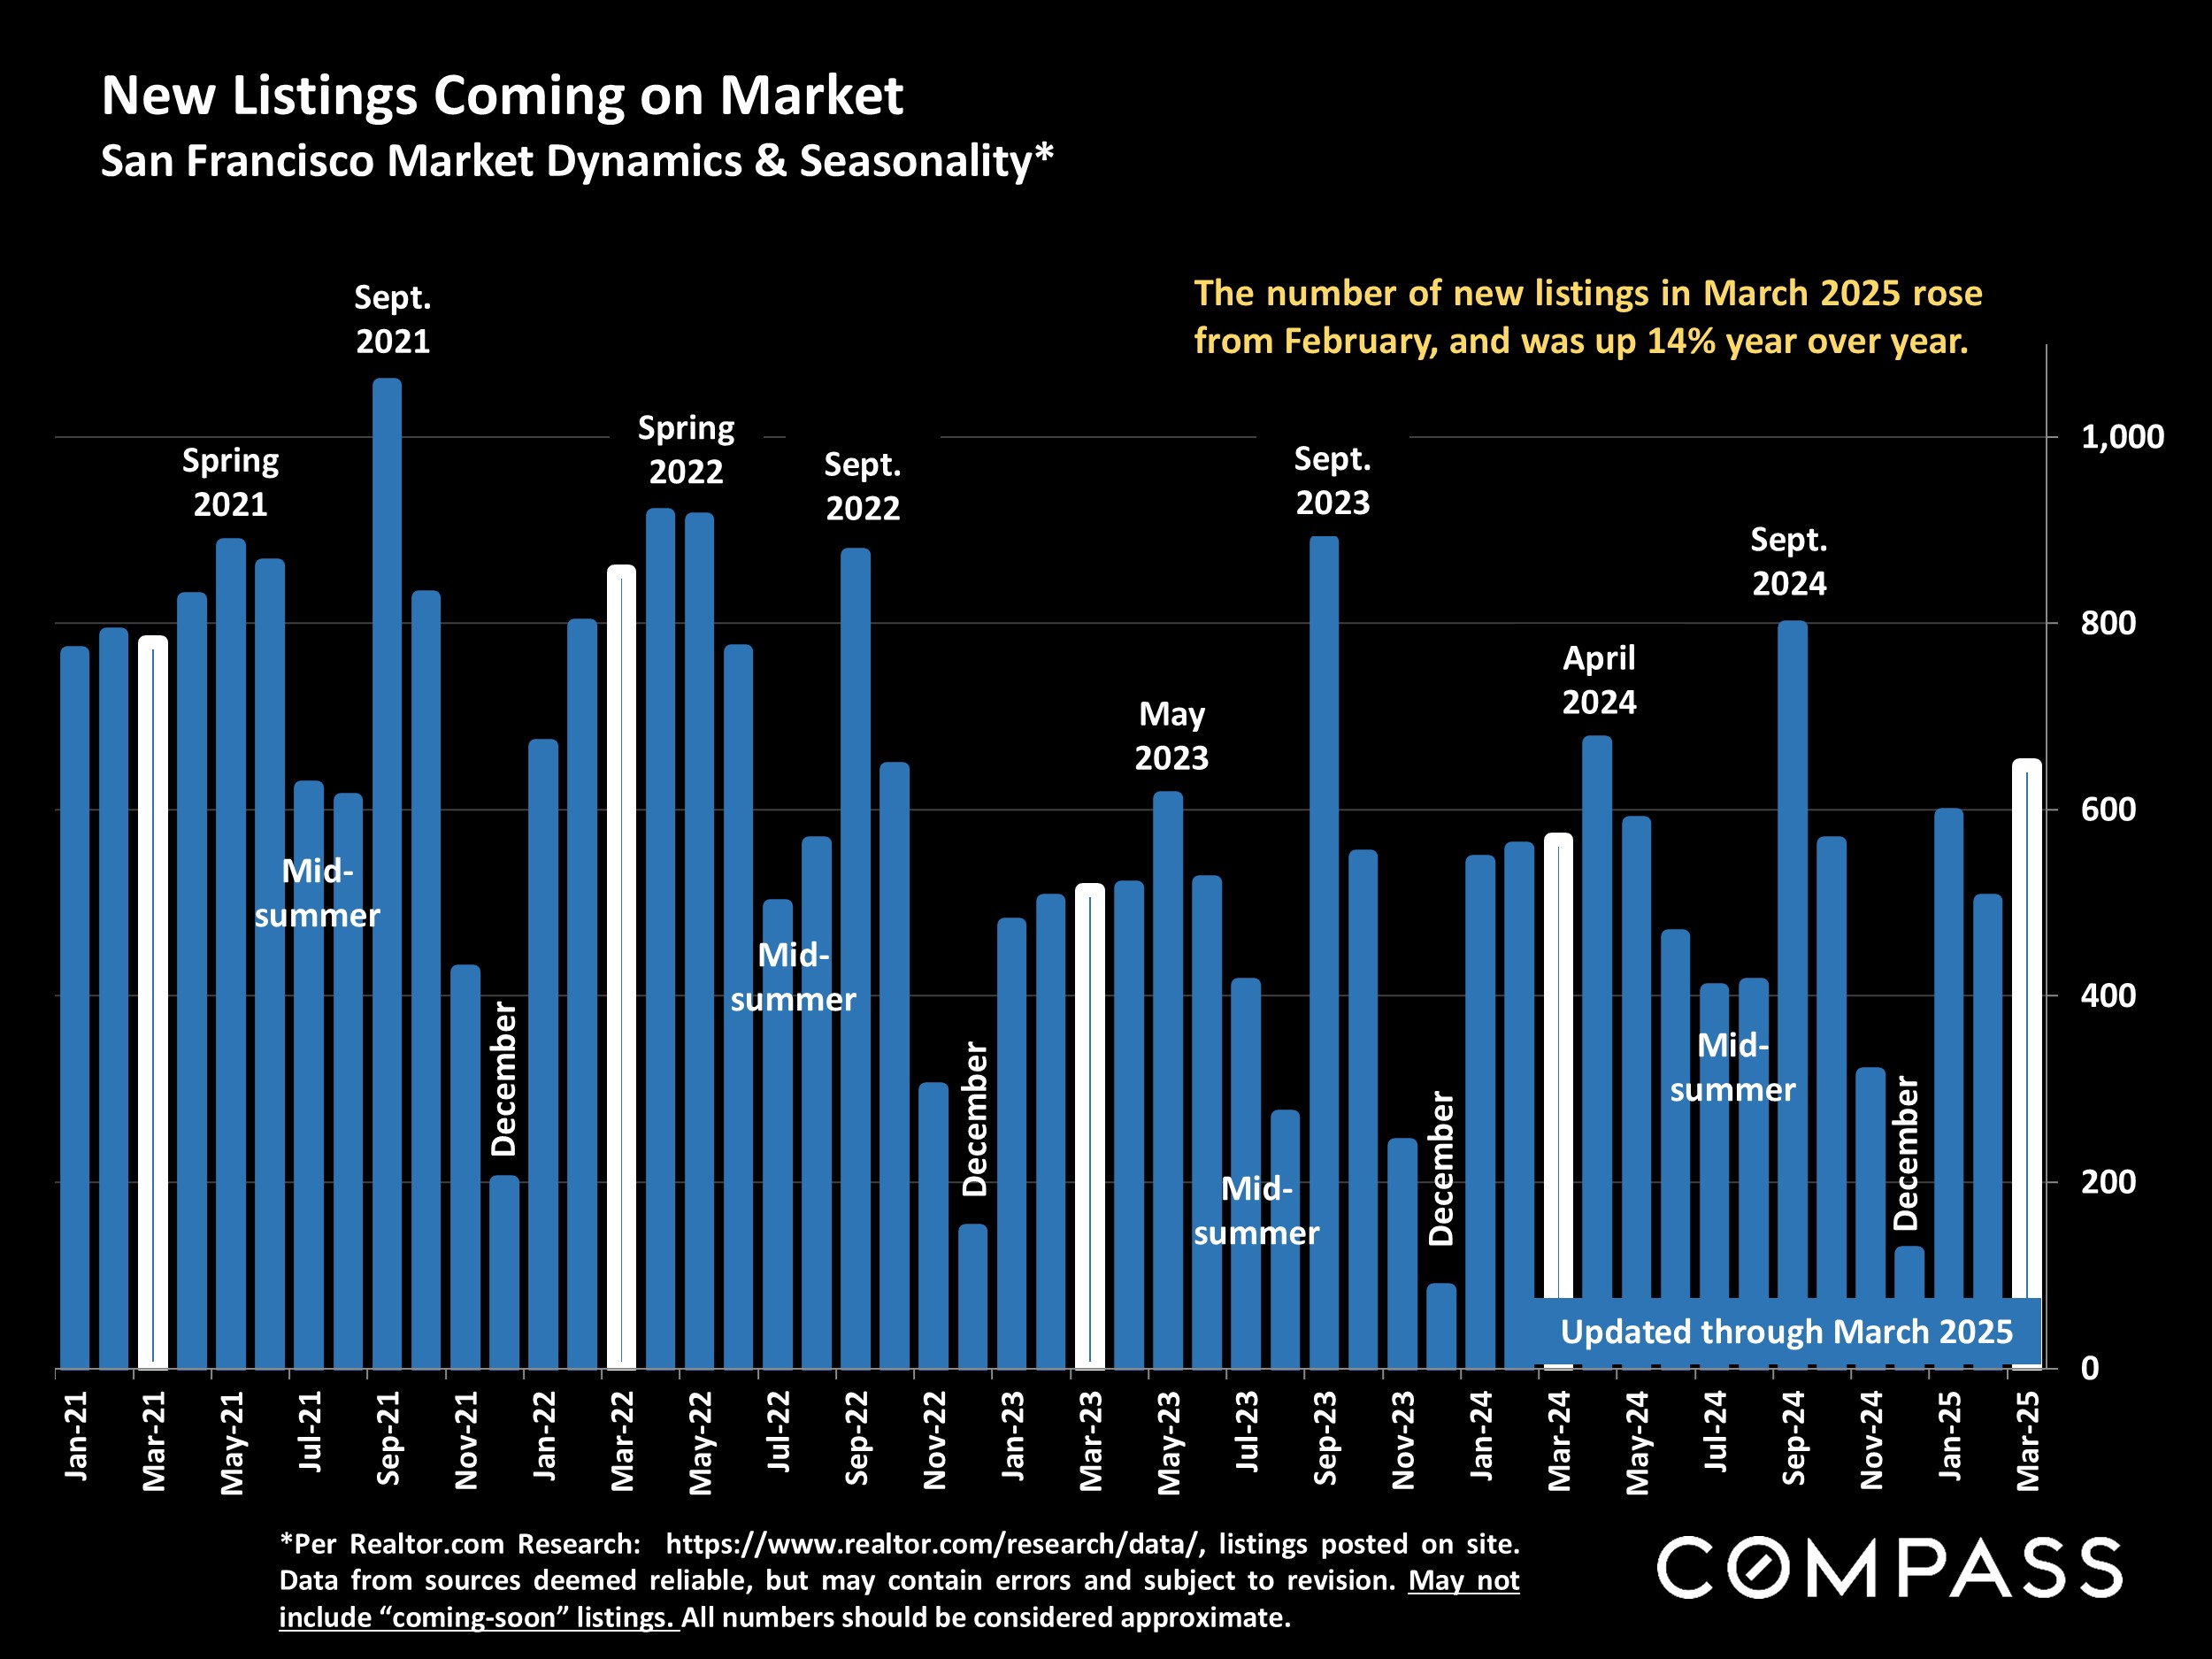
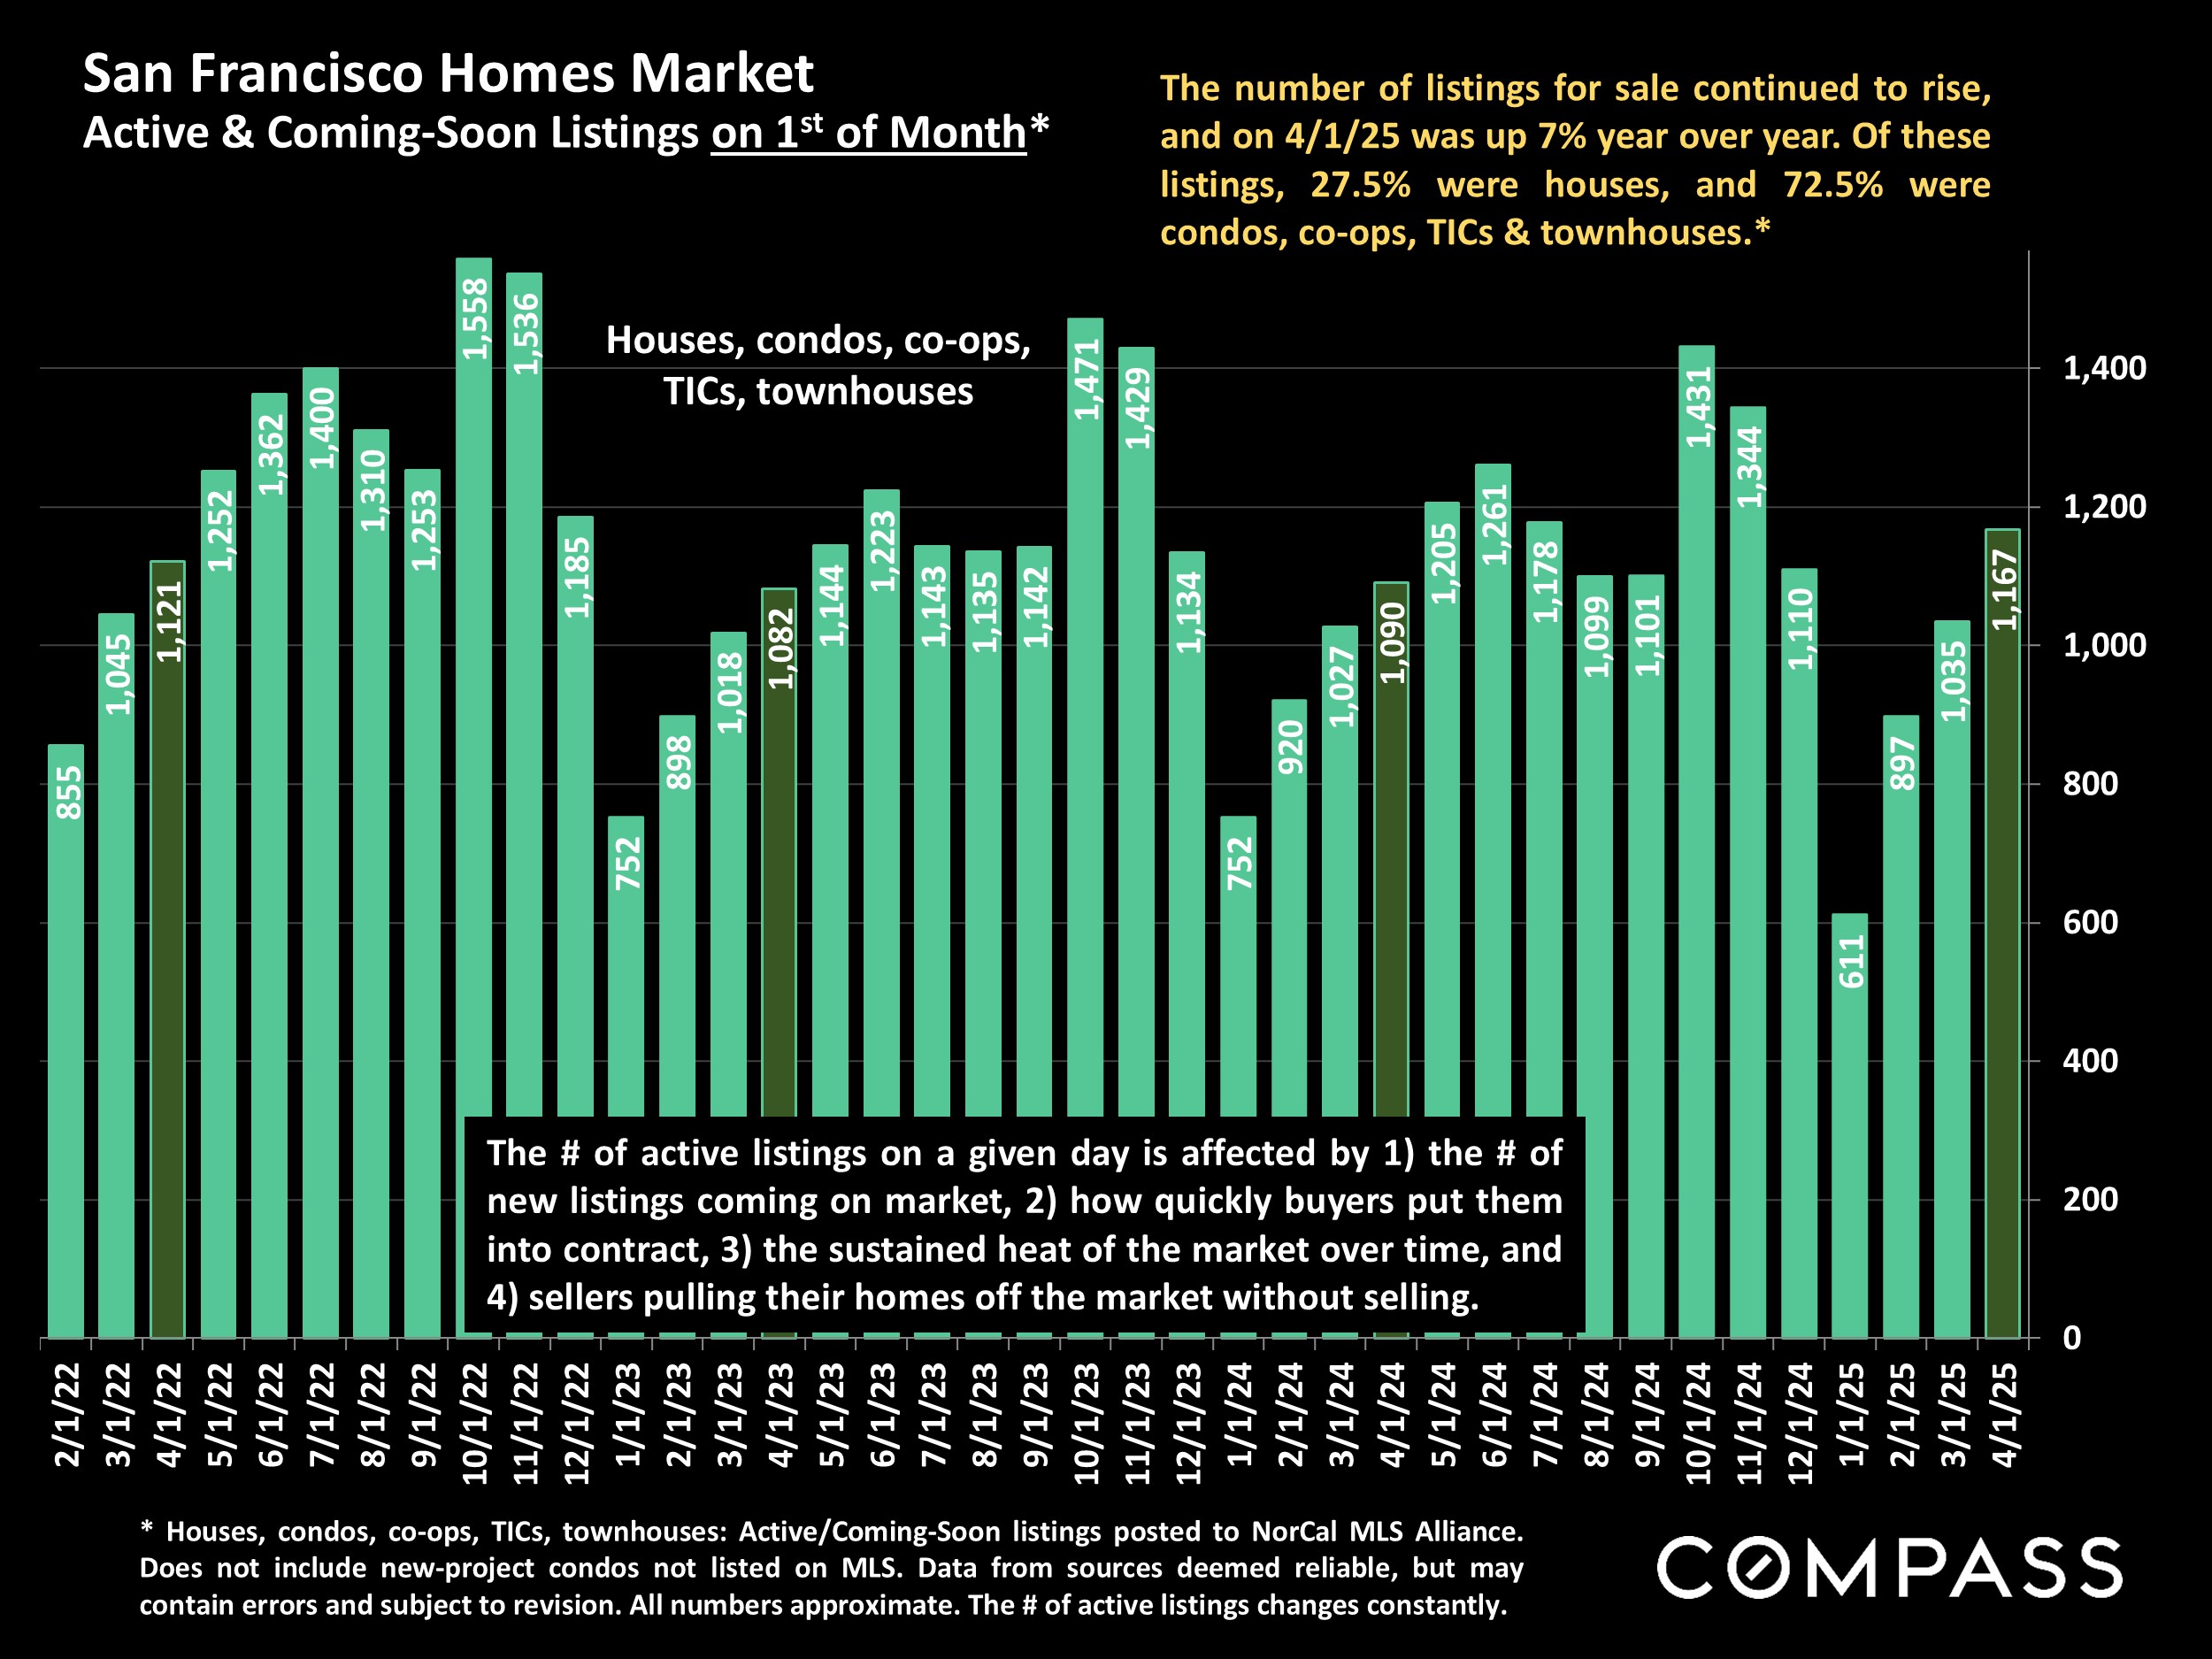
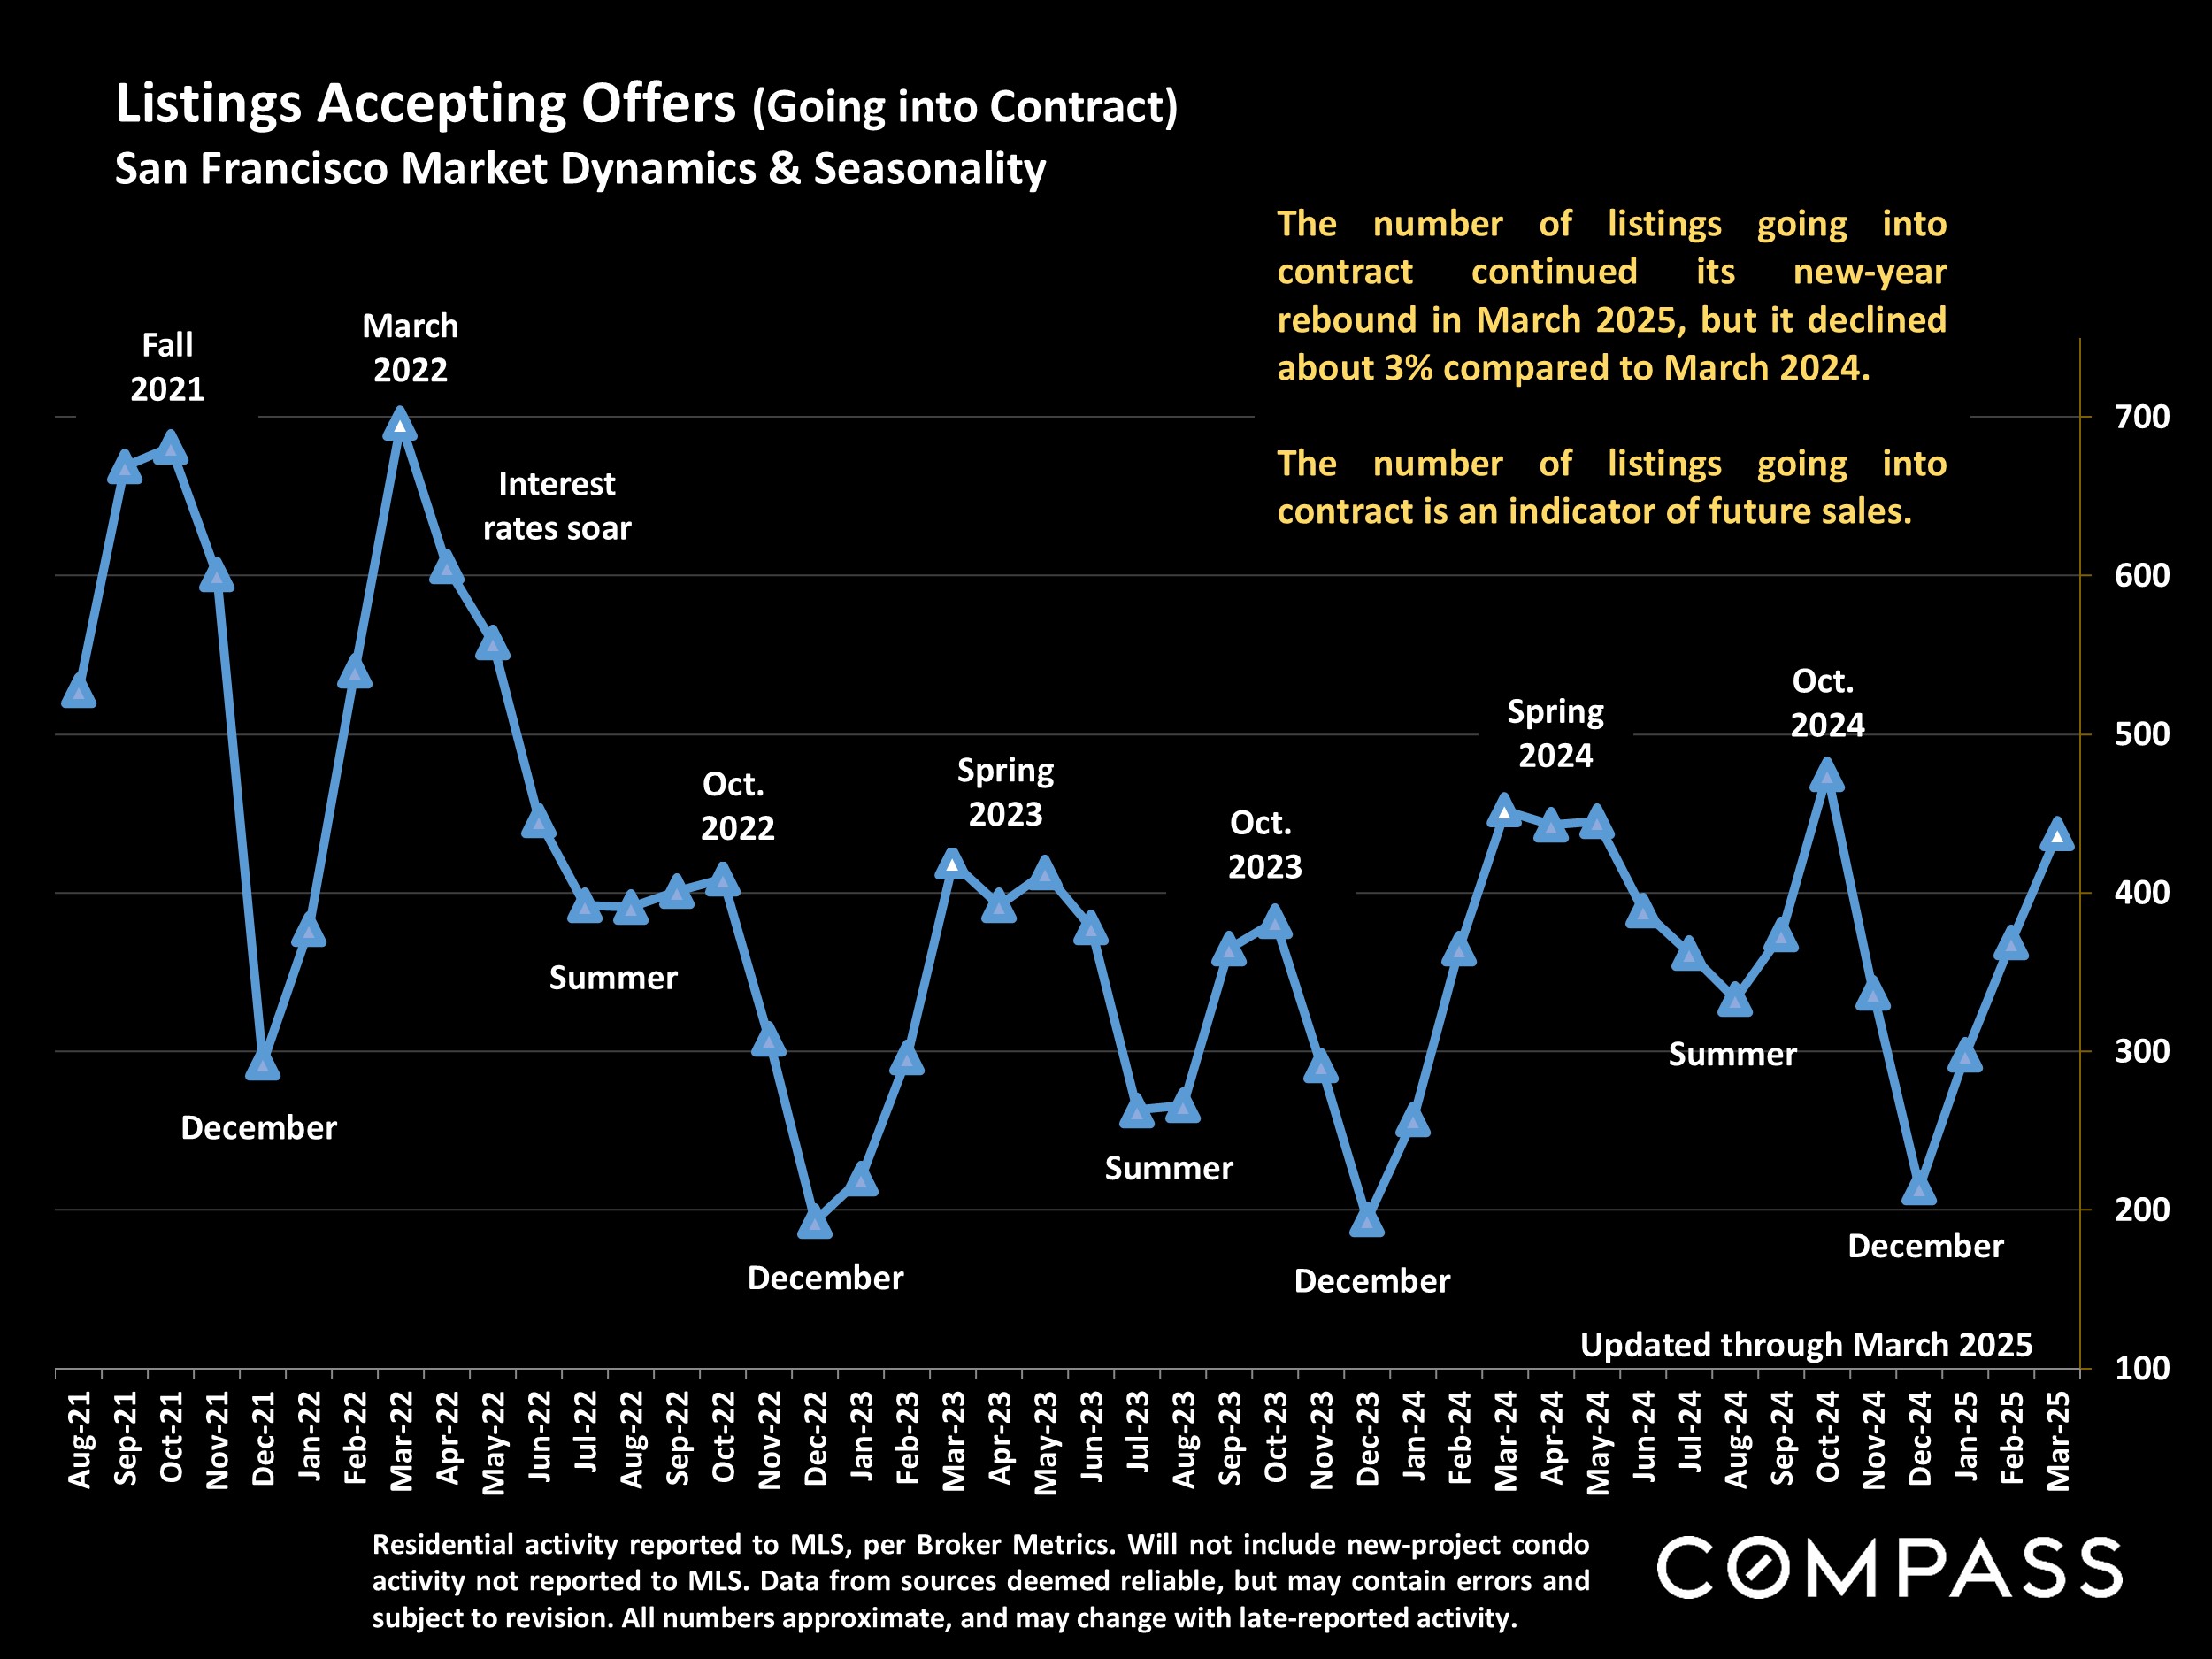
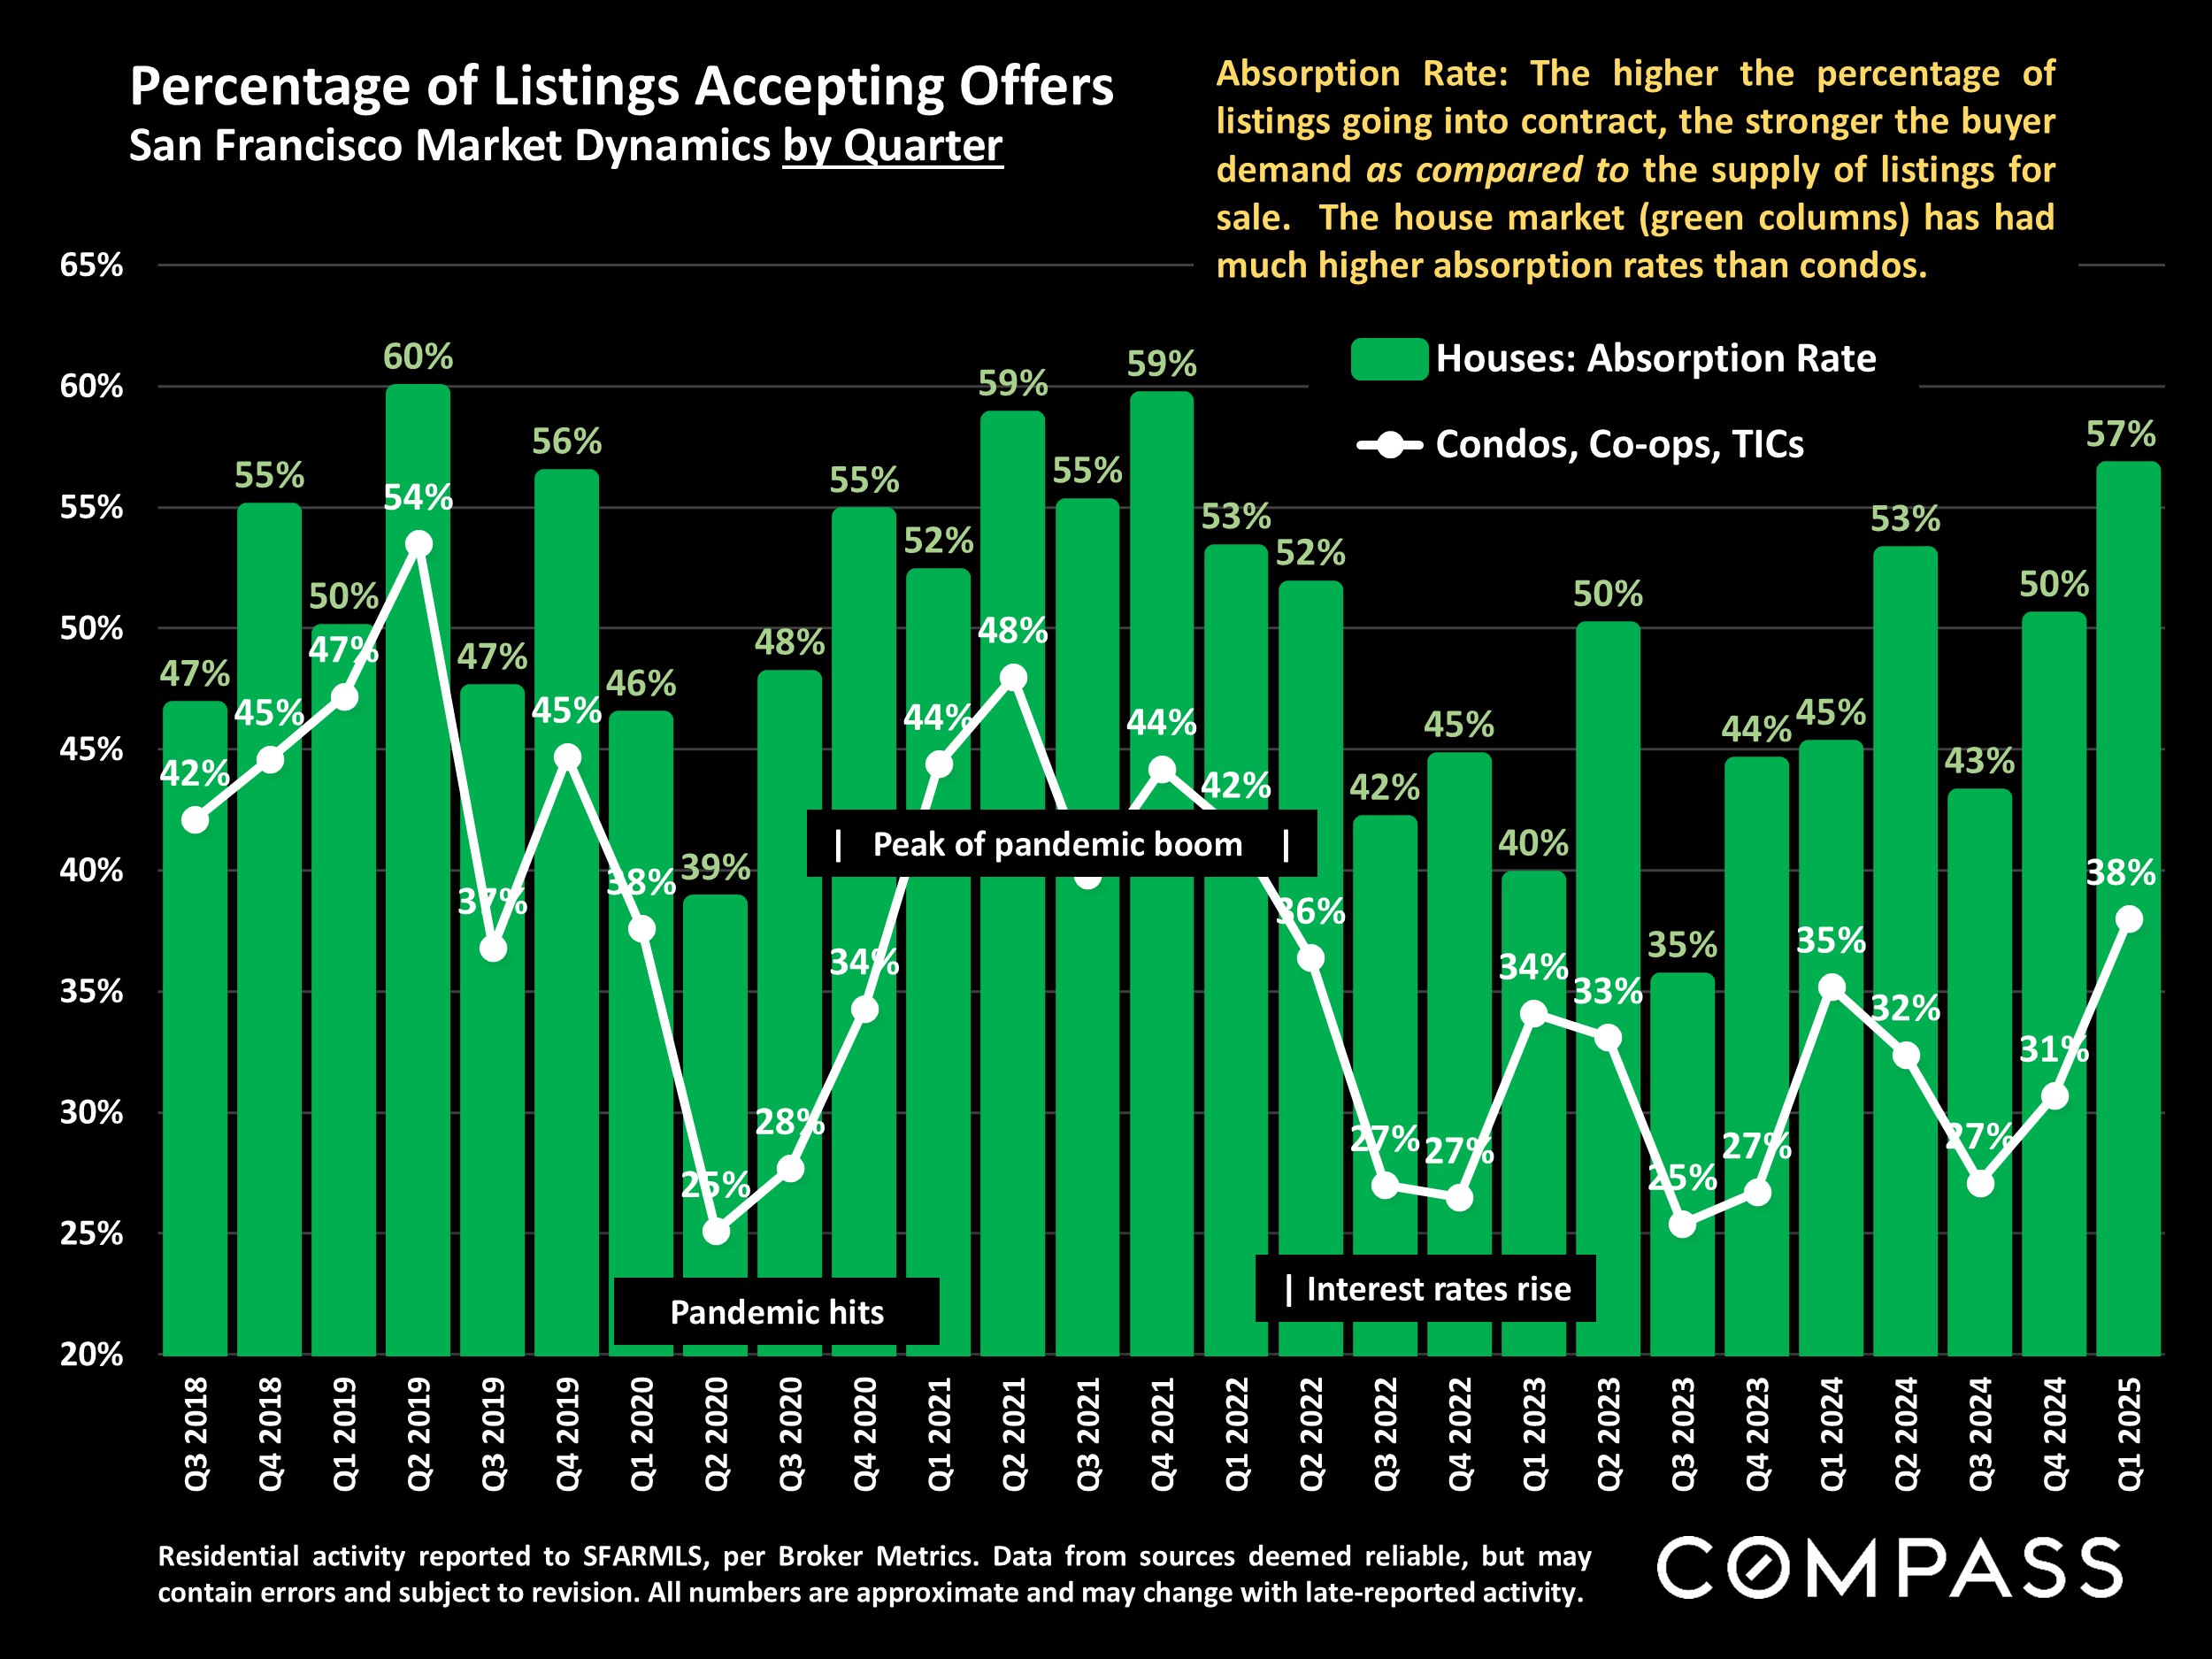
Generally speaking, through March 2025, Bay Area markets strengthened as the spring selling season gained steam: Sales volume and overbidding increased, and homes sold more quickly. The quantity of new and active listings rose across the Bay Area - sometimes very substantially - though San Francisco saw among the smallest increases. Luxury home sales out-performed the overall market, as affluent buyers continued to play an outsized role in Q1. Specifics pertaining to the San Francisco market follow within this report.
 It's
It's 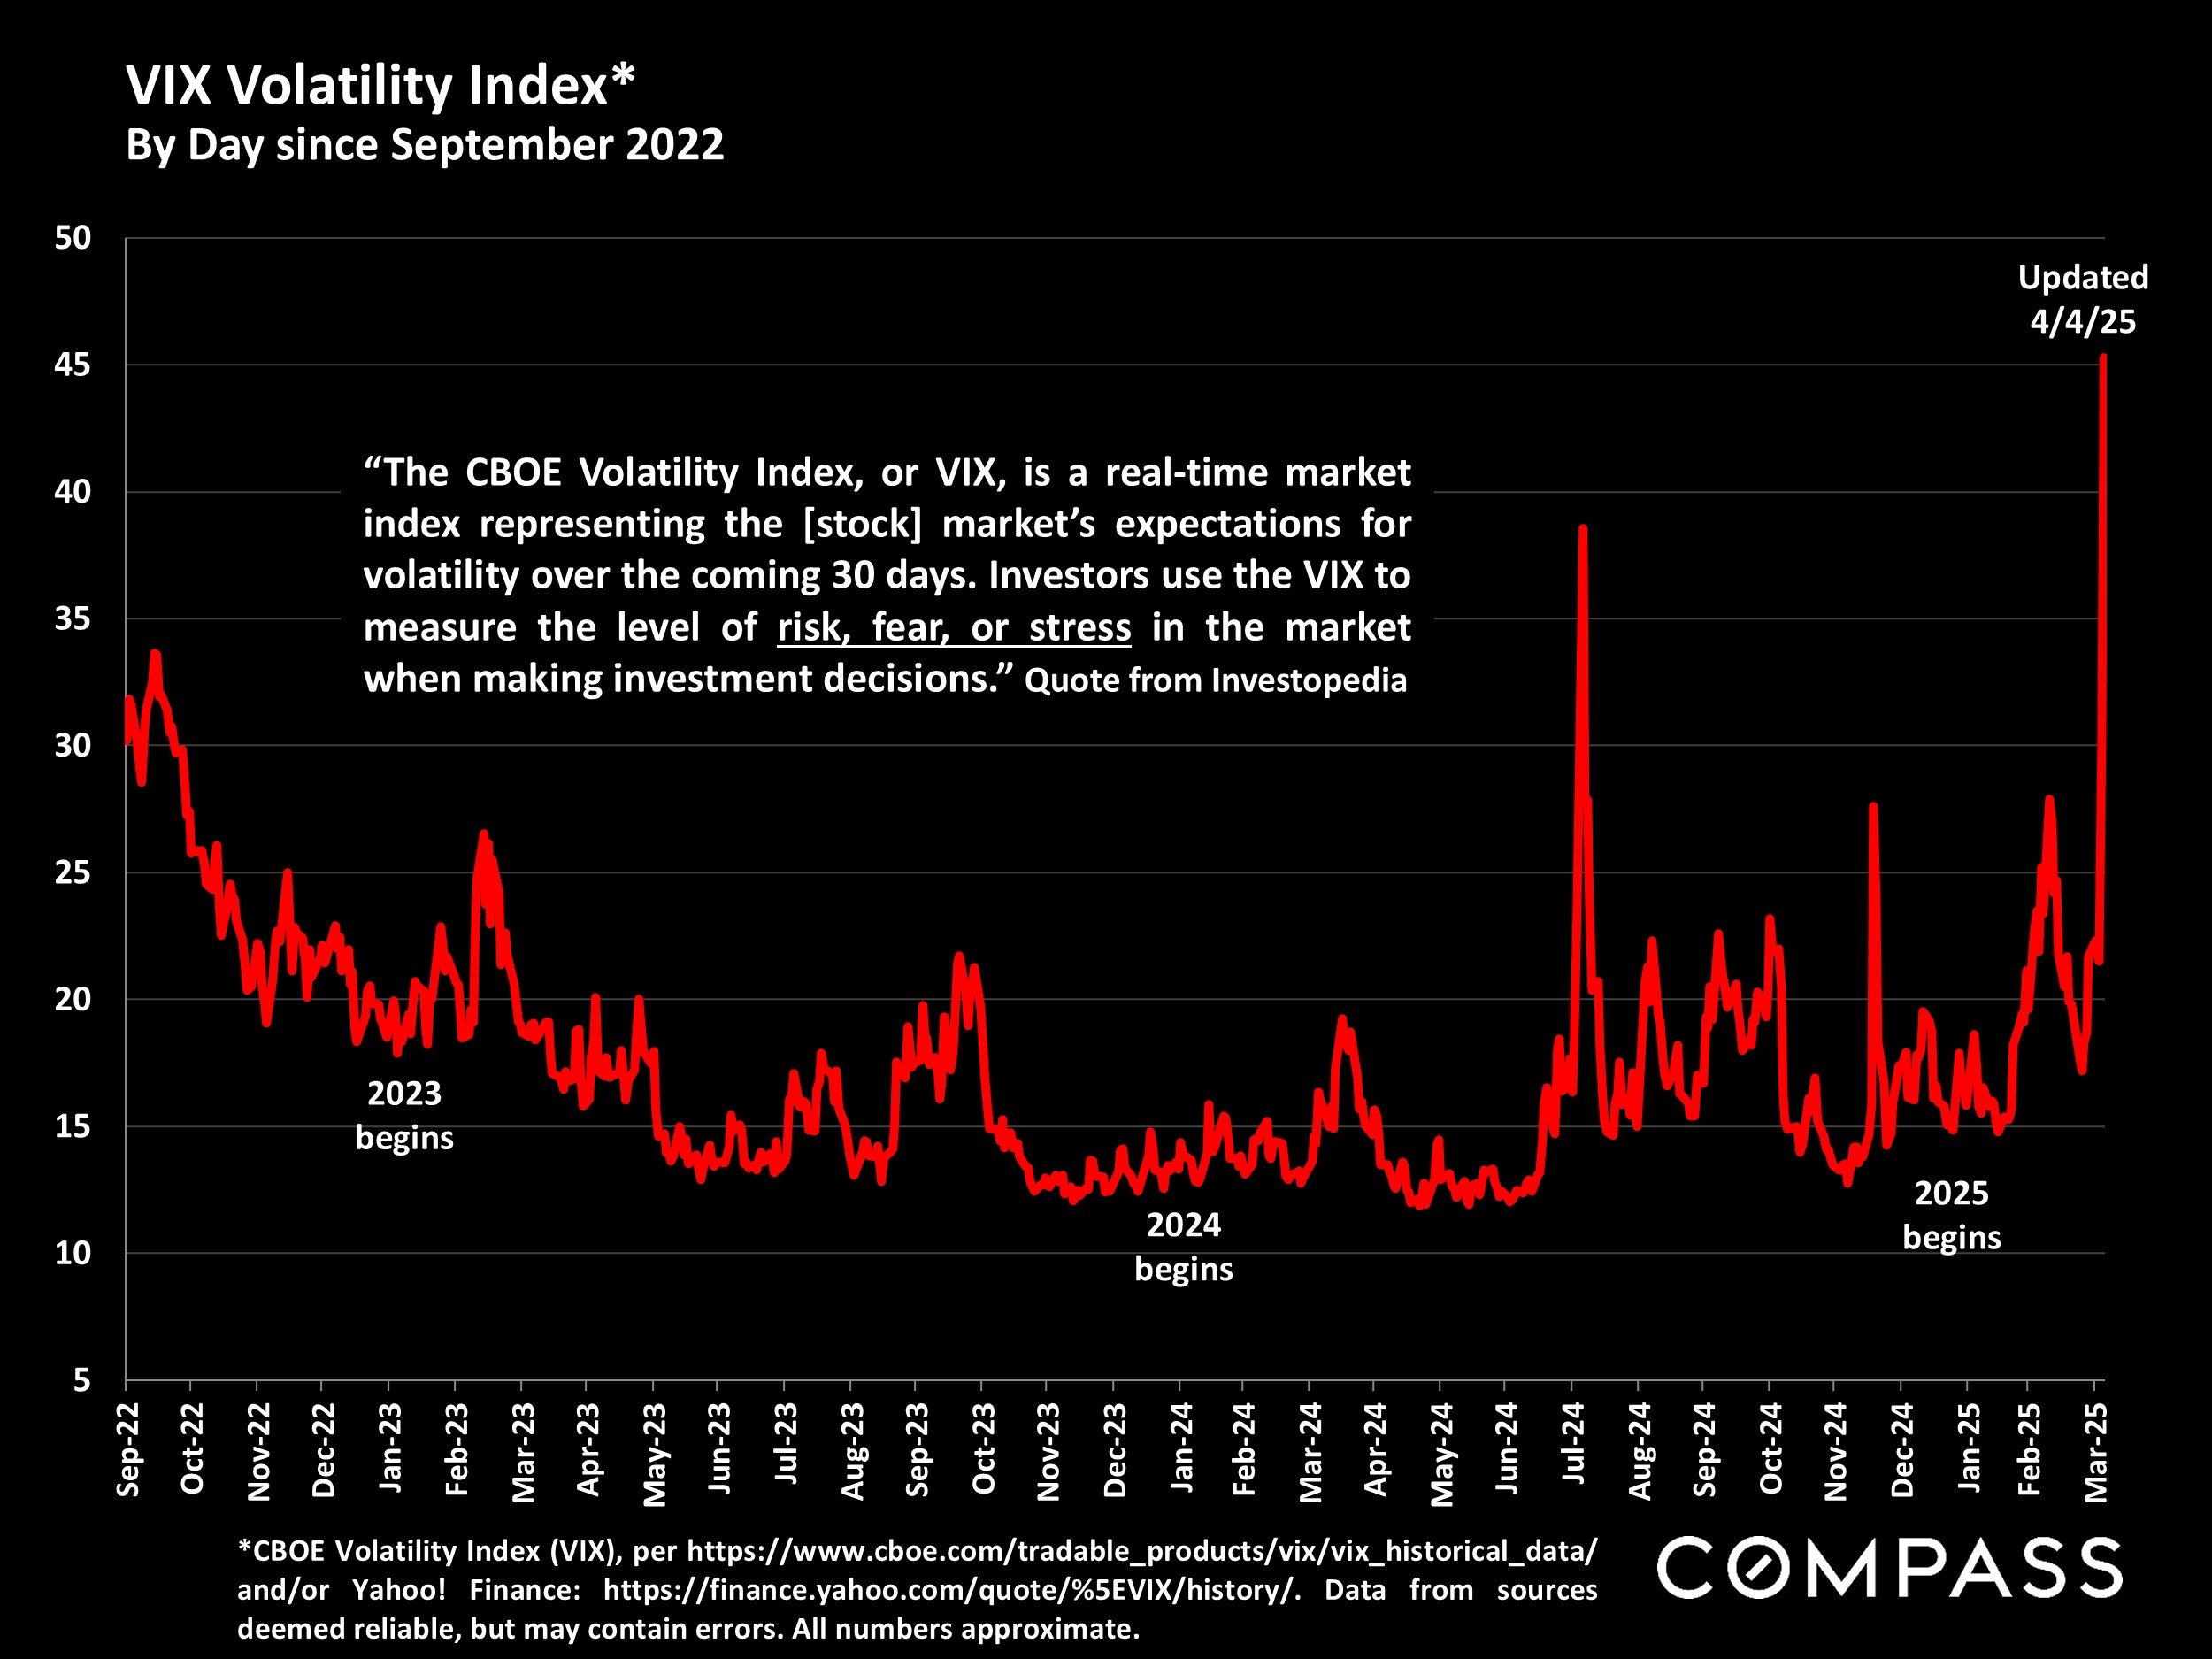
Want to learn more about Bay Area market trends?
Let’s connect! With relationships and networks across the city, there are a variety of ways I can help you make informed real estate decisions. Call, email, or text – I’m here to help.
Contact