August 15, 2022
SF: Aug 2022 Market Stats
By Compass
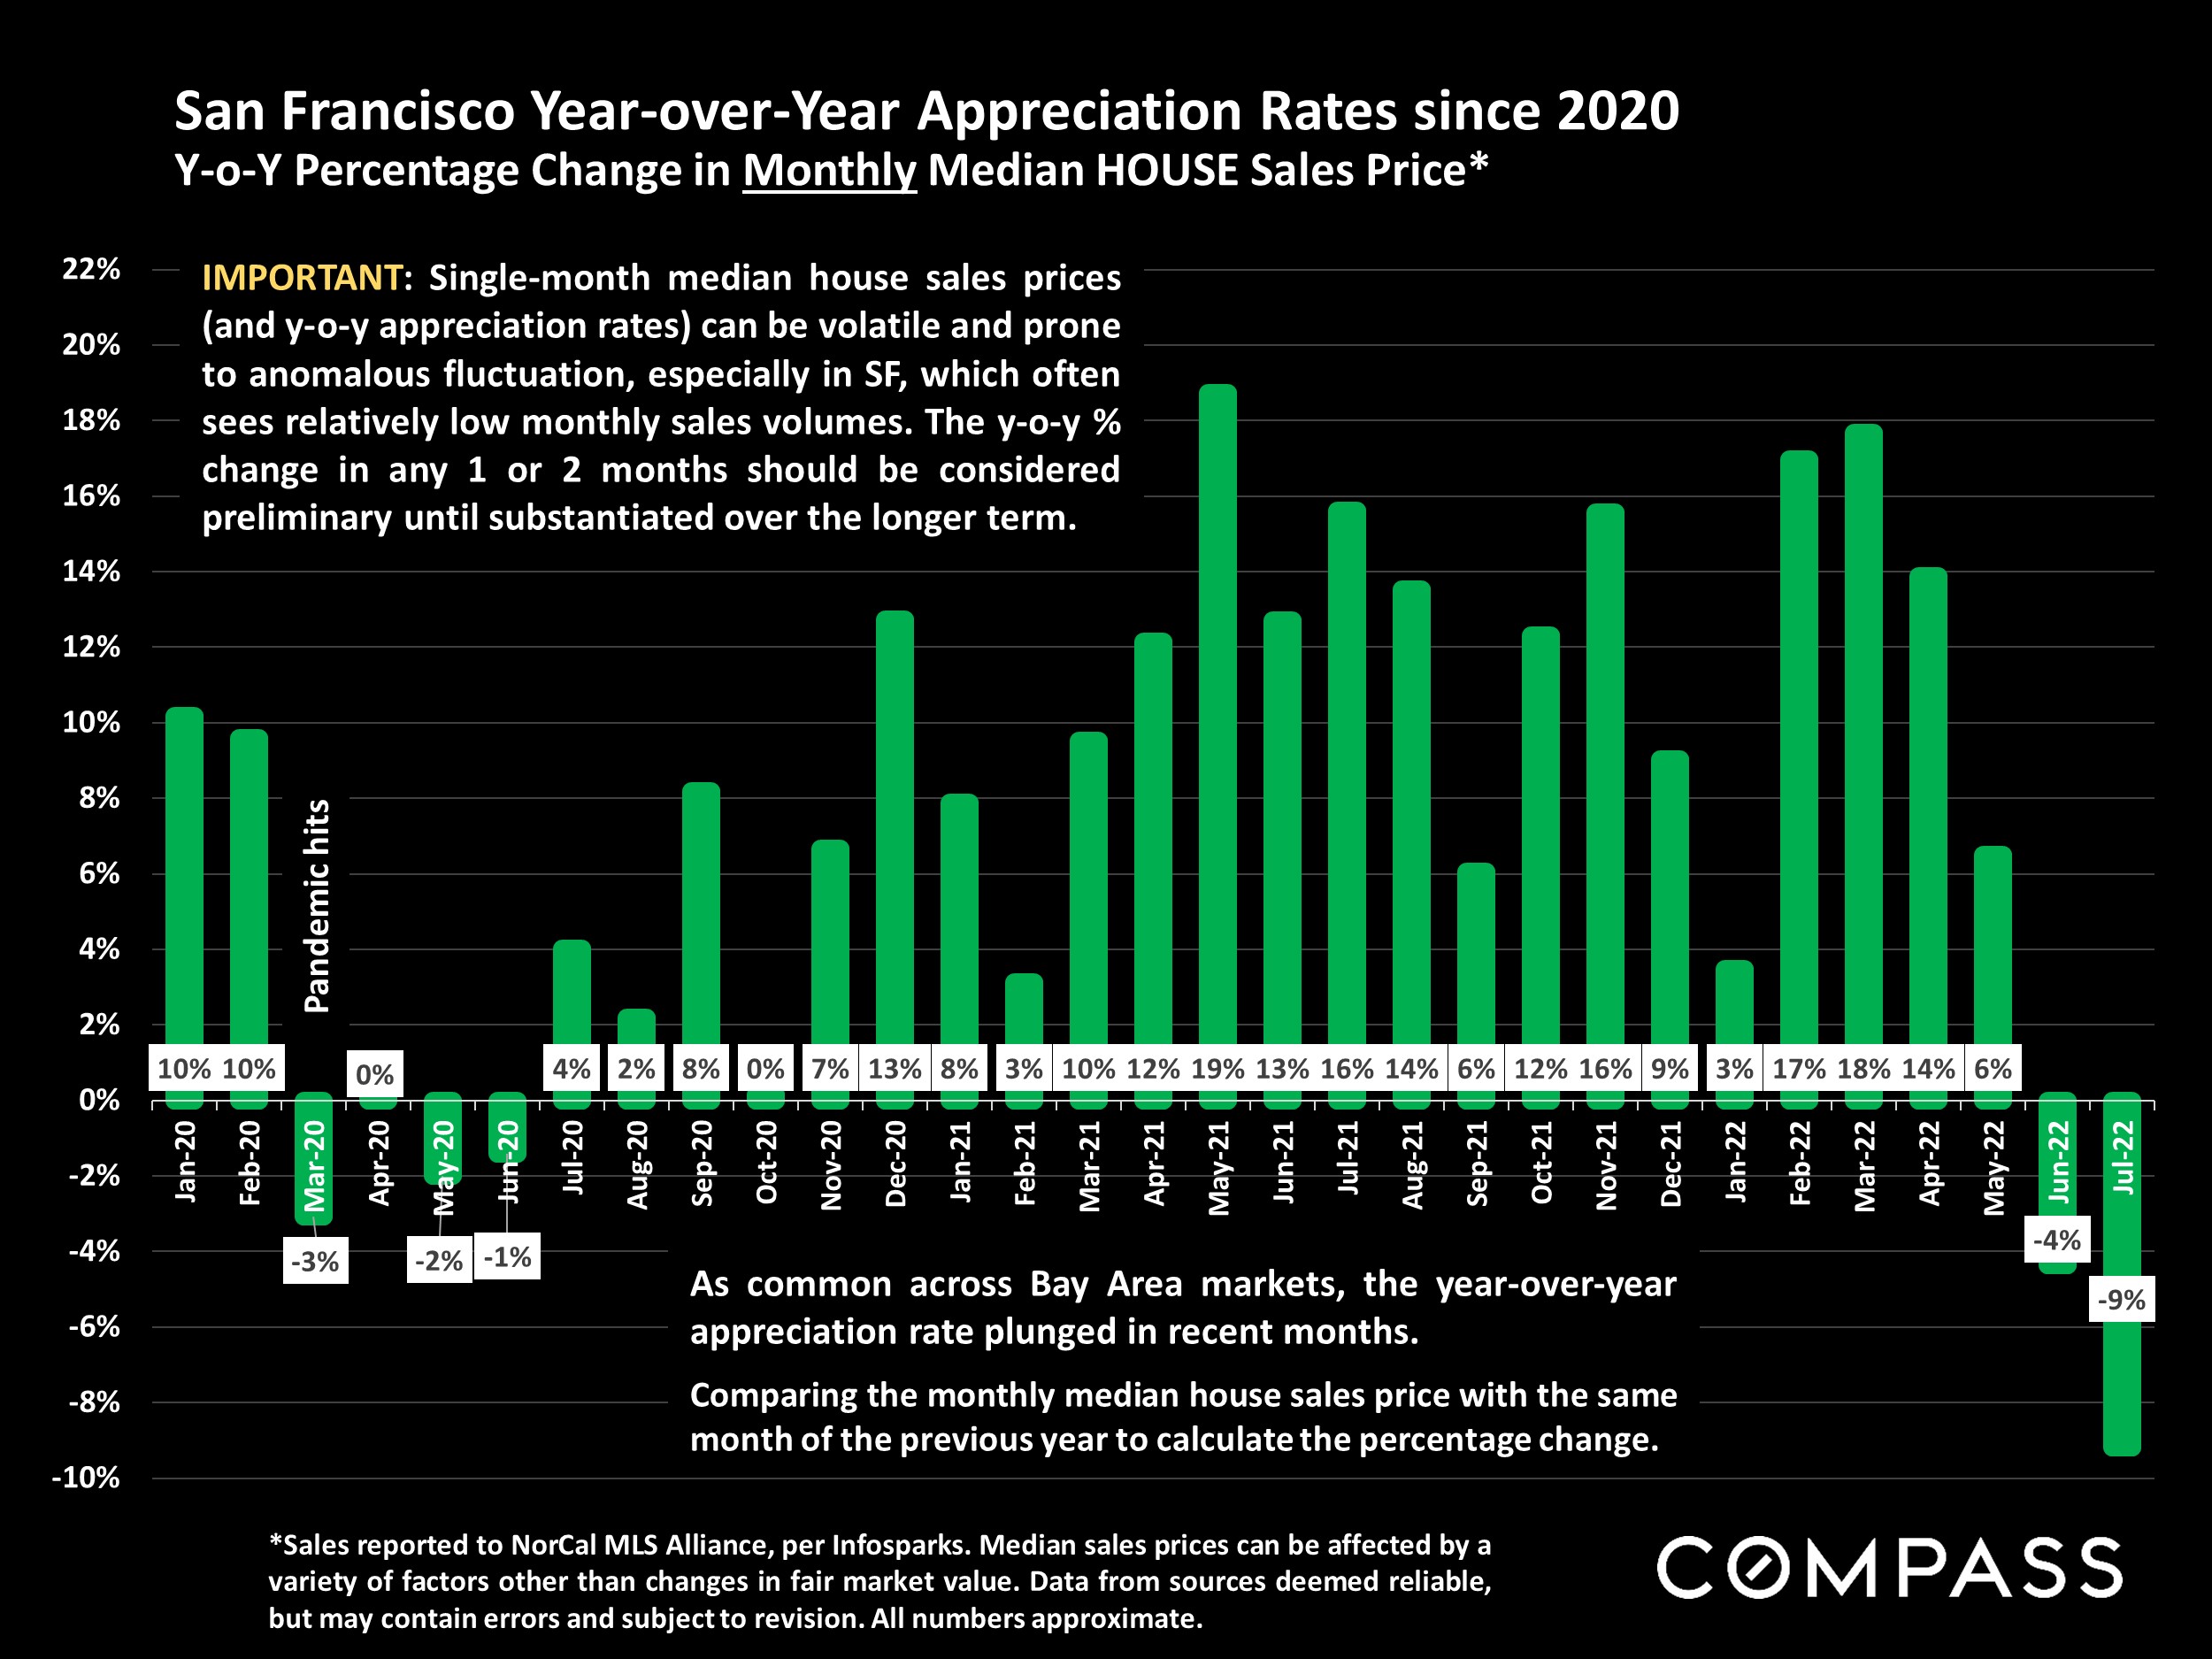
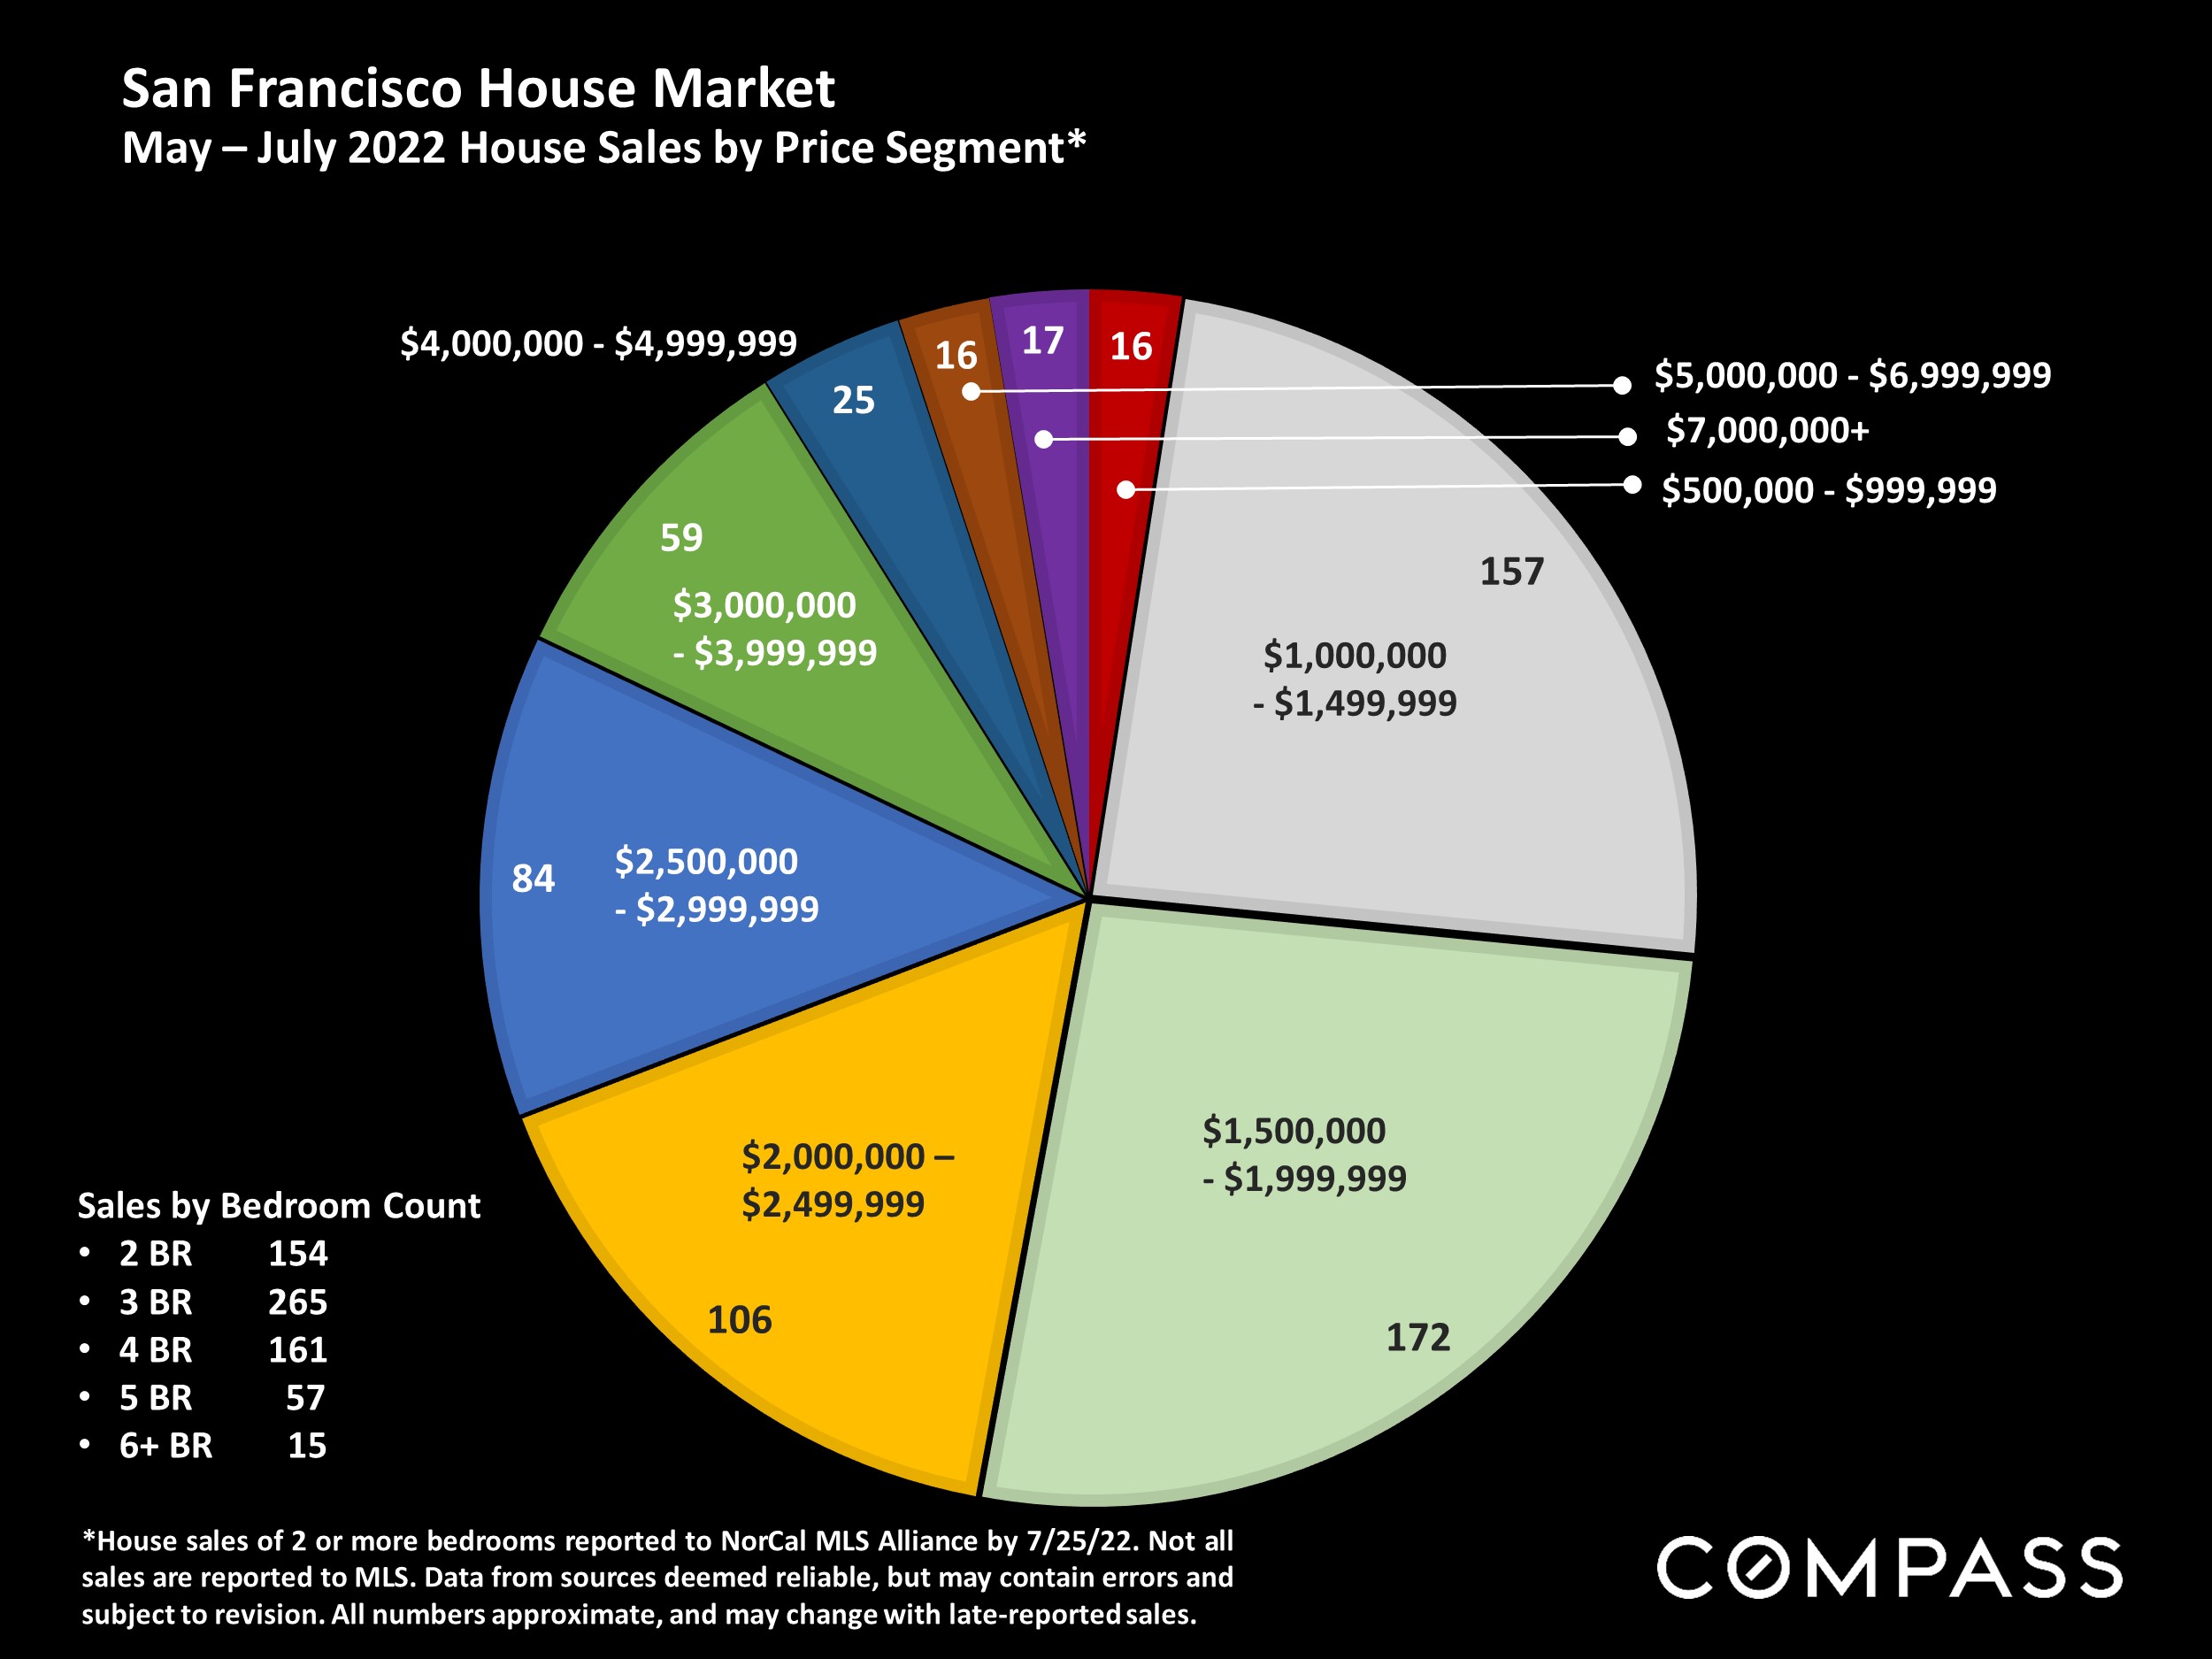
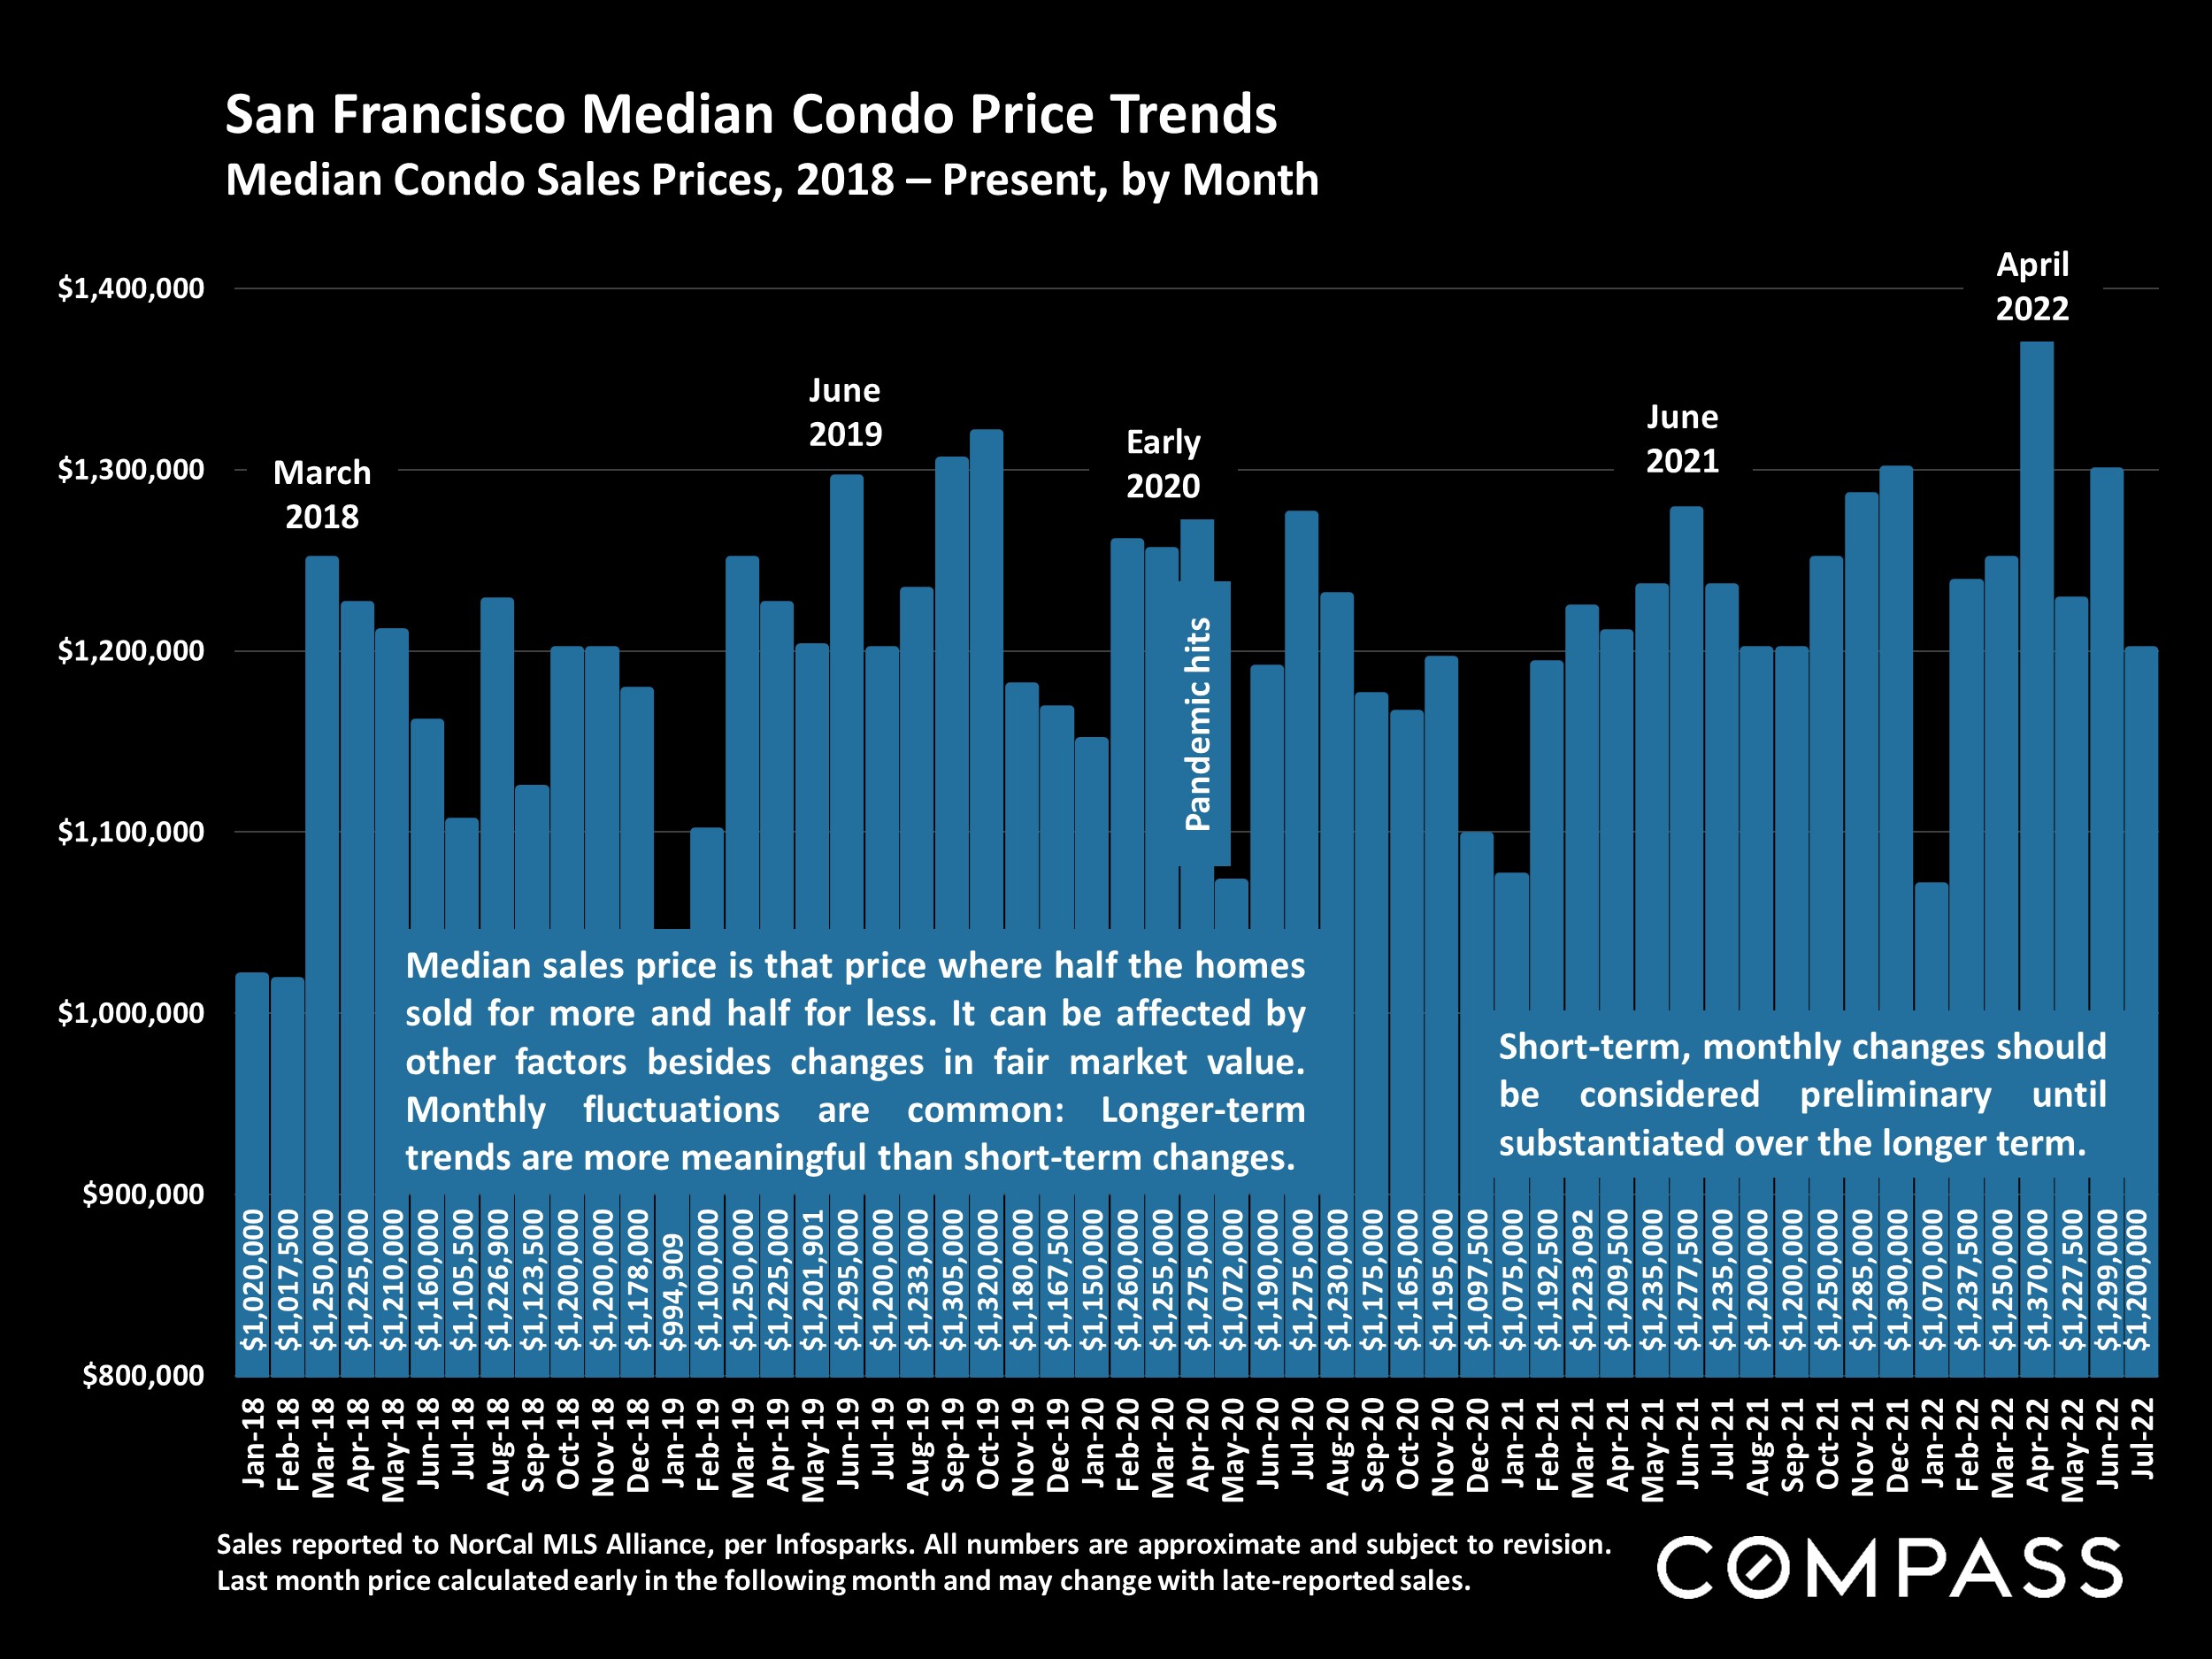
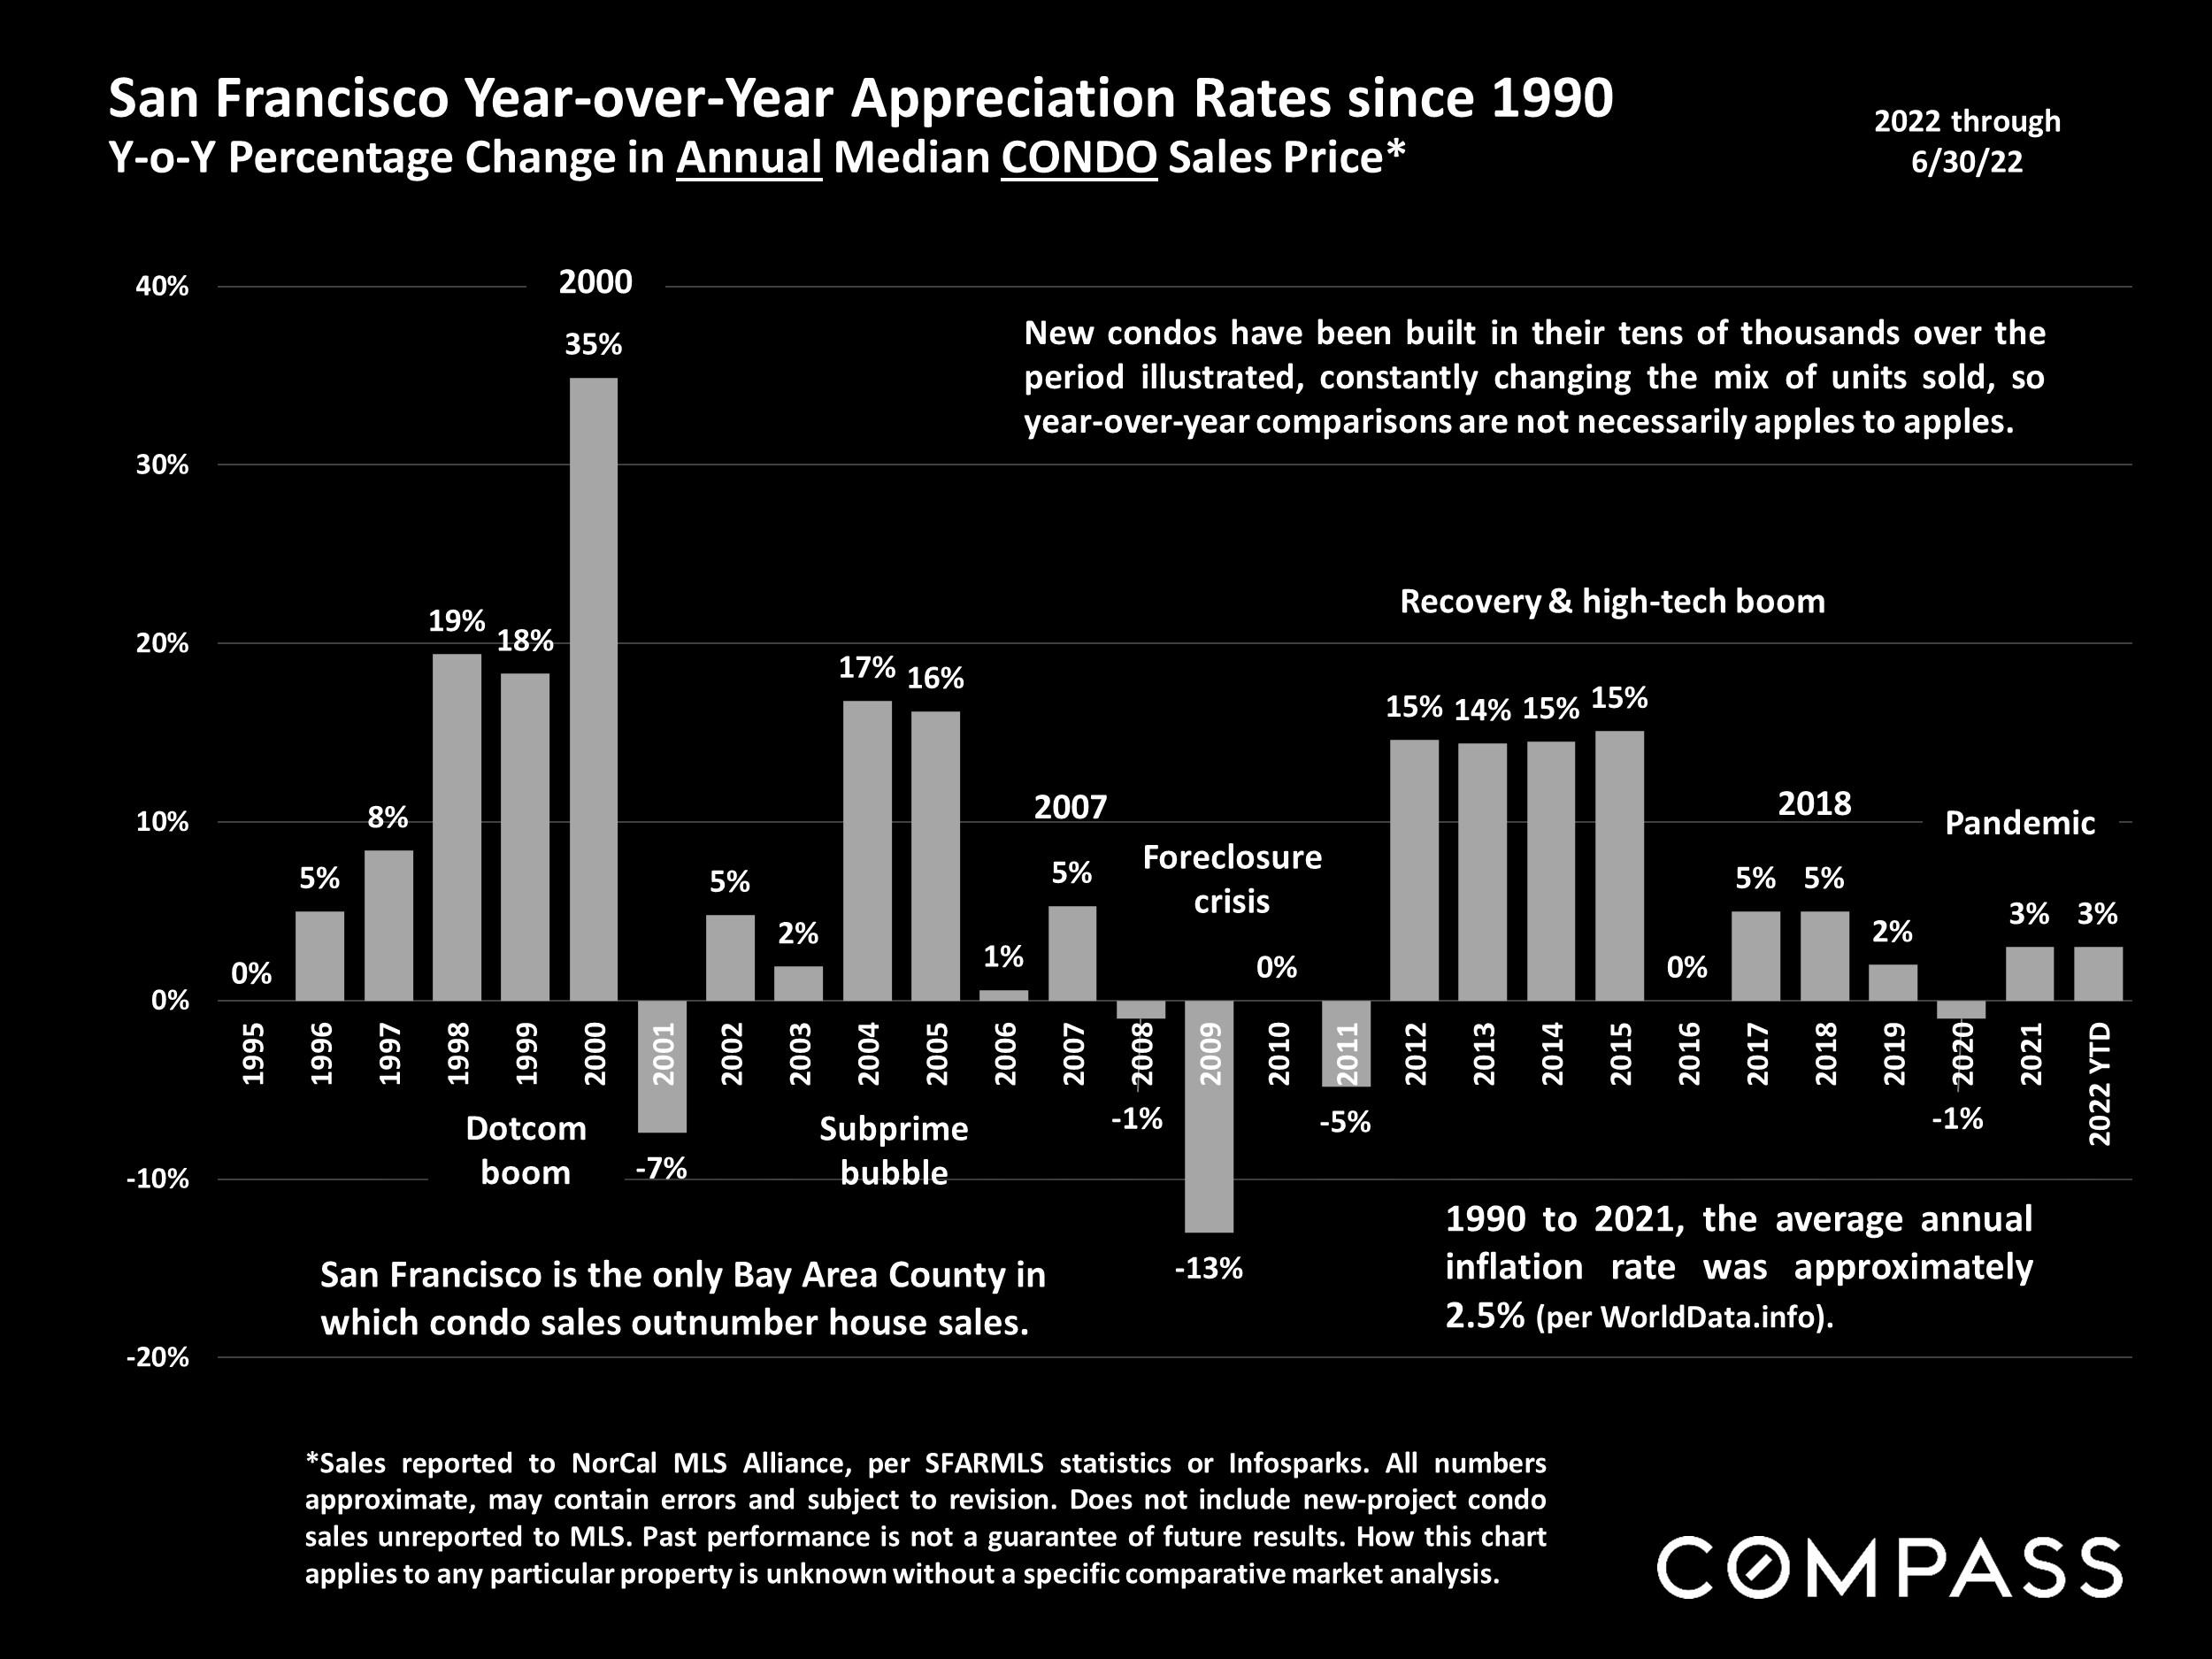
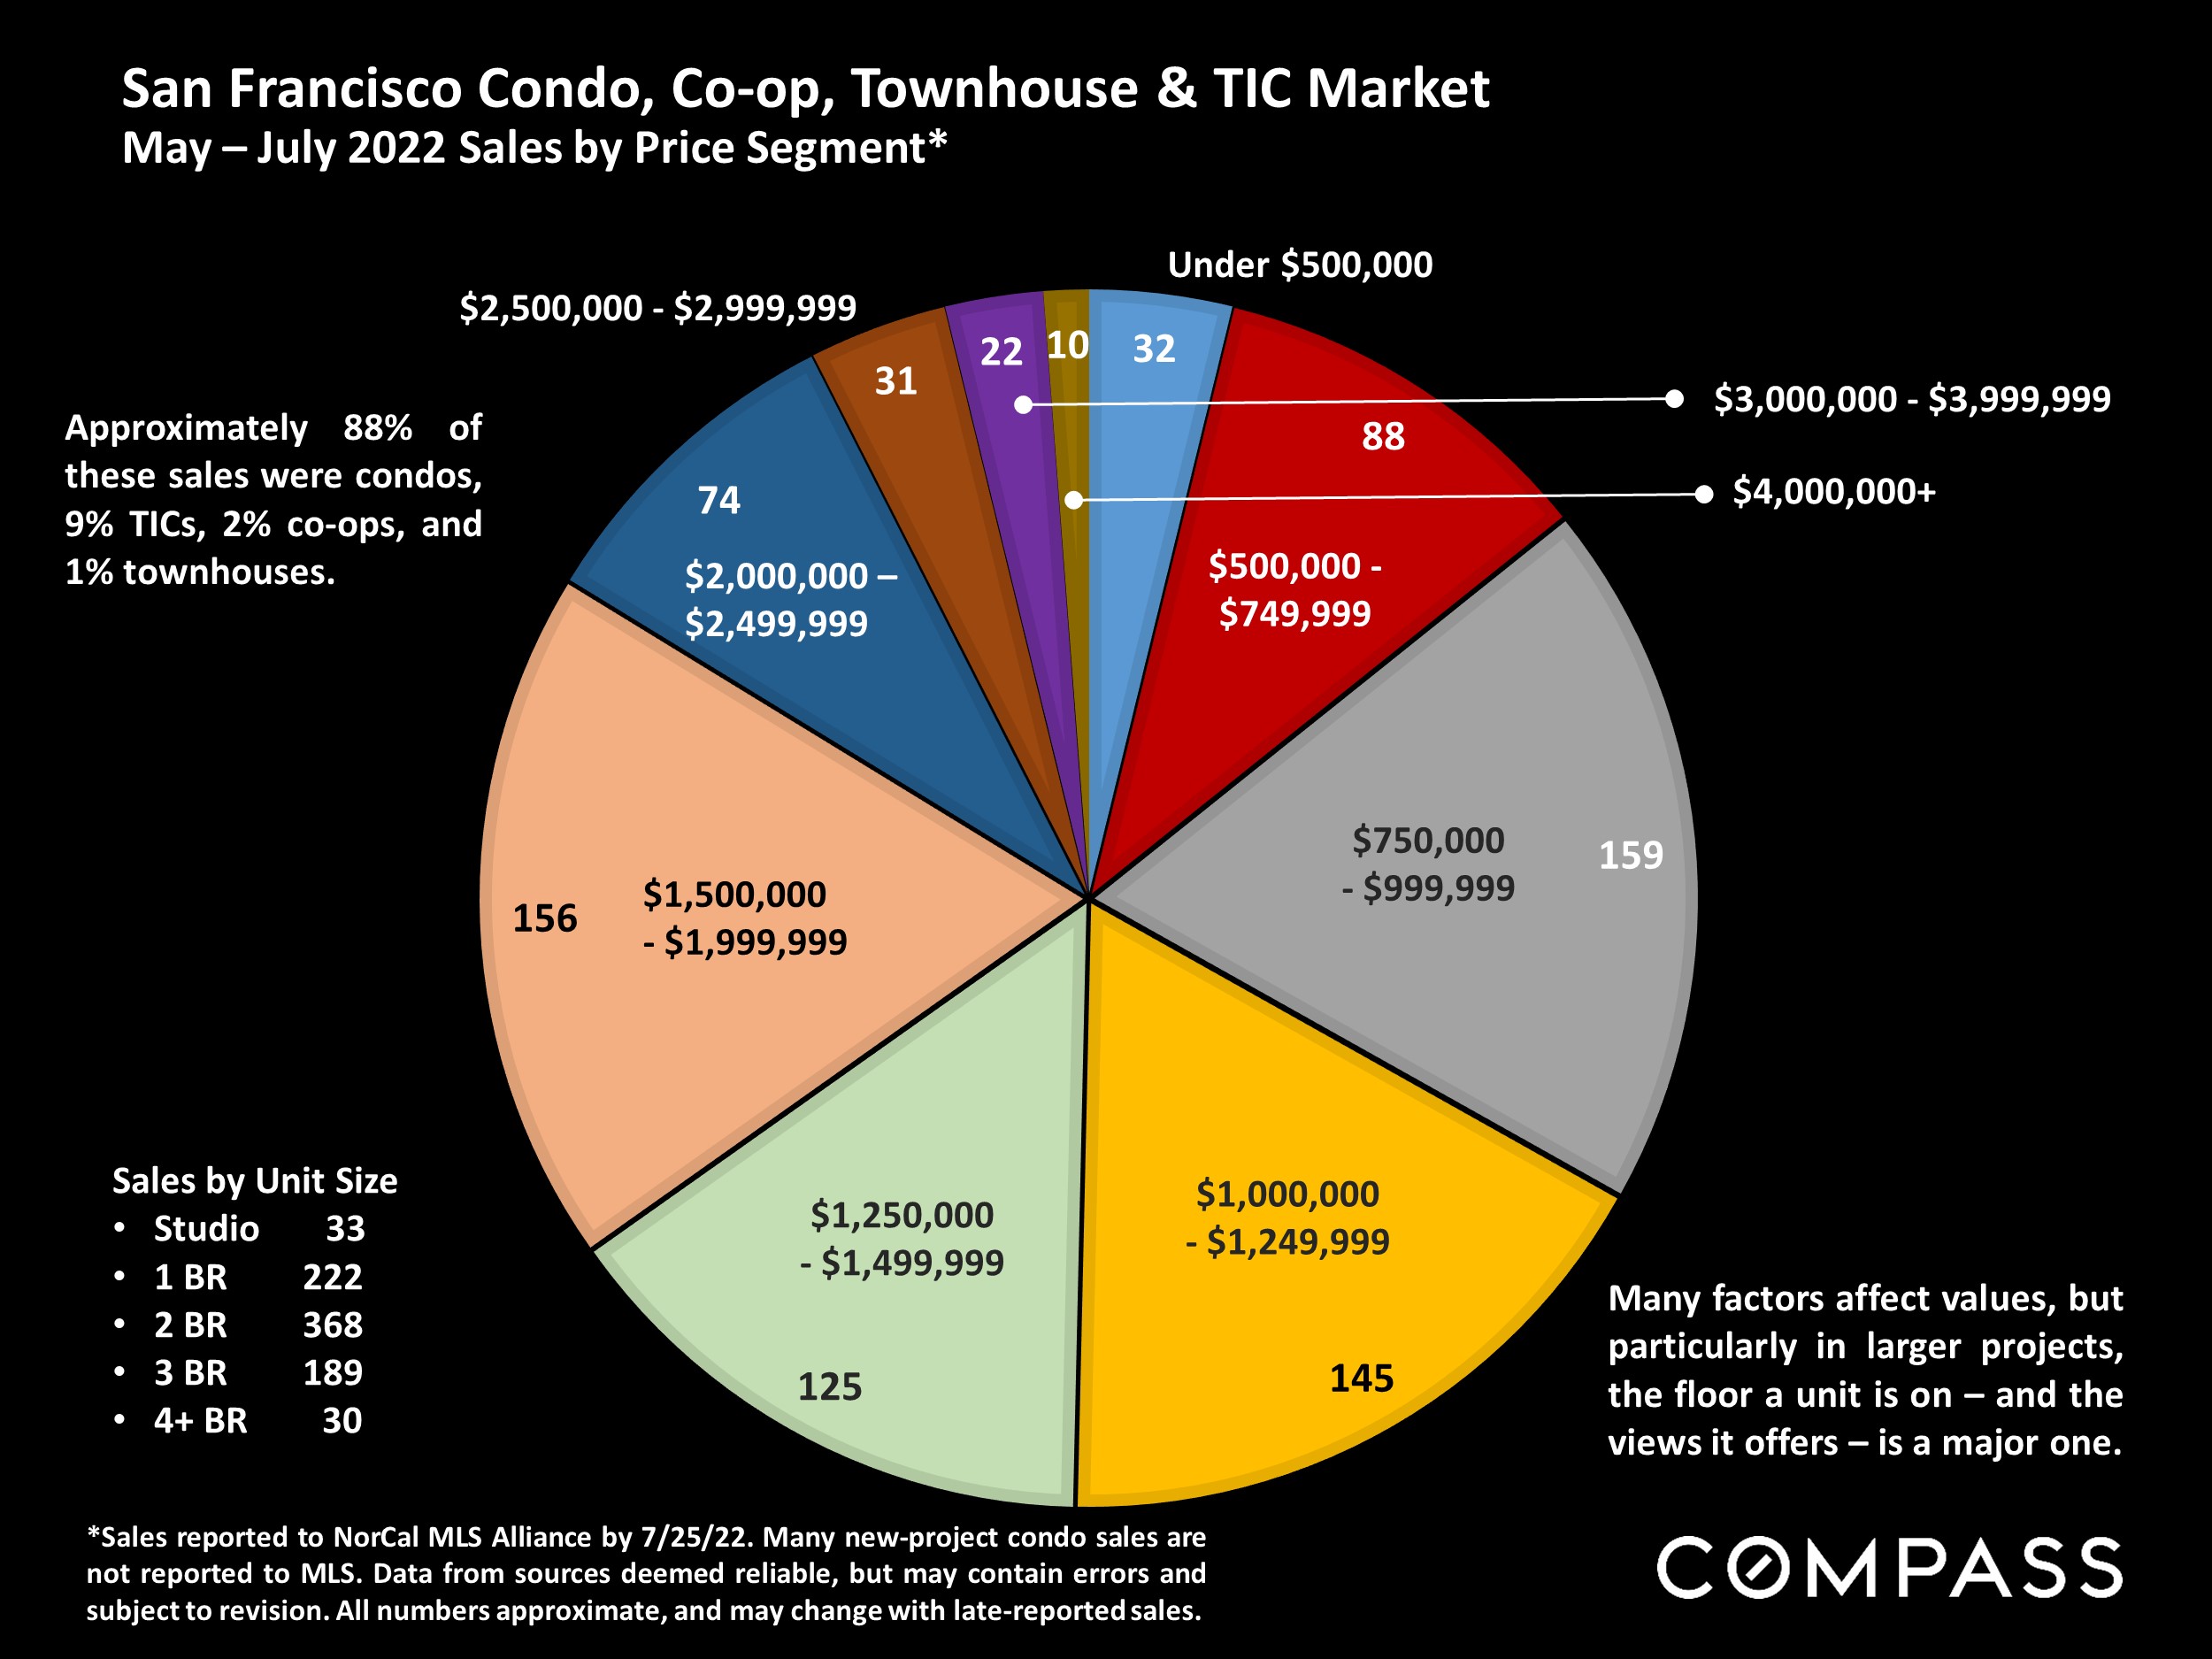
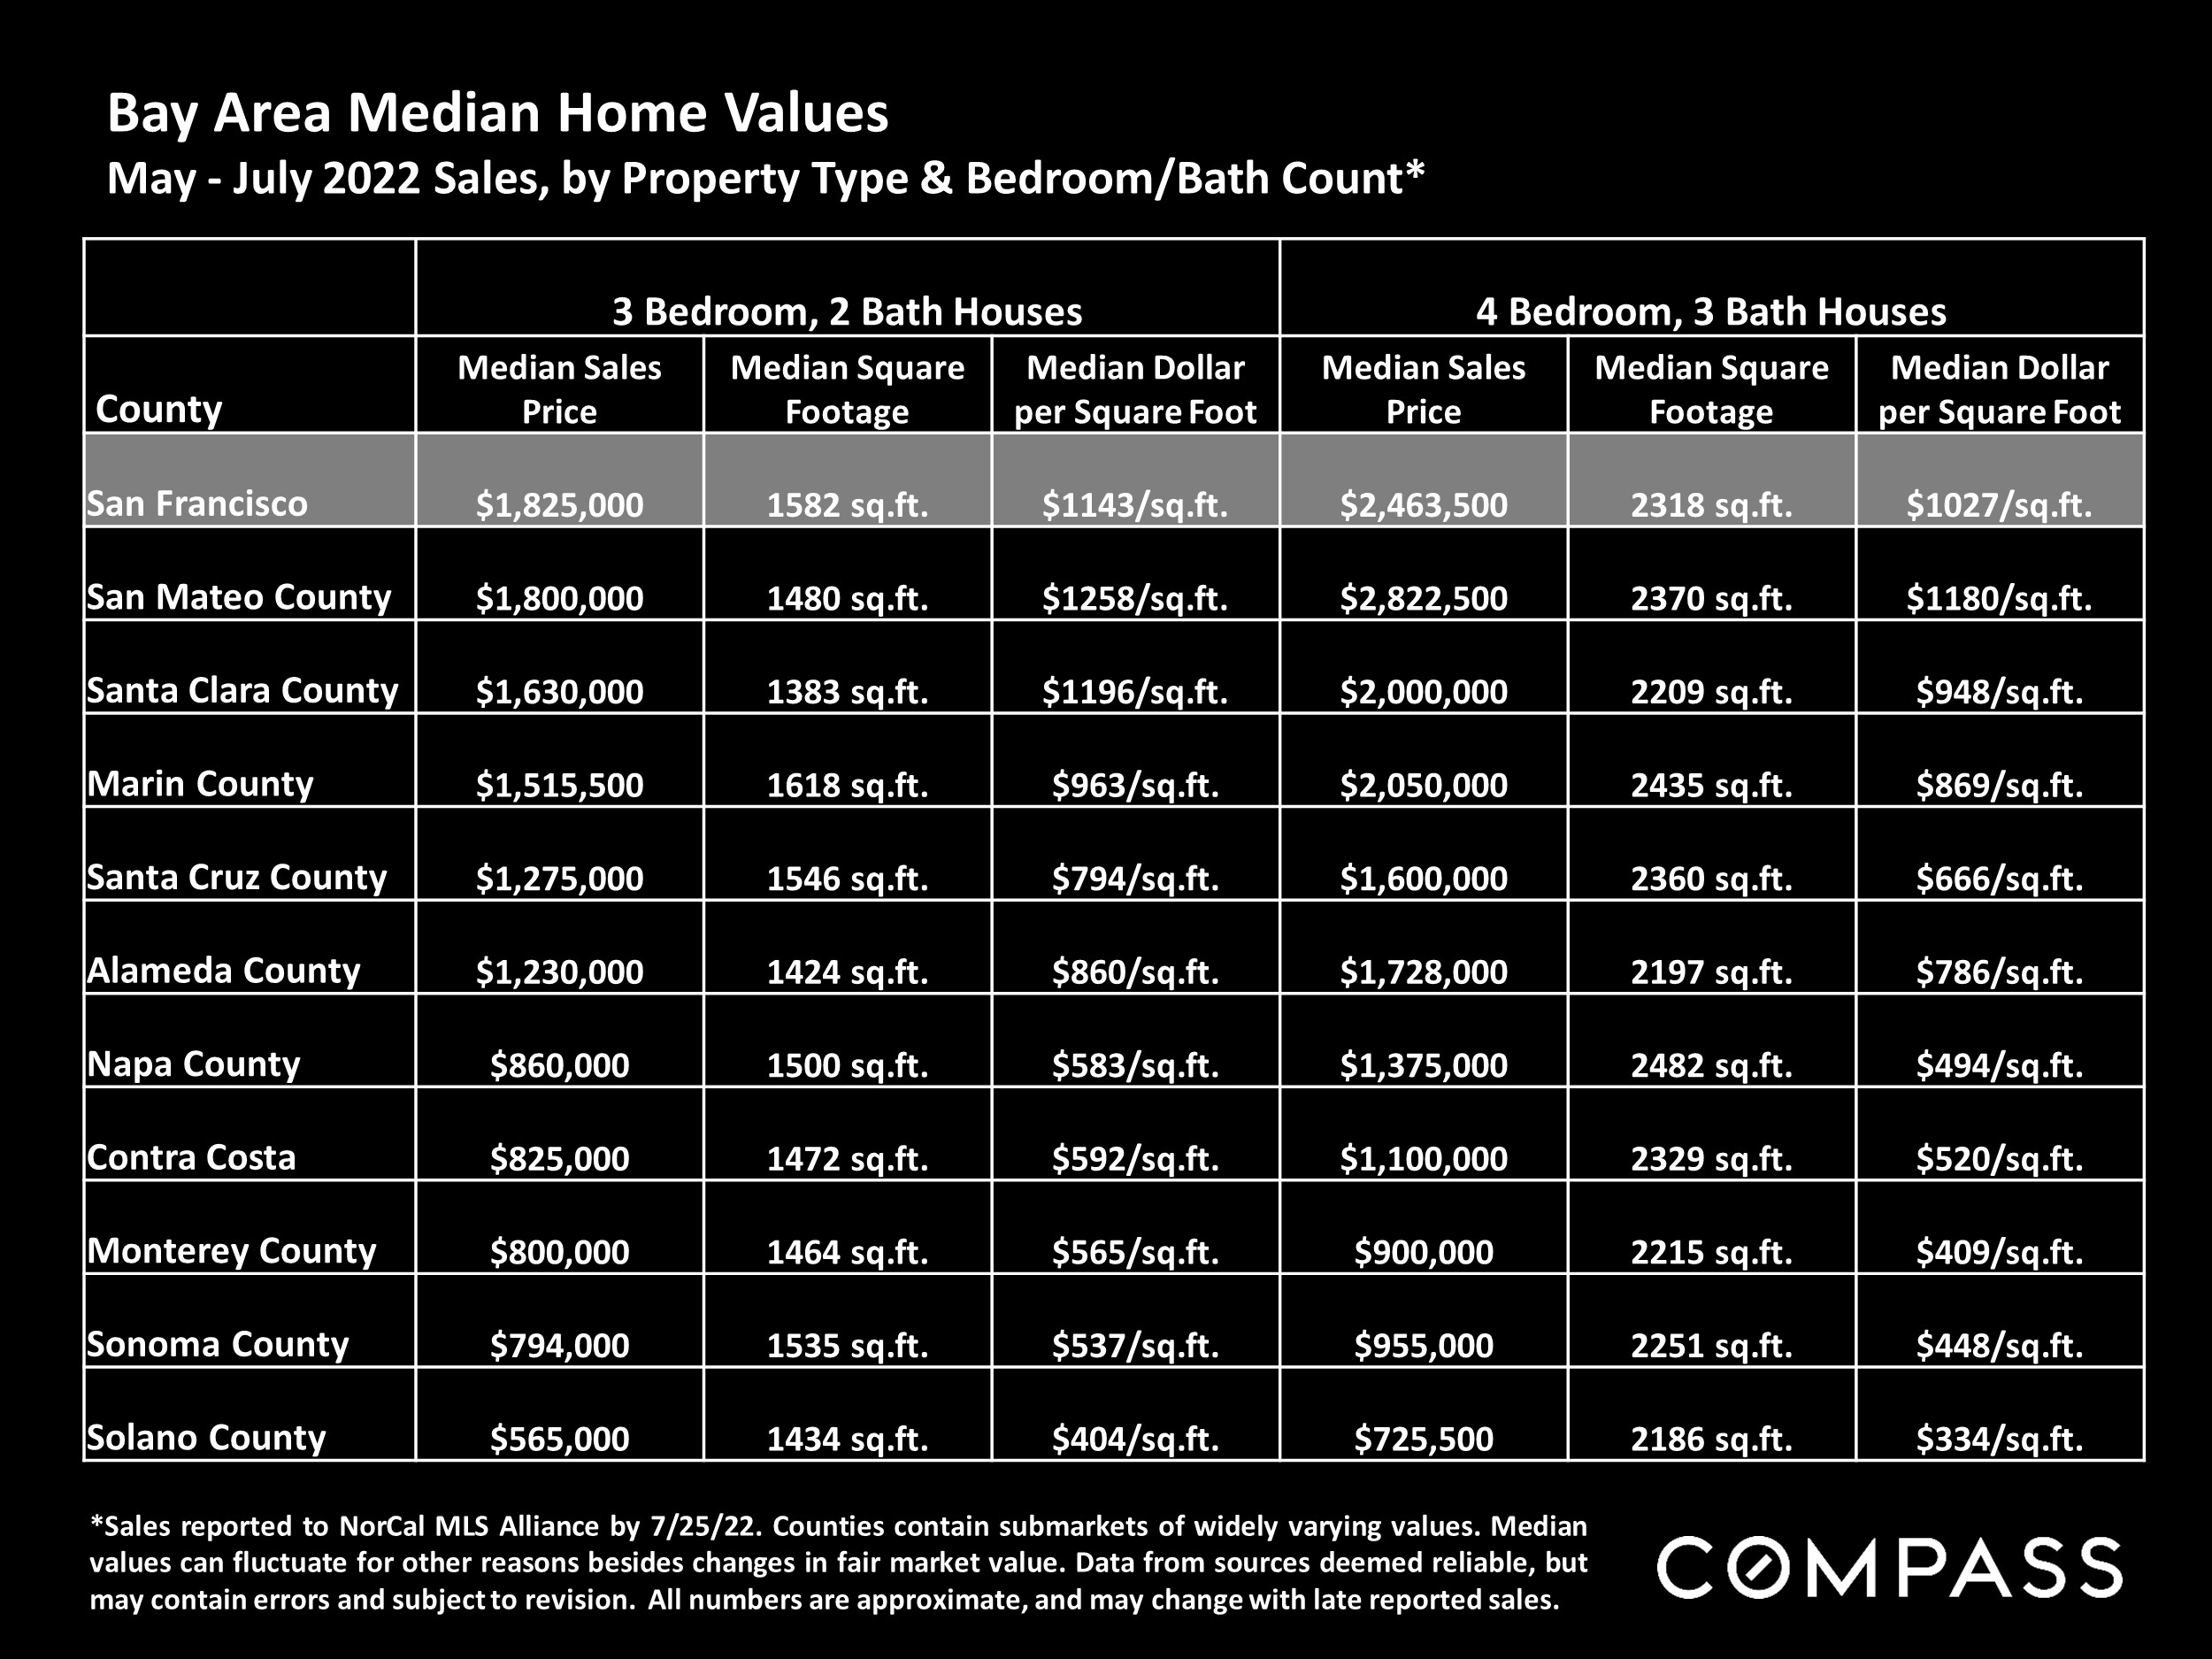
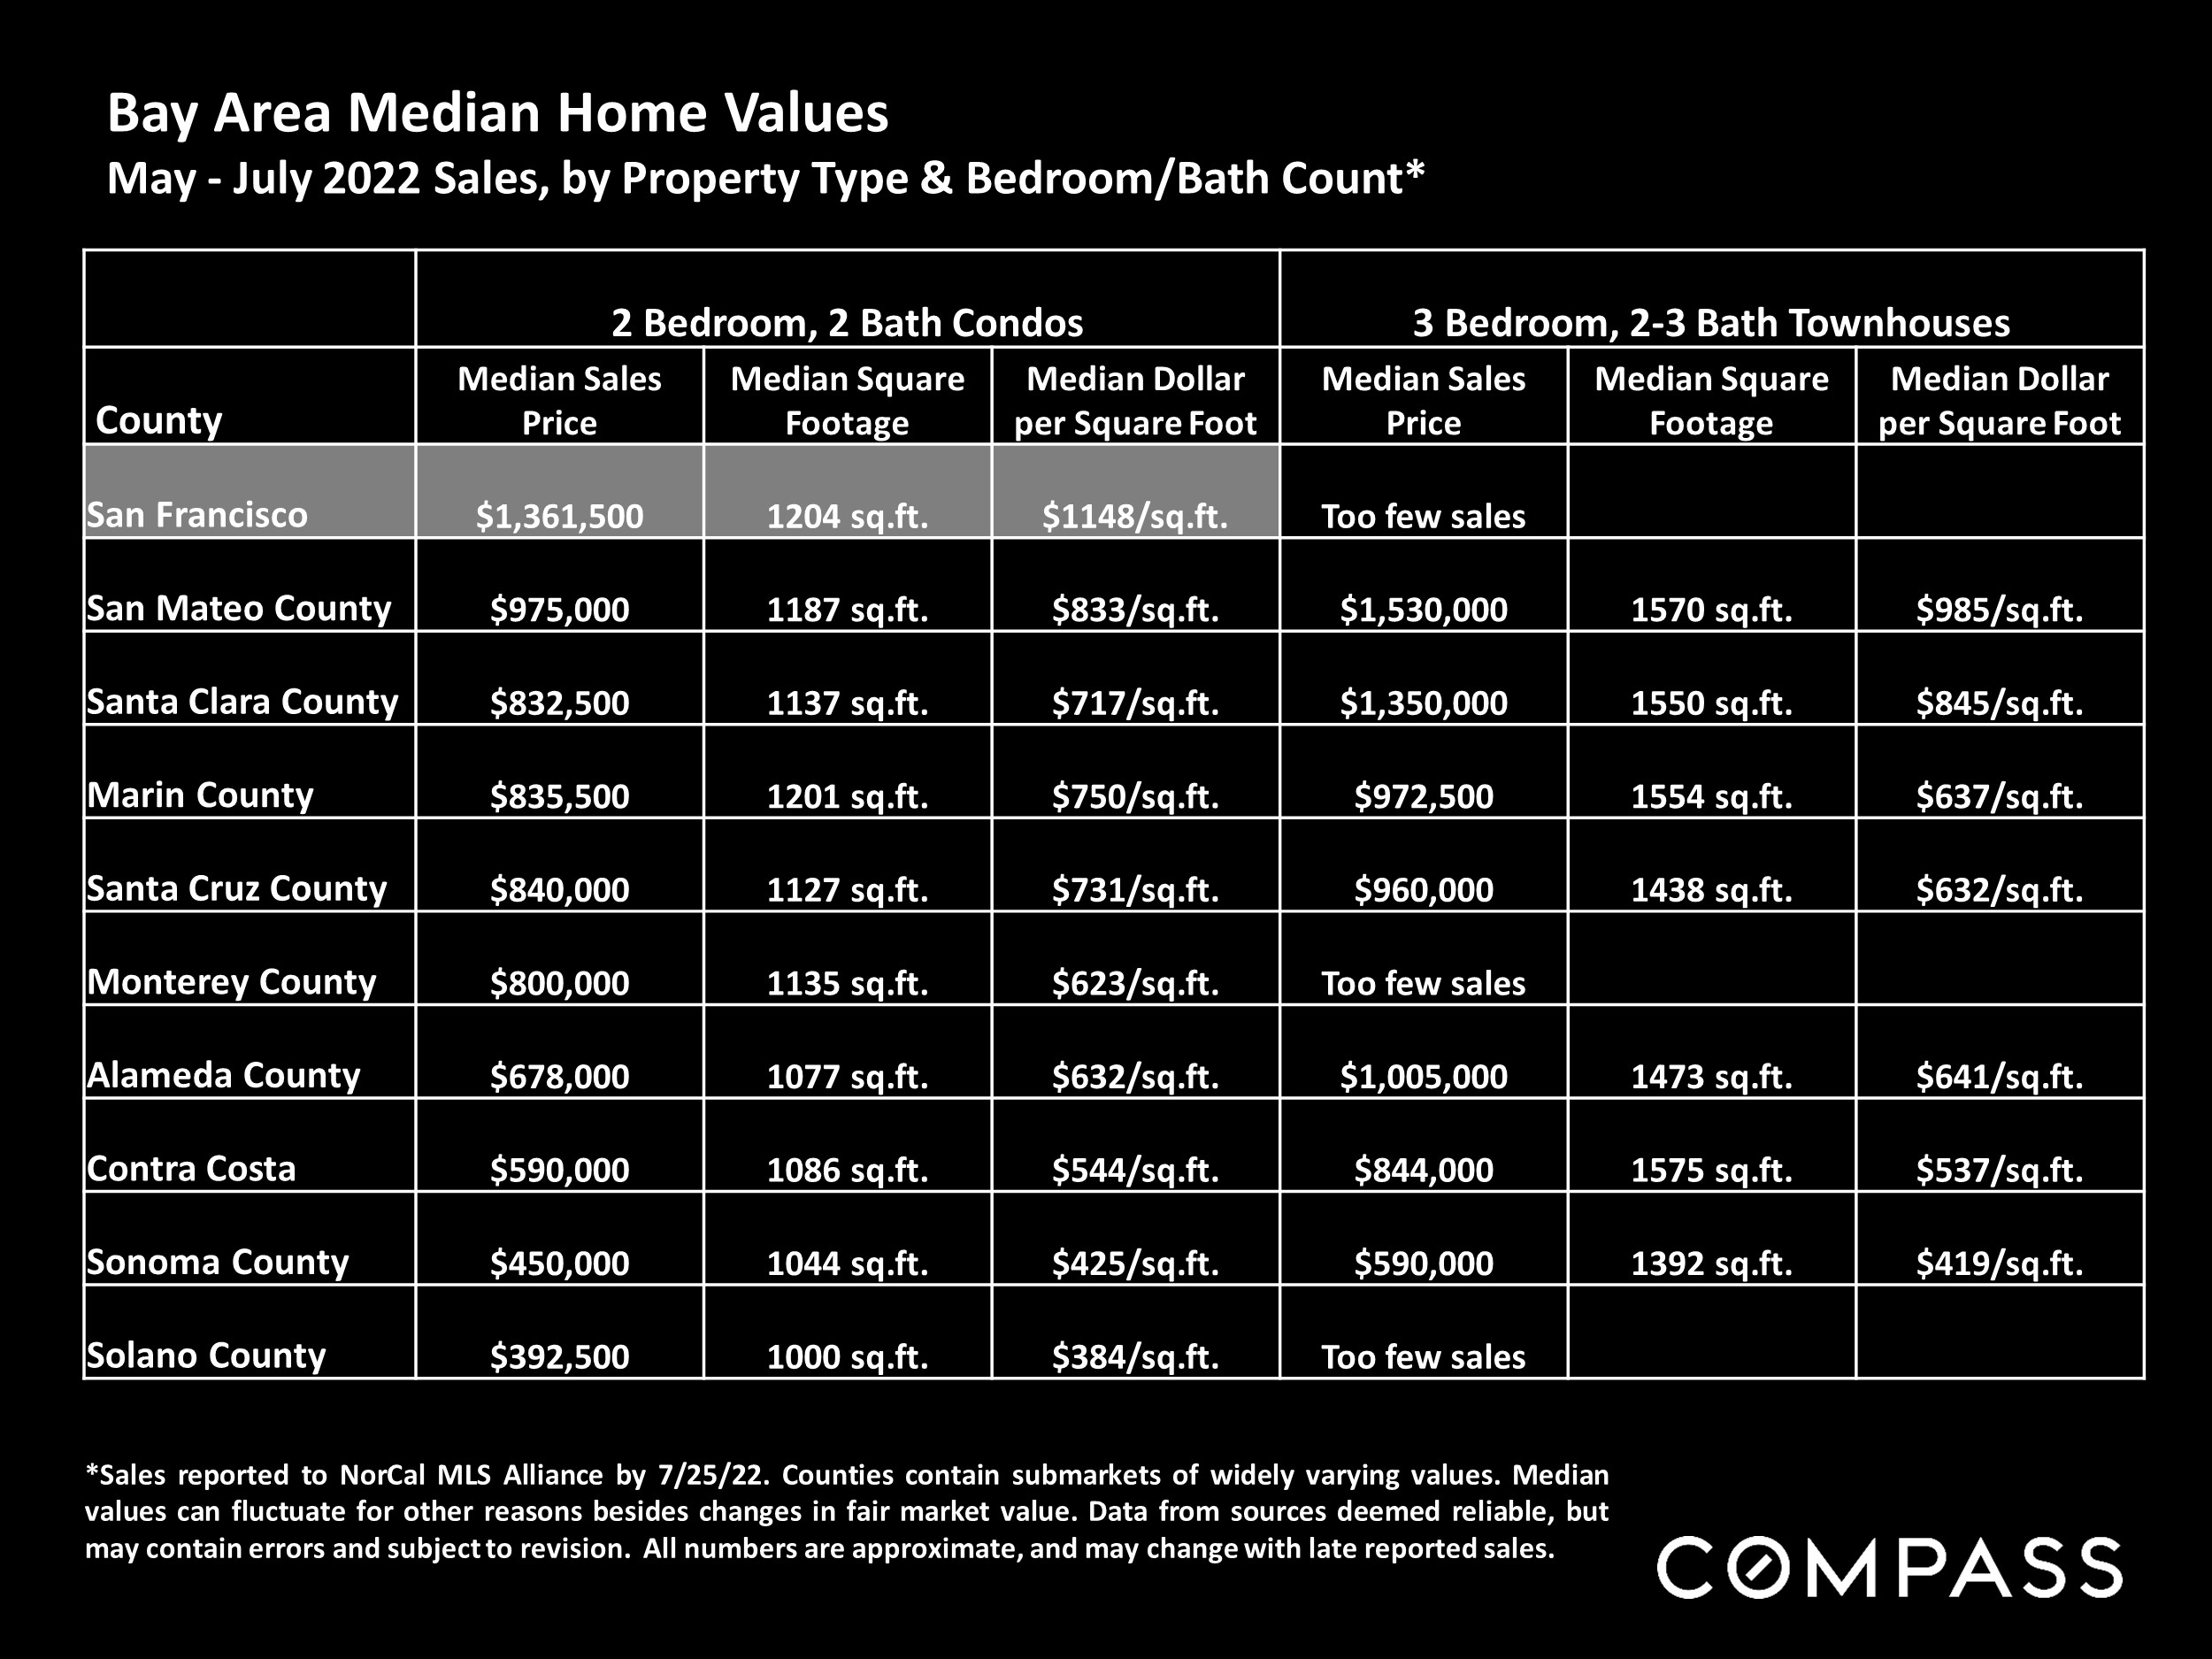
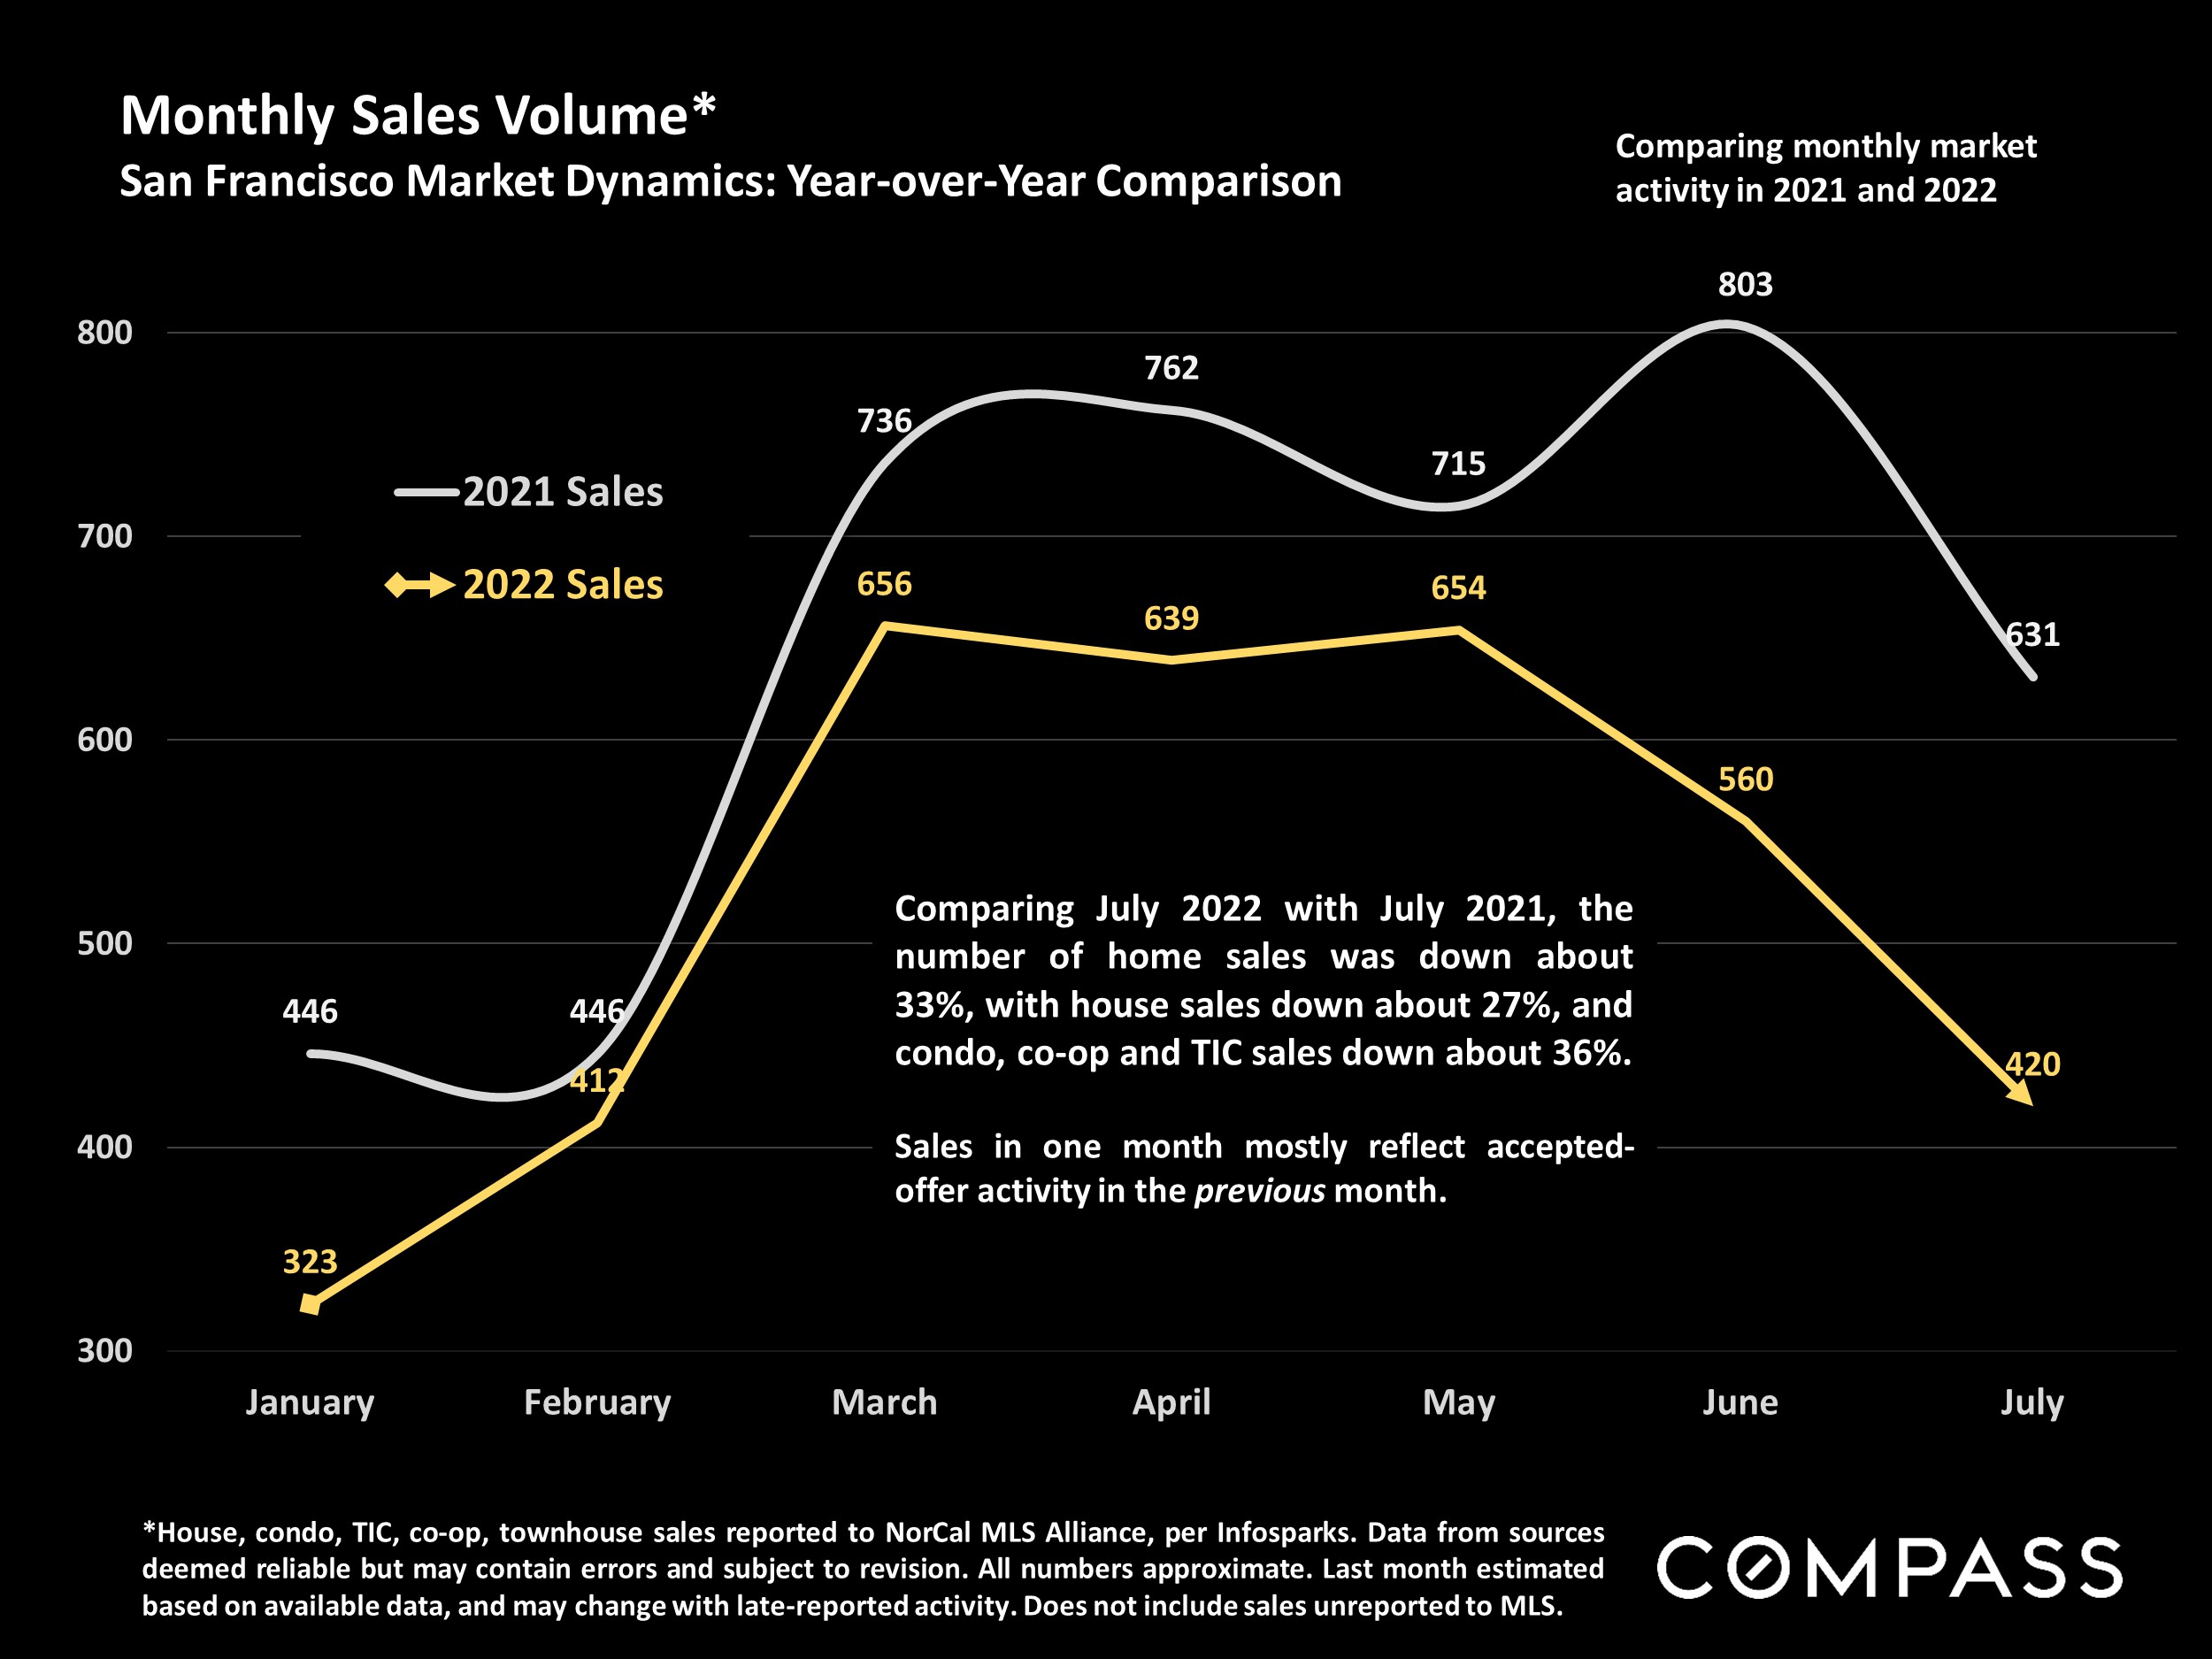
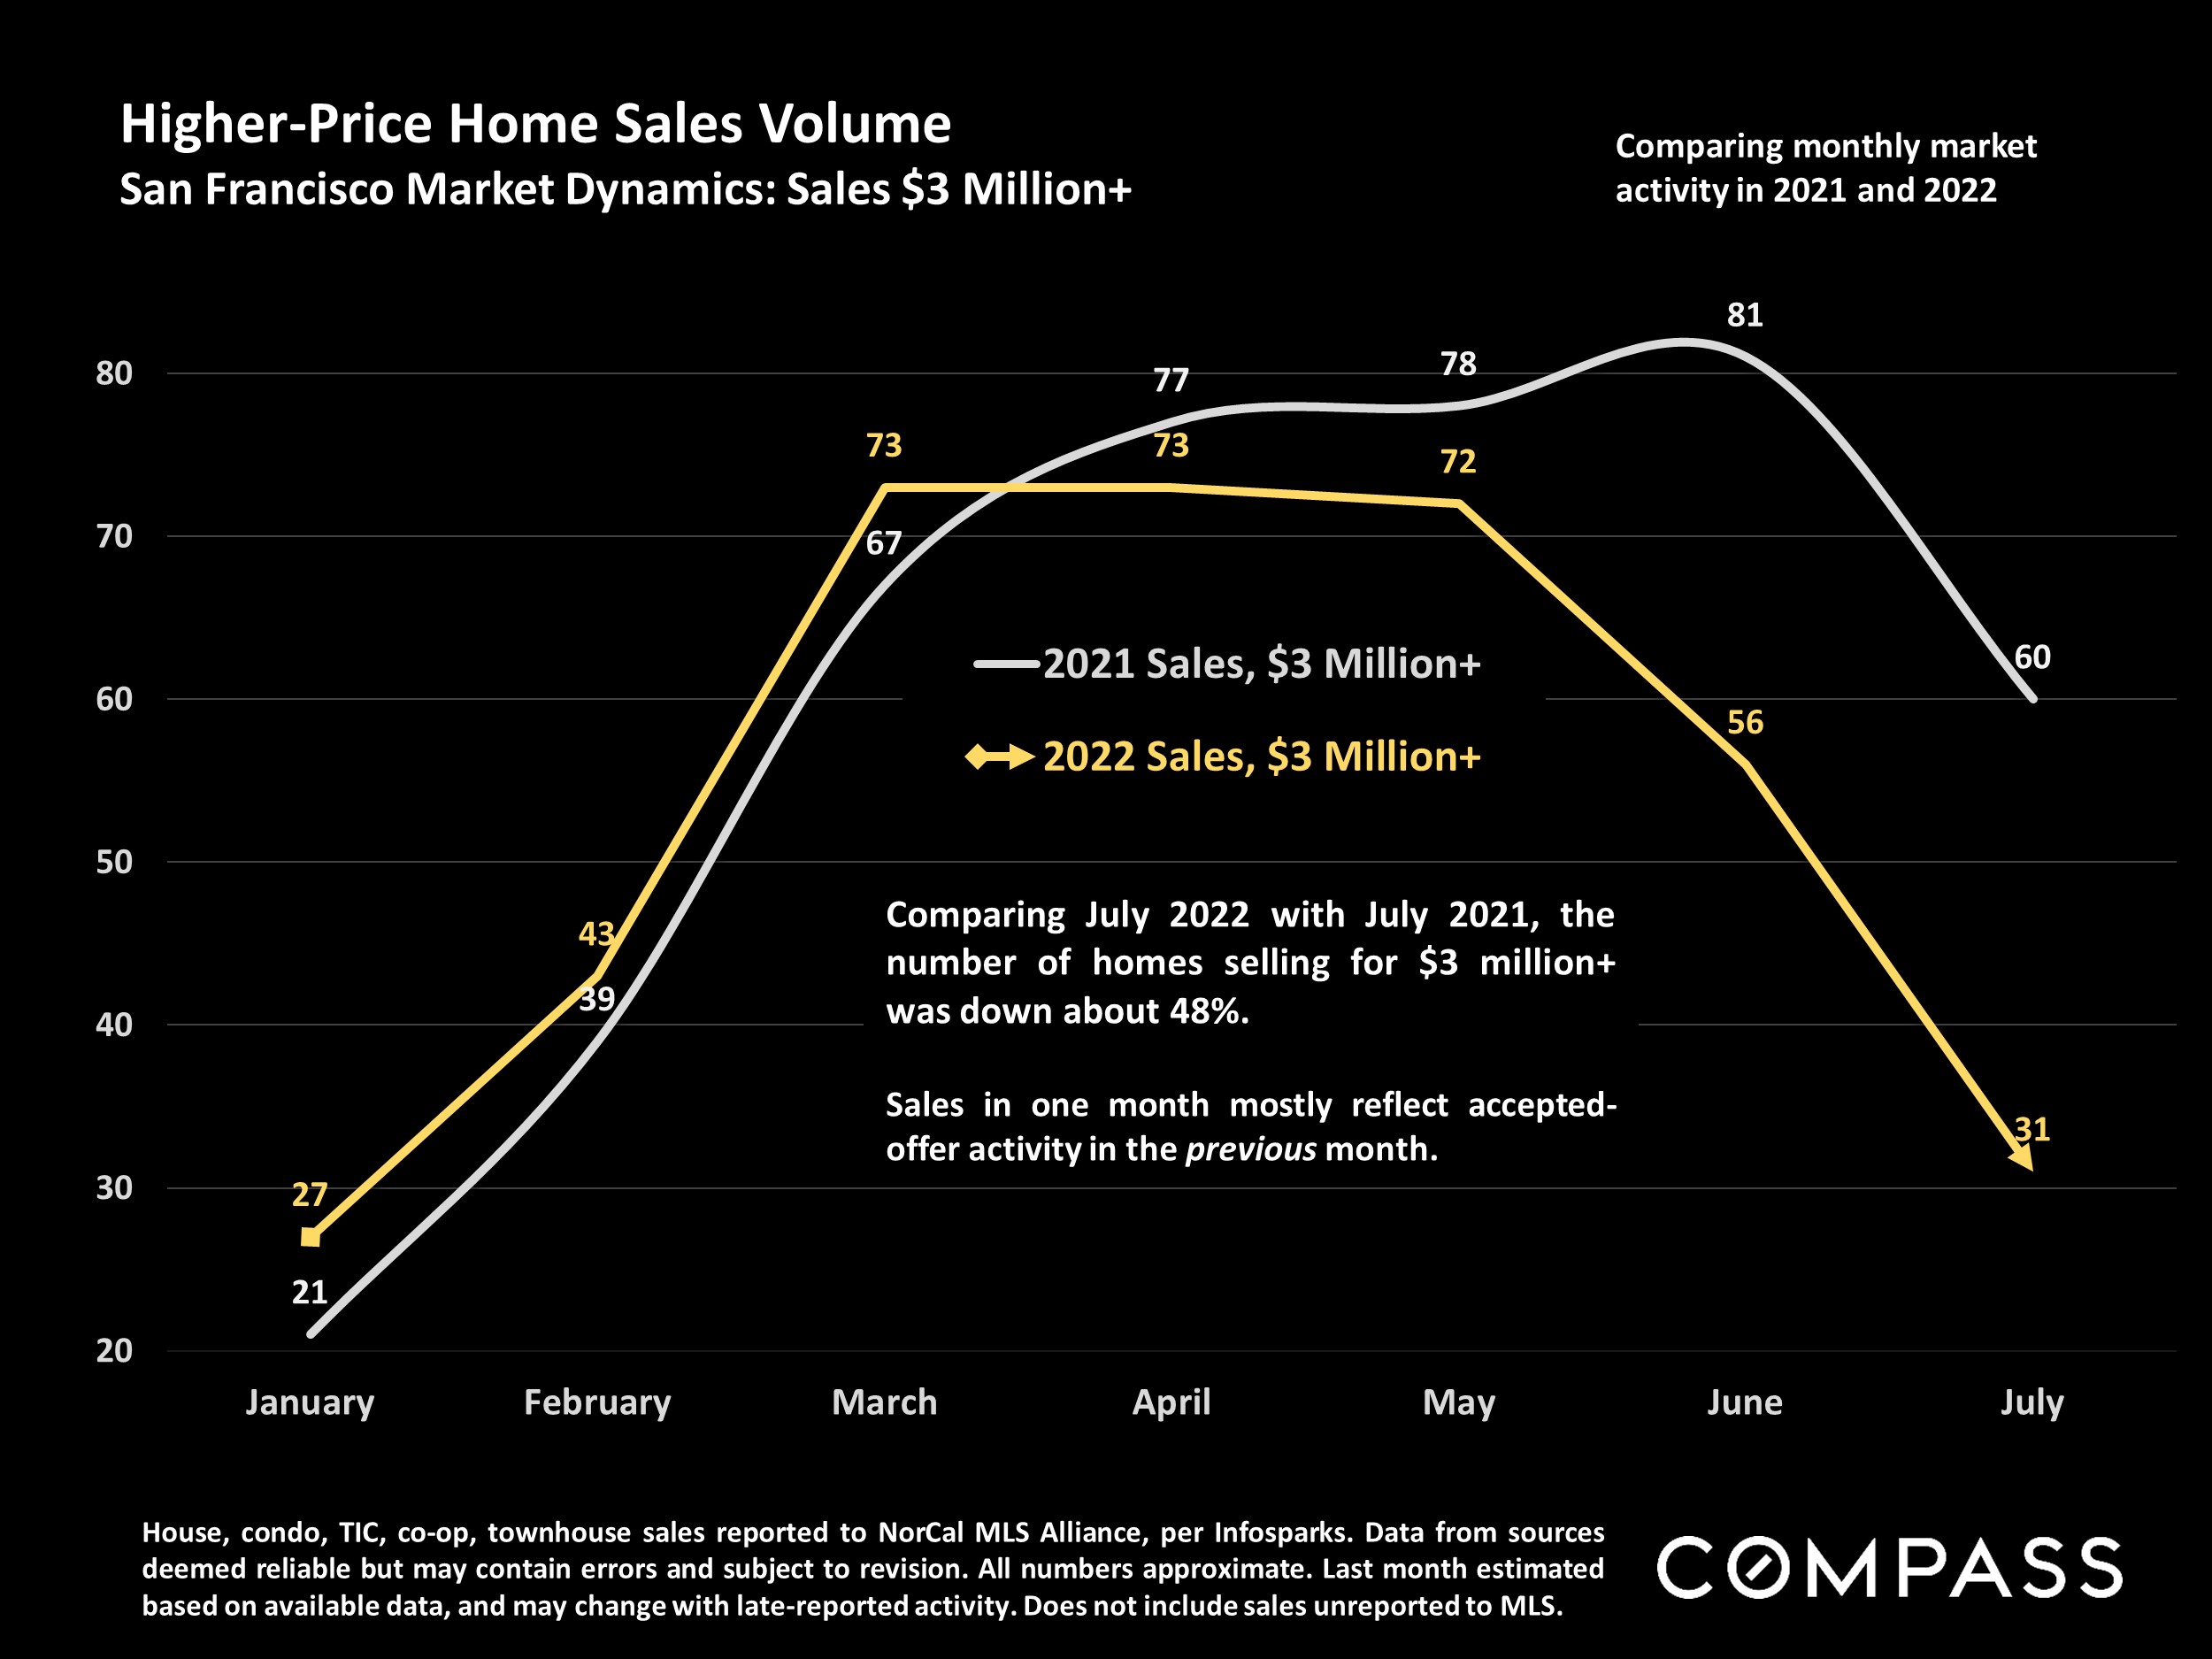
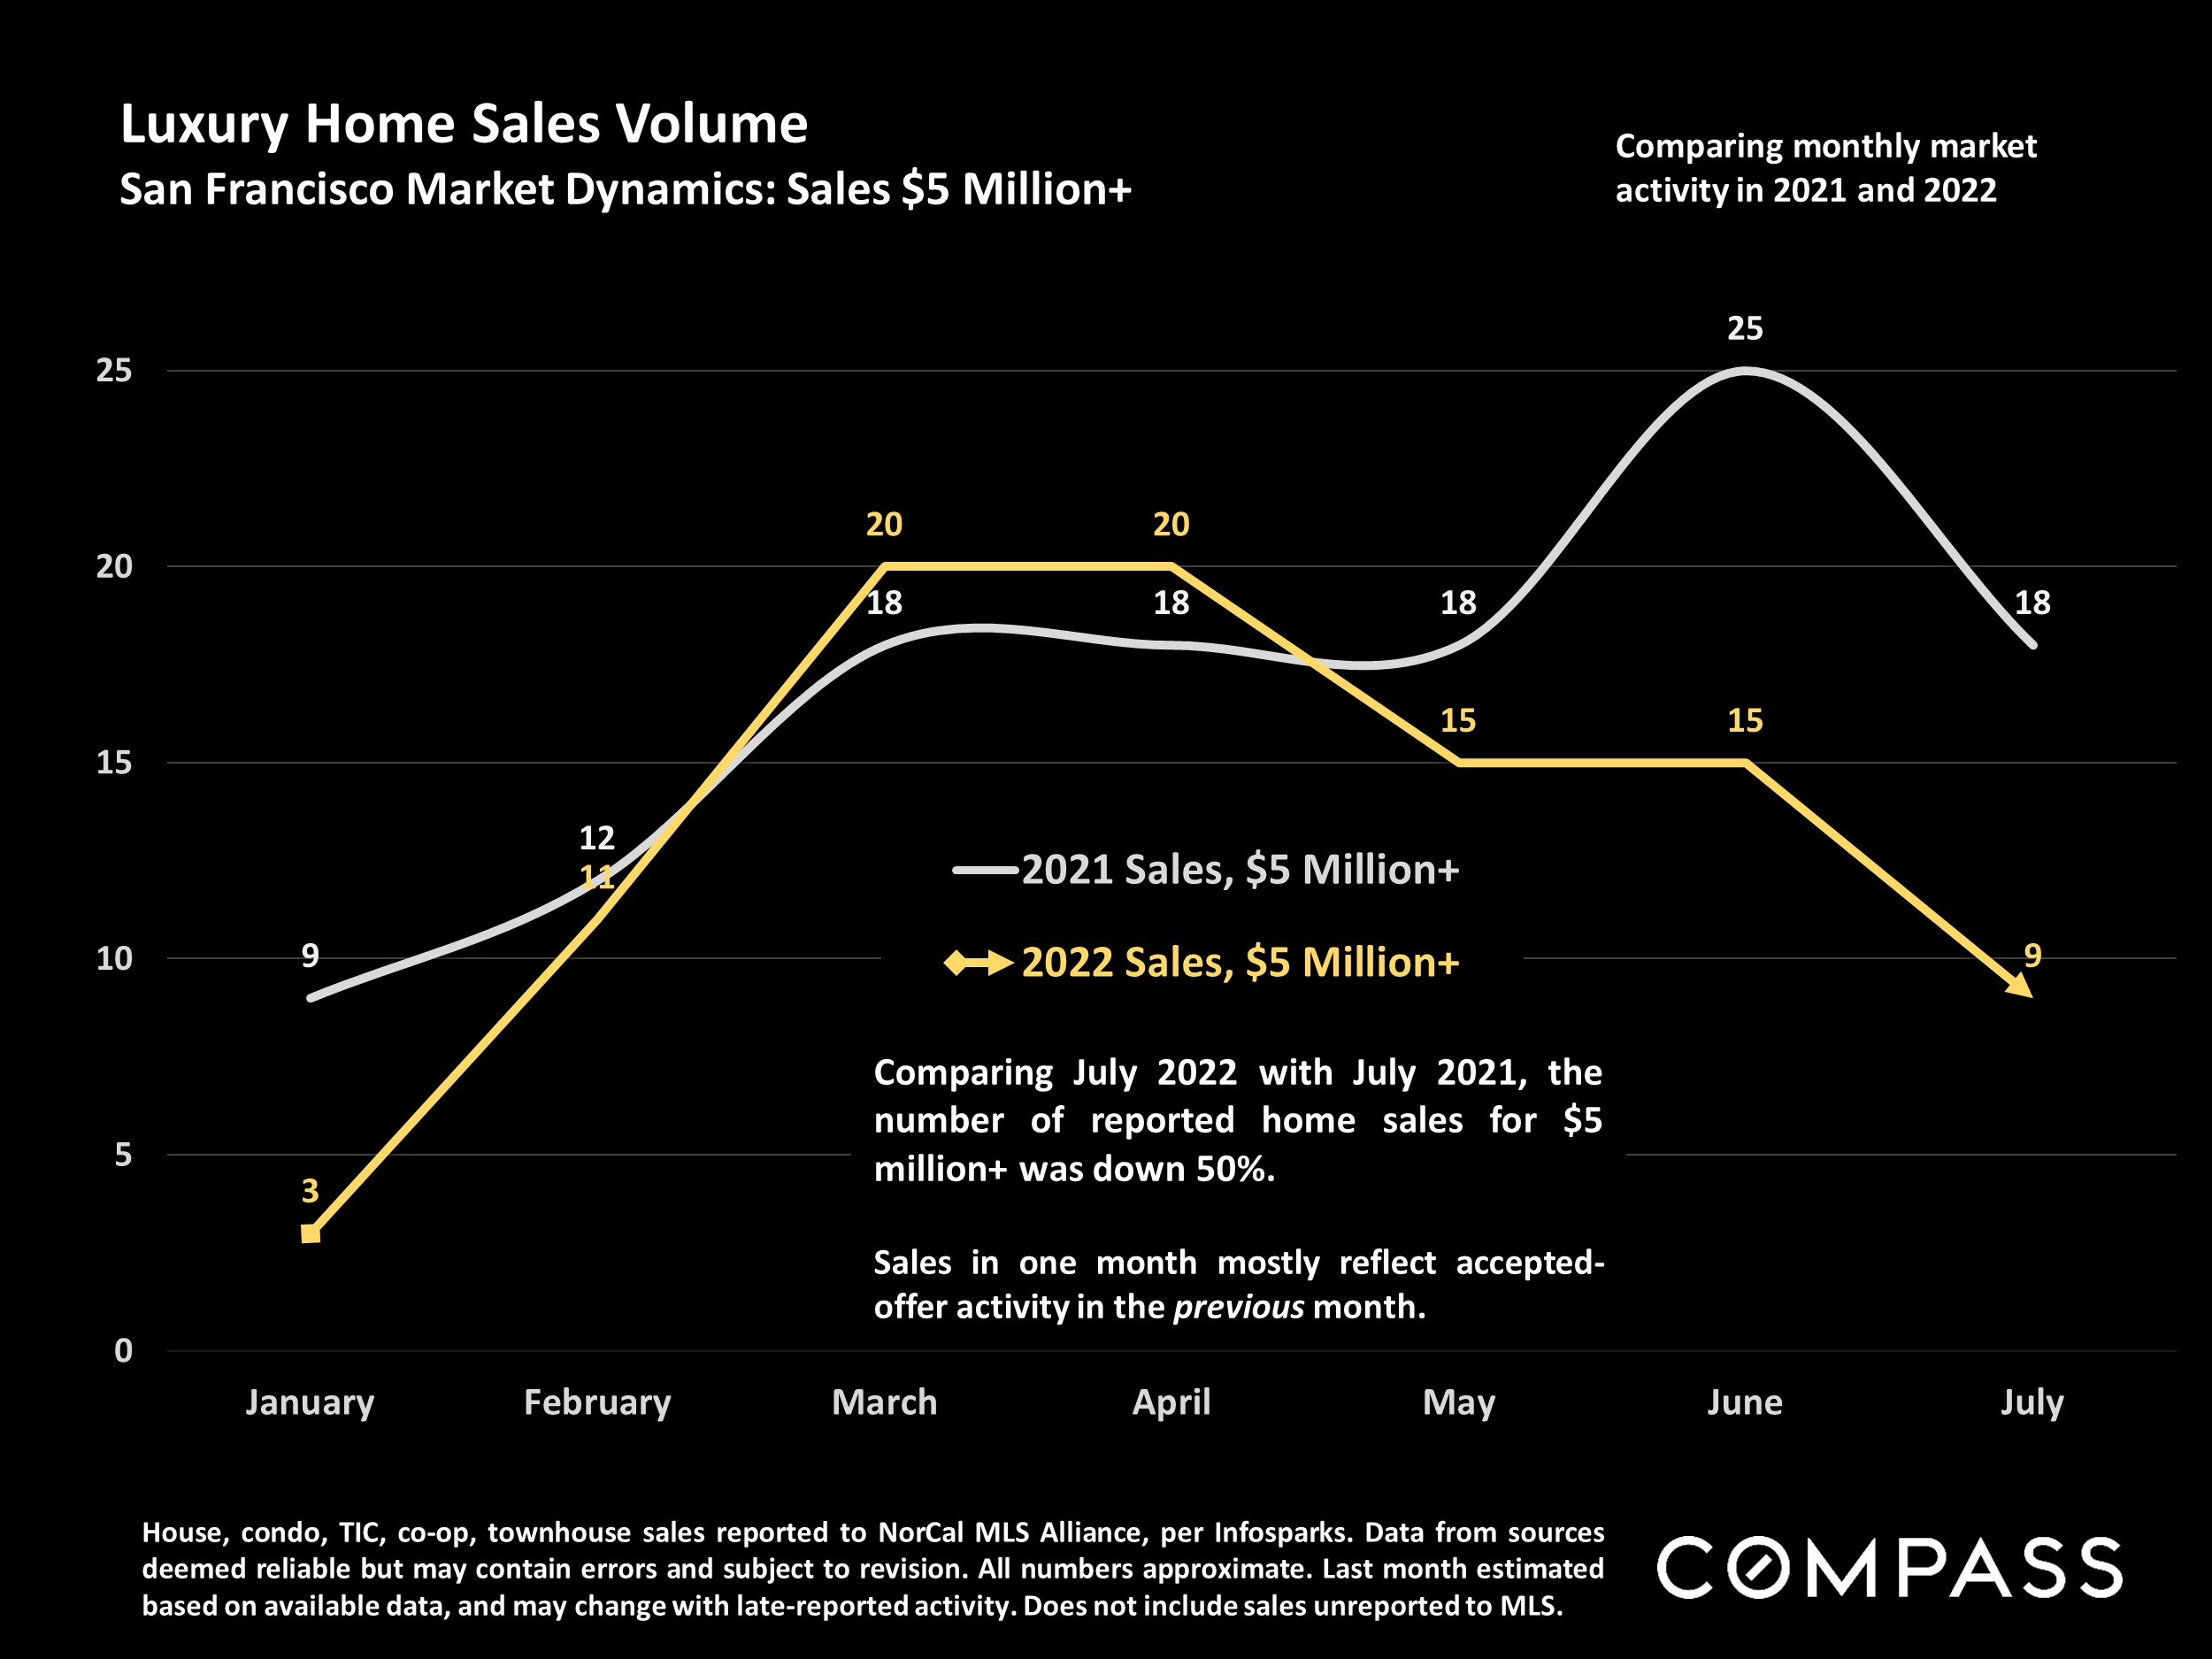
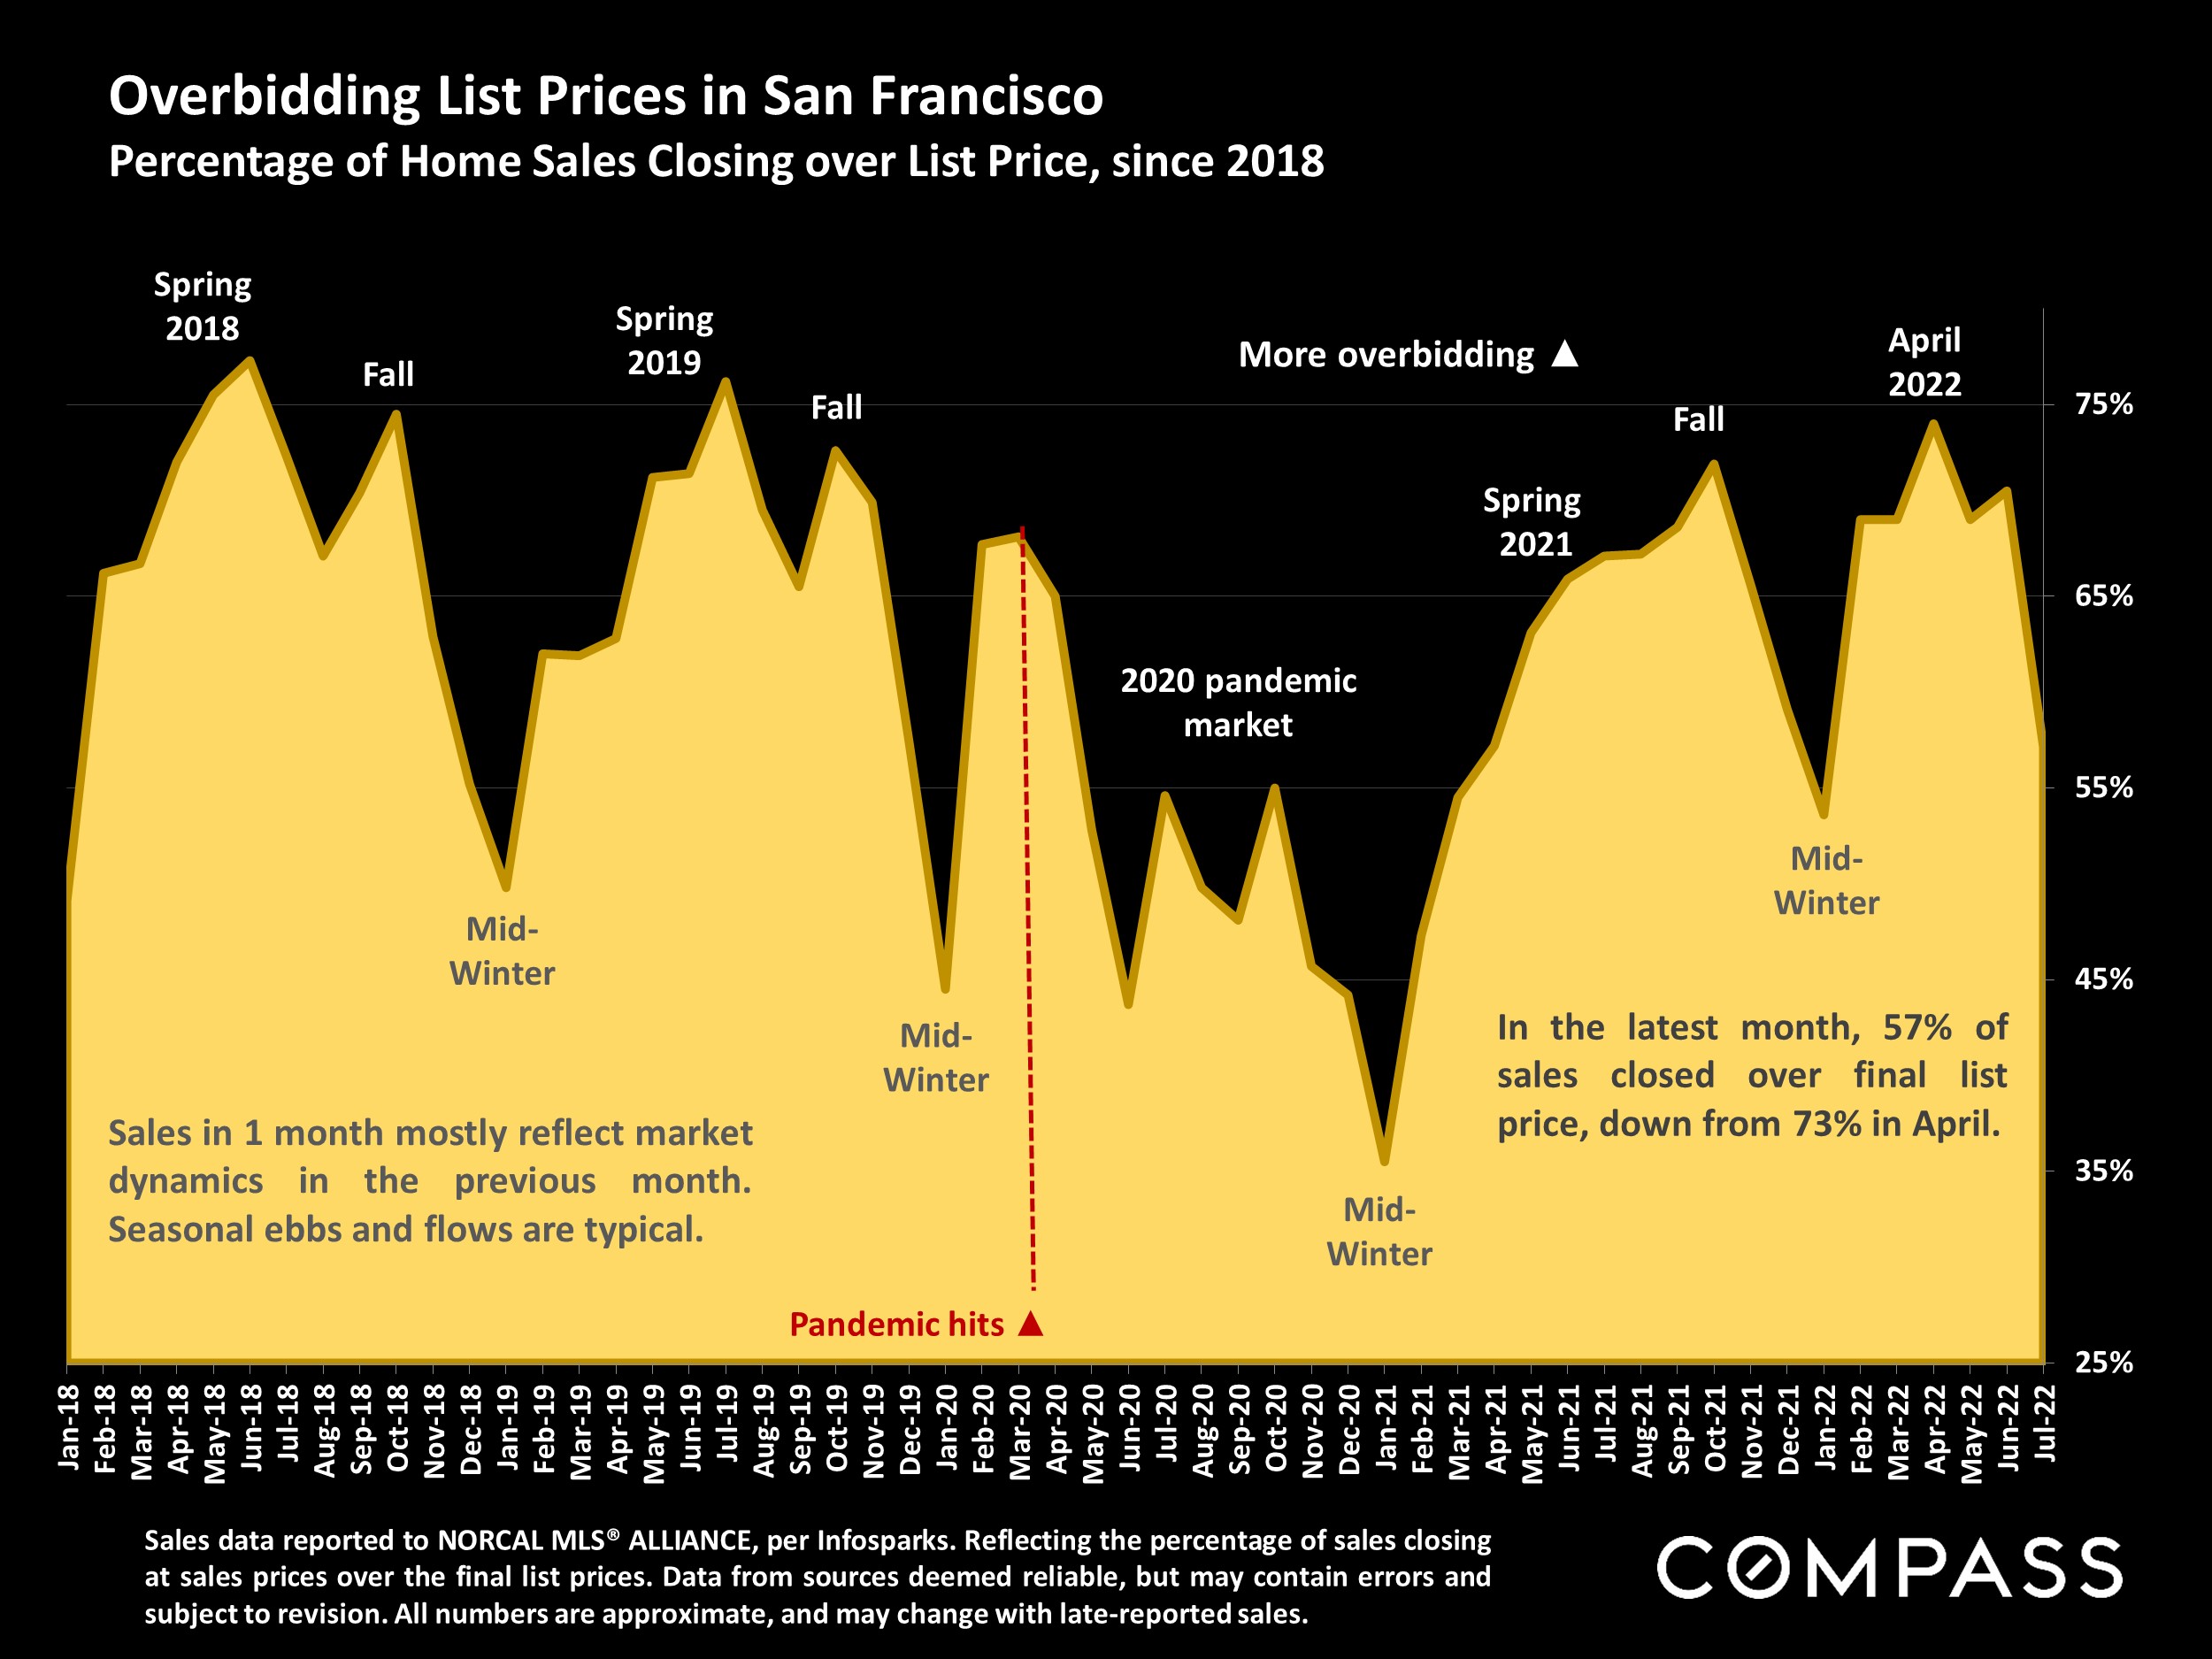
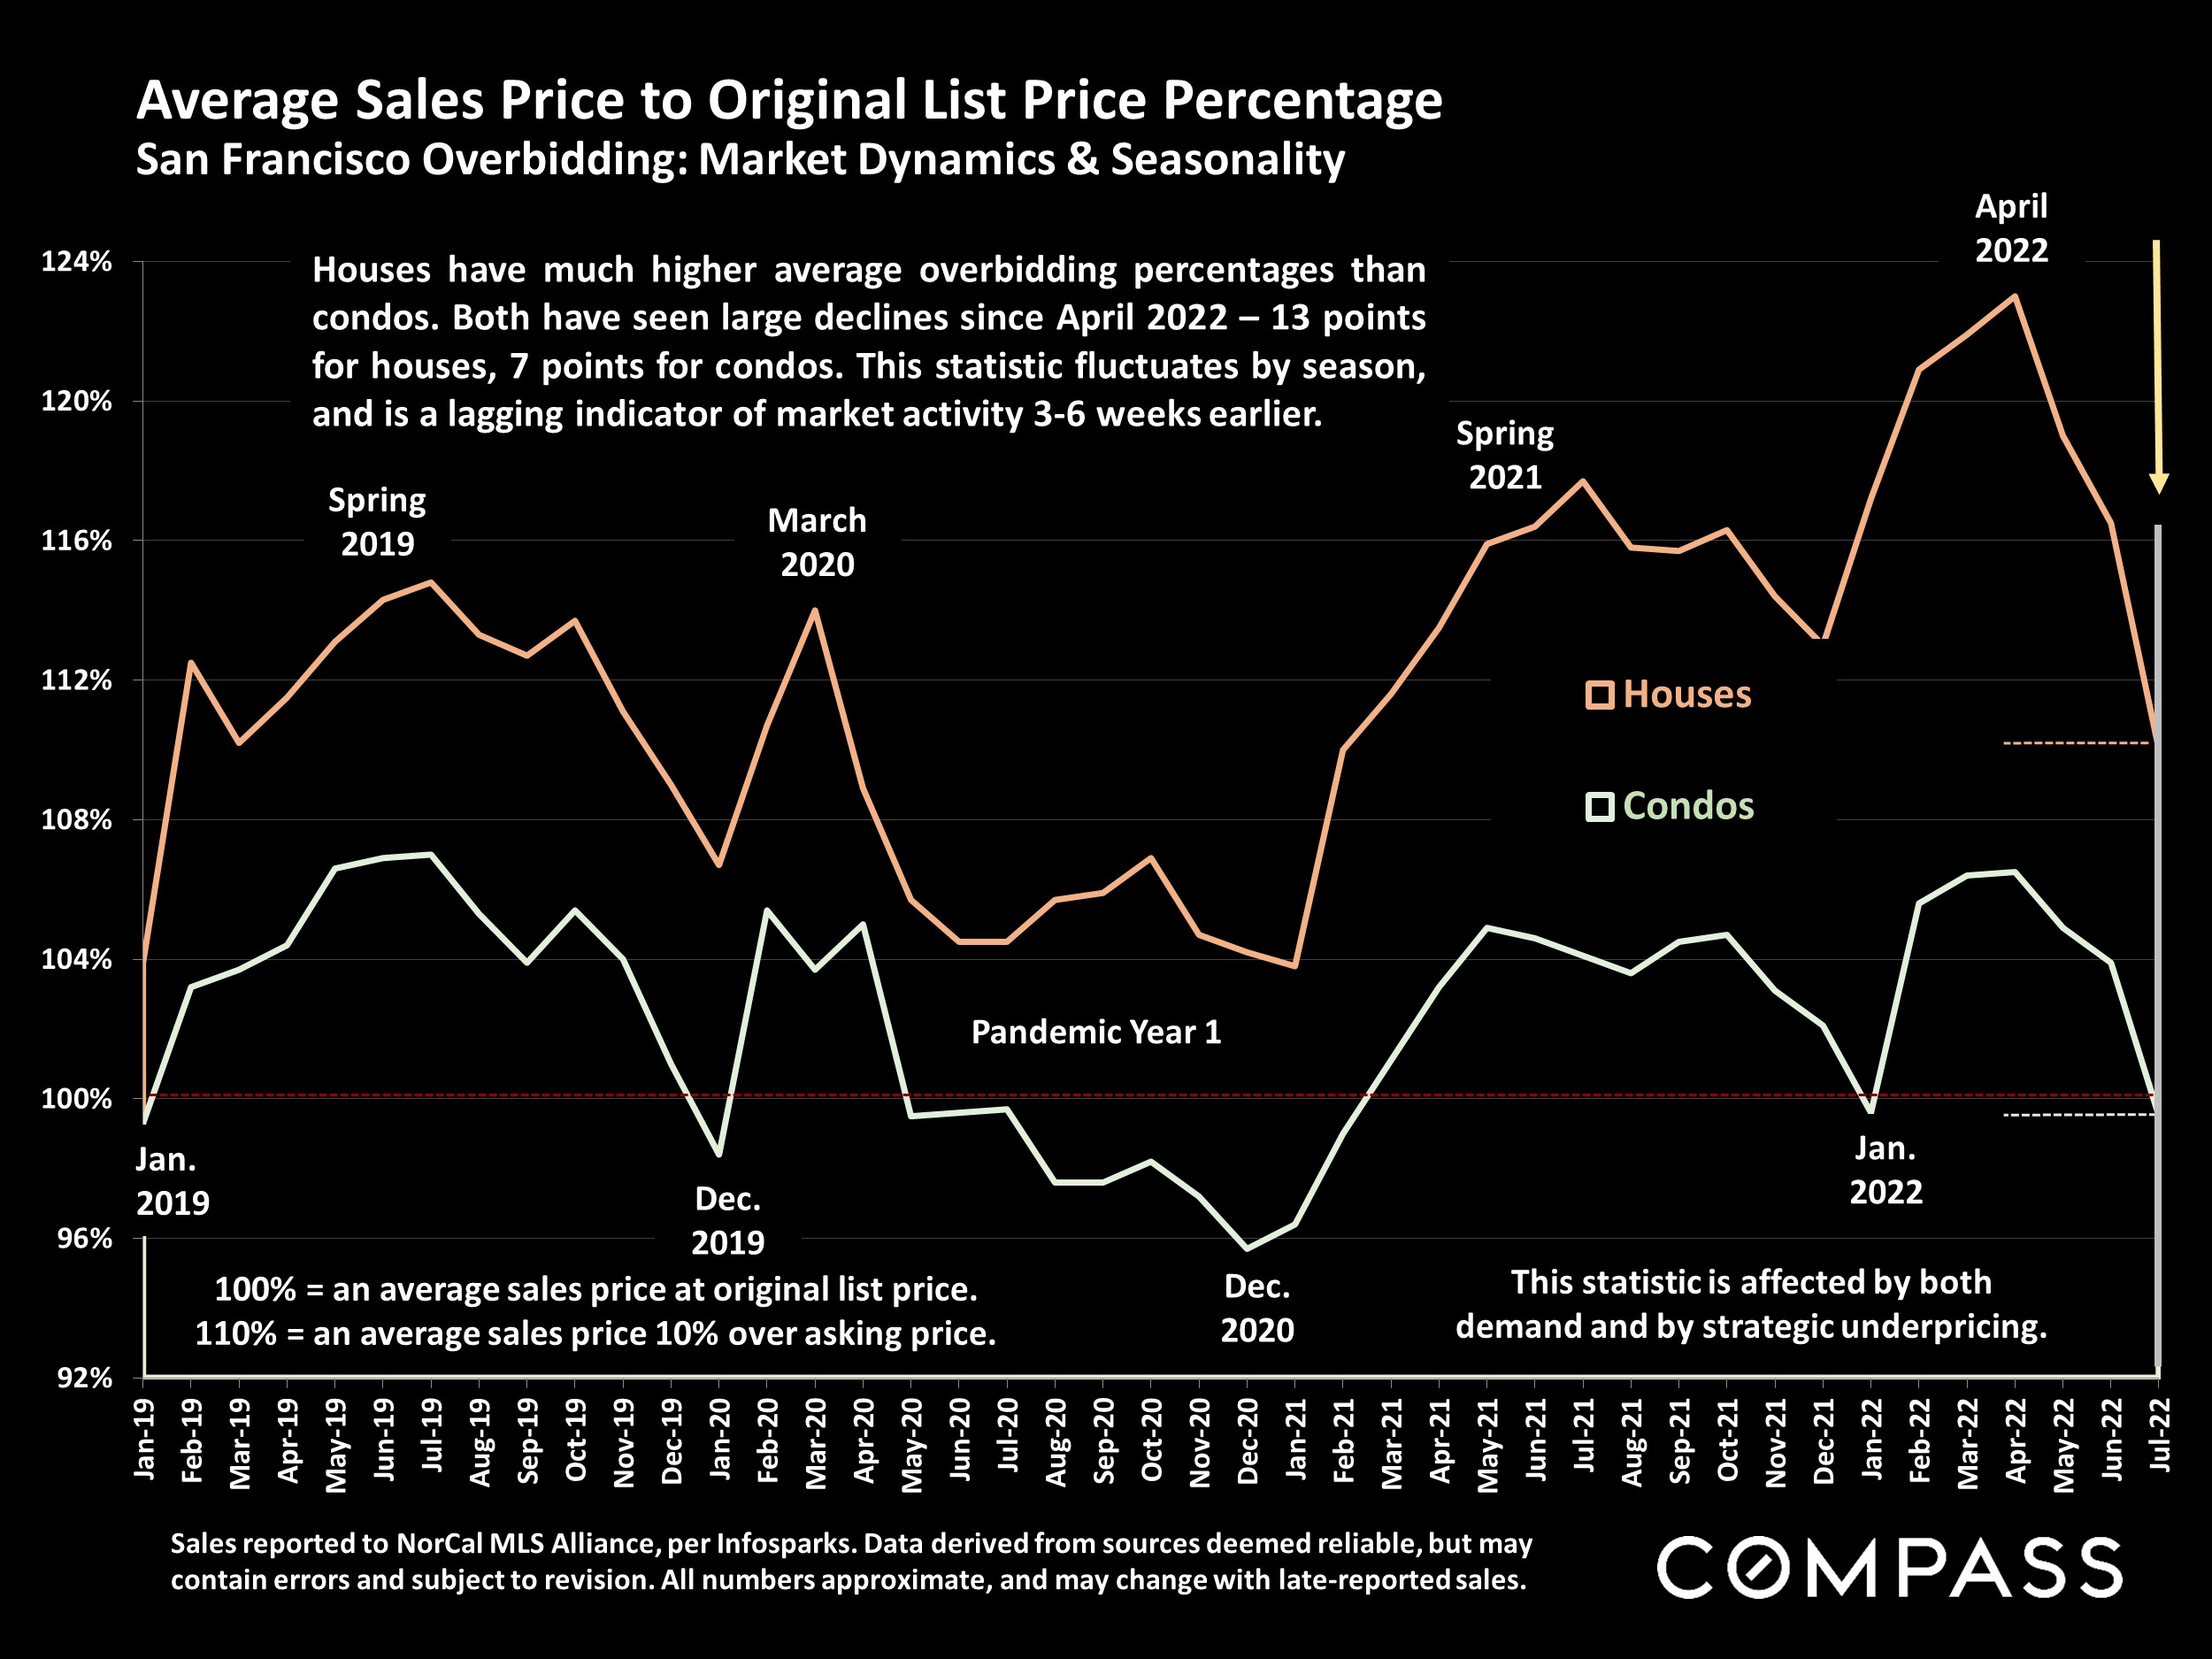
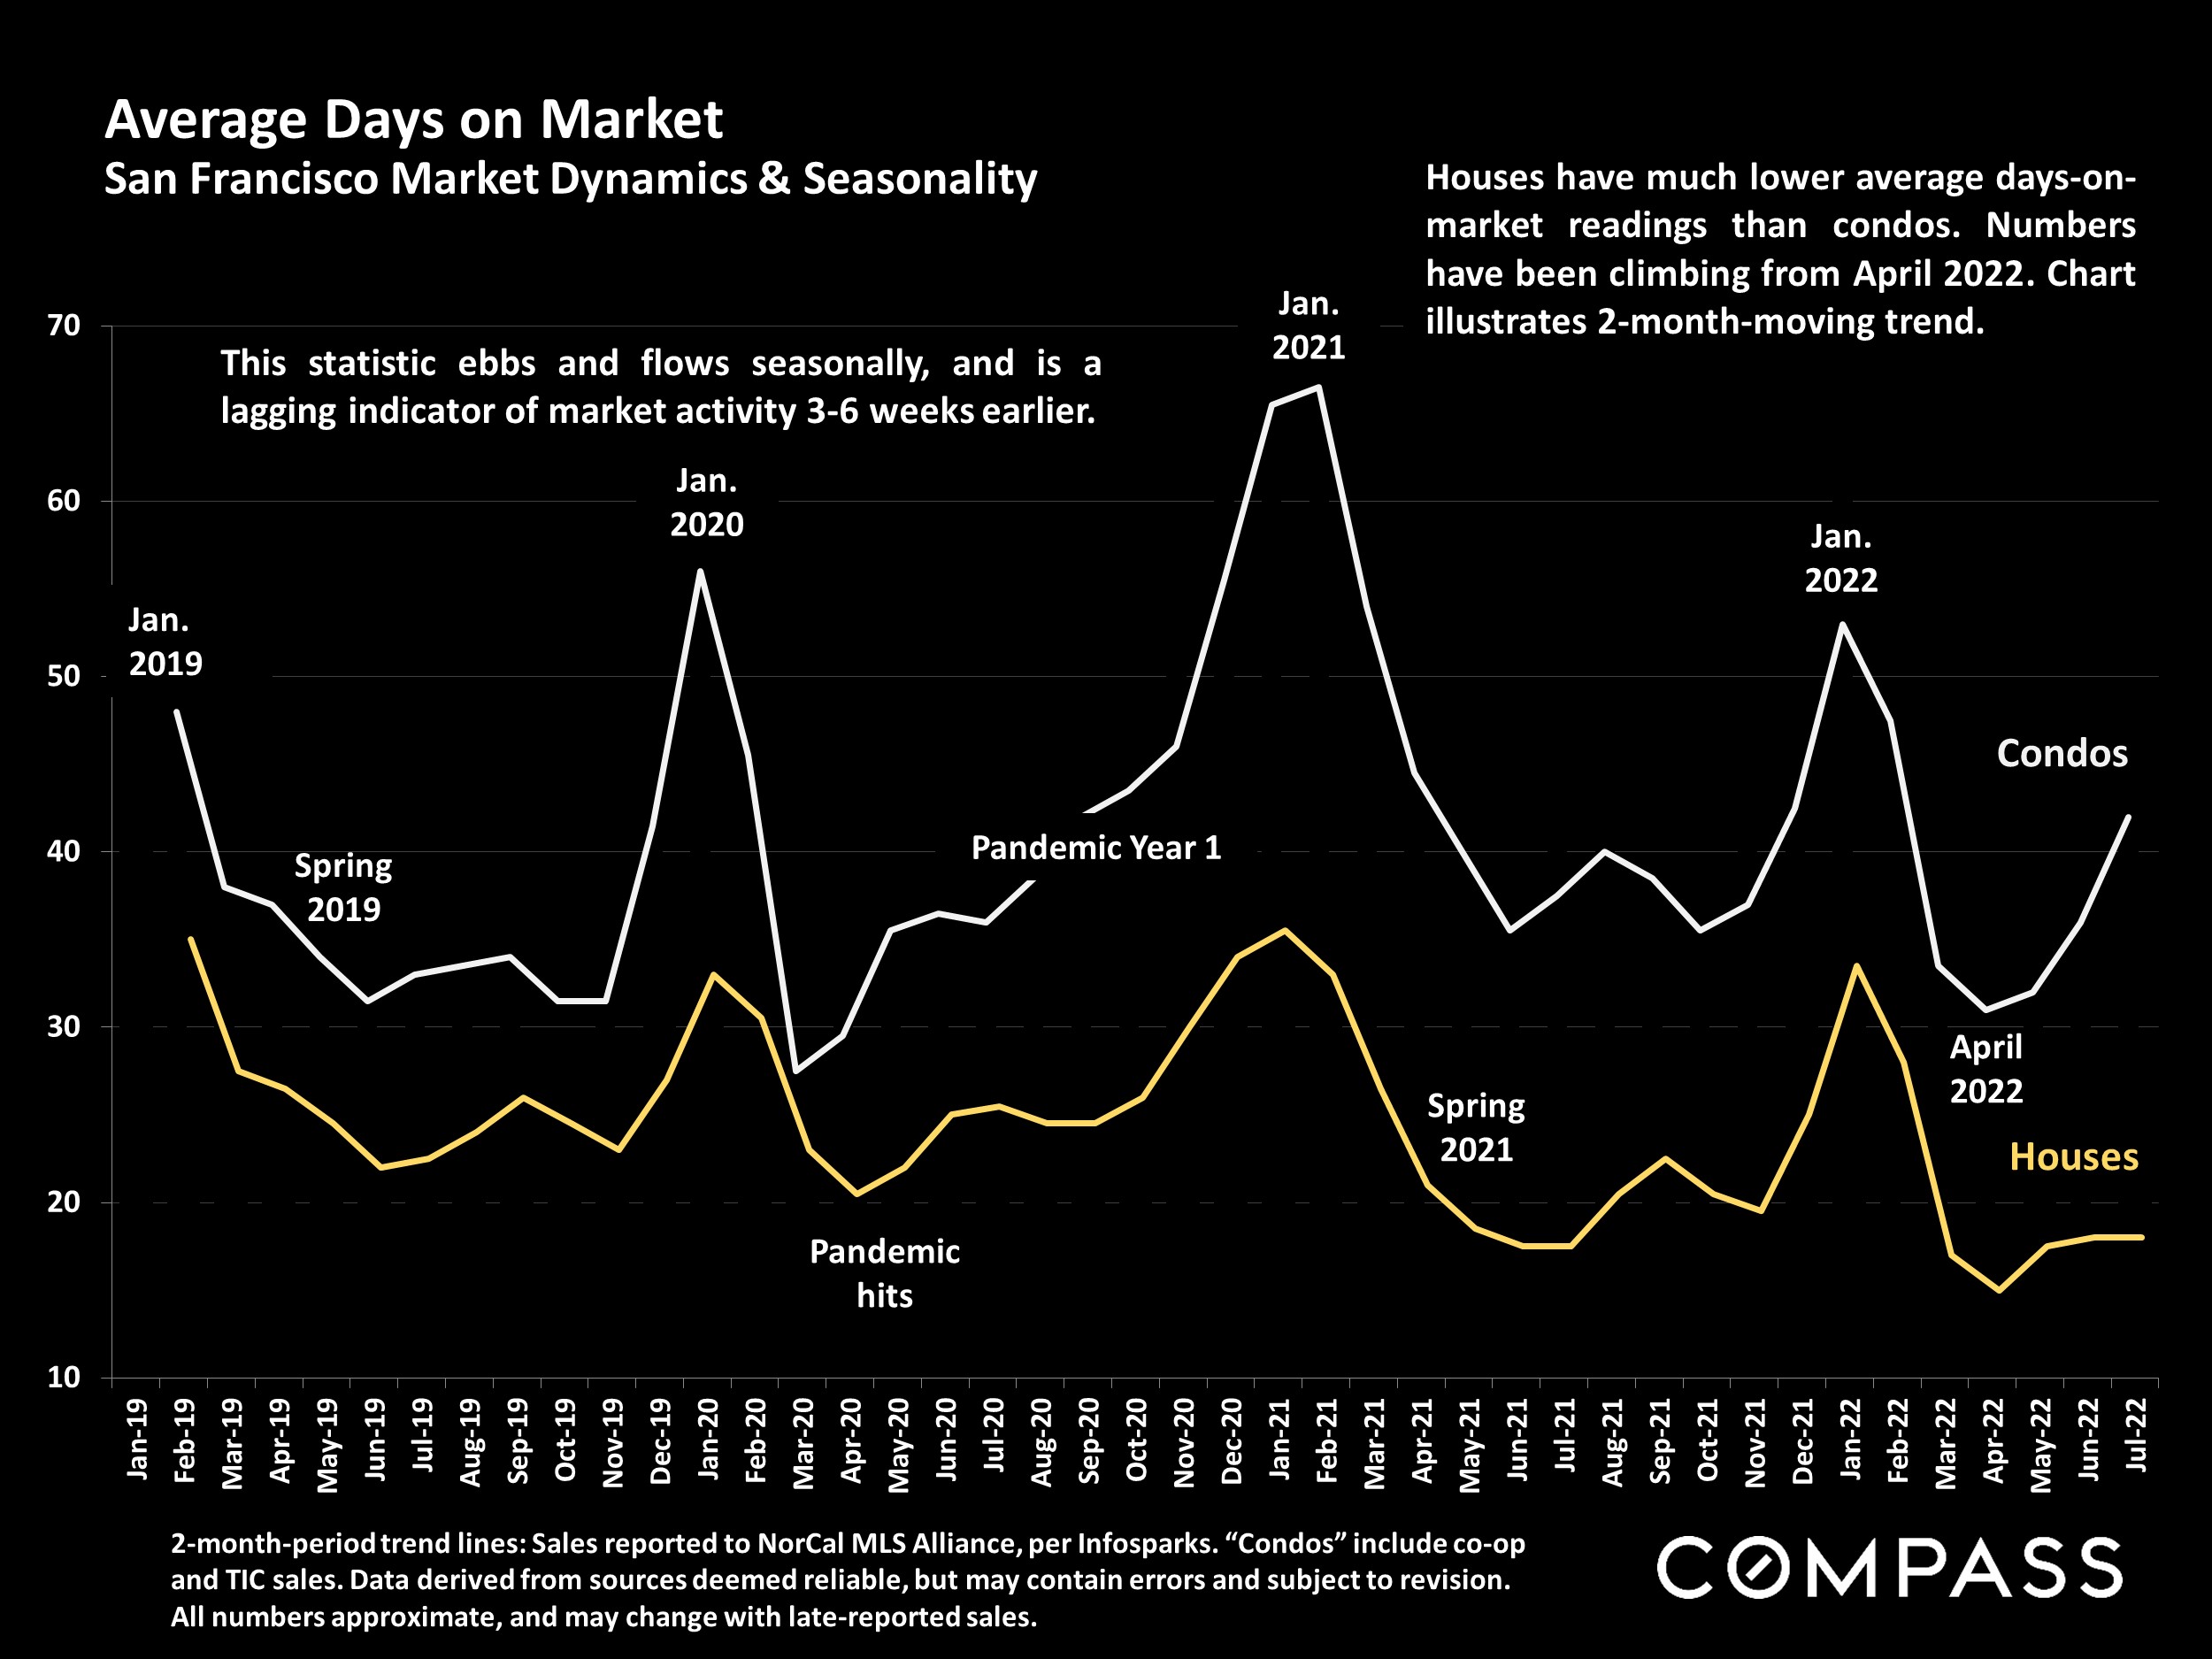
Across the Bay Area, markets have continued to slow and cool. As illustrated in this report, dramatic changes in demand, inventory, overbidding, price reductions, and year-over-year appreciation rates have usually occurred. Buying and selling continues: Over 5200 home sales were reported to MLS from Napa County to Monterey in July 2022 – many of them selling quickly for over asking price – but that number is down 38% from last year. Median home price appreciation rates in the
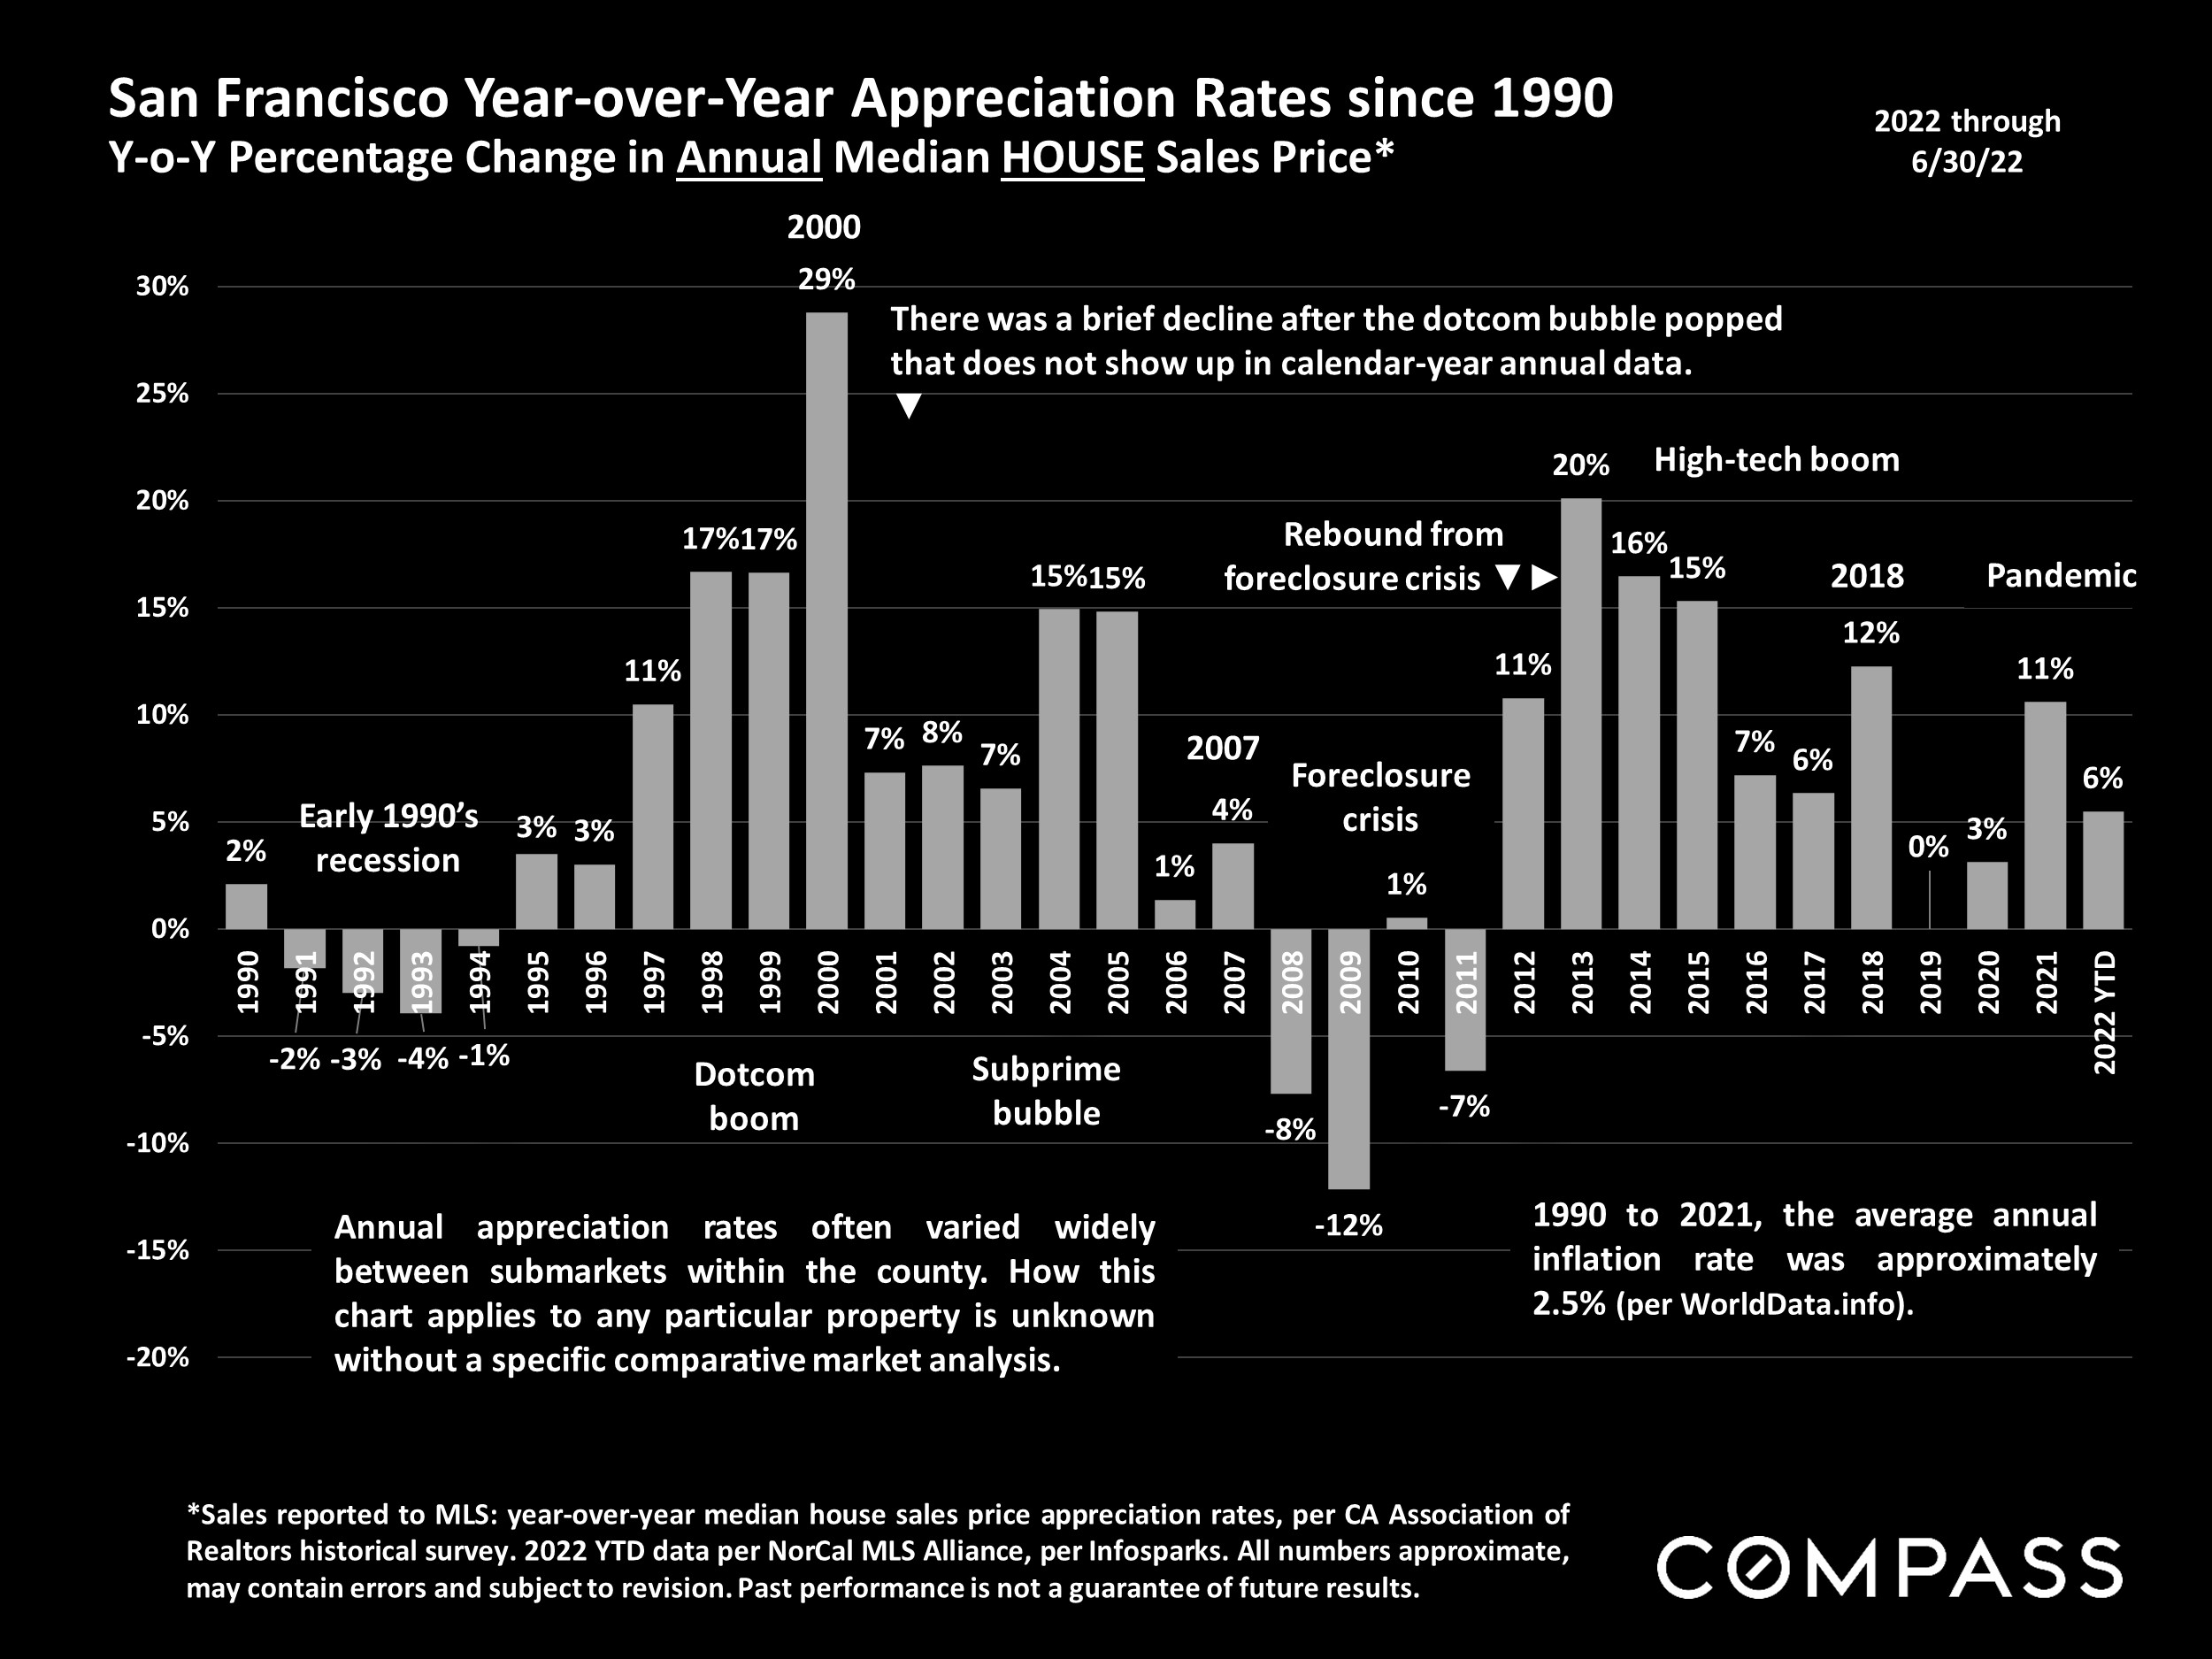
Bay Area has seen steep declines from those in 2021/early 2022 – and in June/July, SF median house prices were down year over year. Changes vary in degree by location and market segment, but the direction of the shifts is near universal. This report will review year-over-year changes in prices and supply and demand, reflecting the significant adjustments from the heated (often overheated) conditions recently the norm, but also look at longer-term trends to provide greater historical context.
As of early August, the average weekly mortgage rate for a 30-year fixed rate loan fell below 5% for the first time since April, and stock markets have seen large rebounds since early July – but these and other indicators have been subject to sudden and often dramatic volatility, and their future directions can’t be taken for granted.
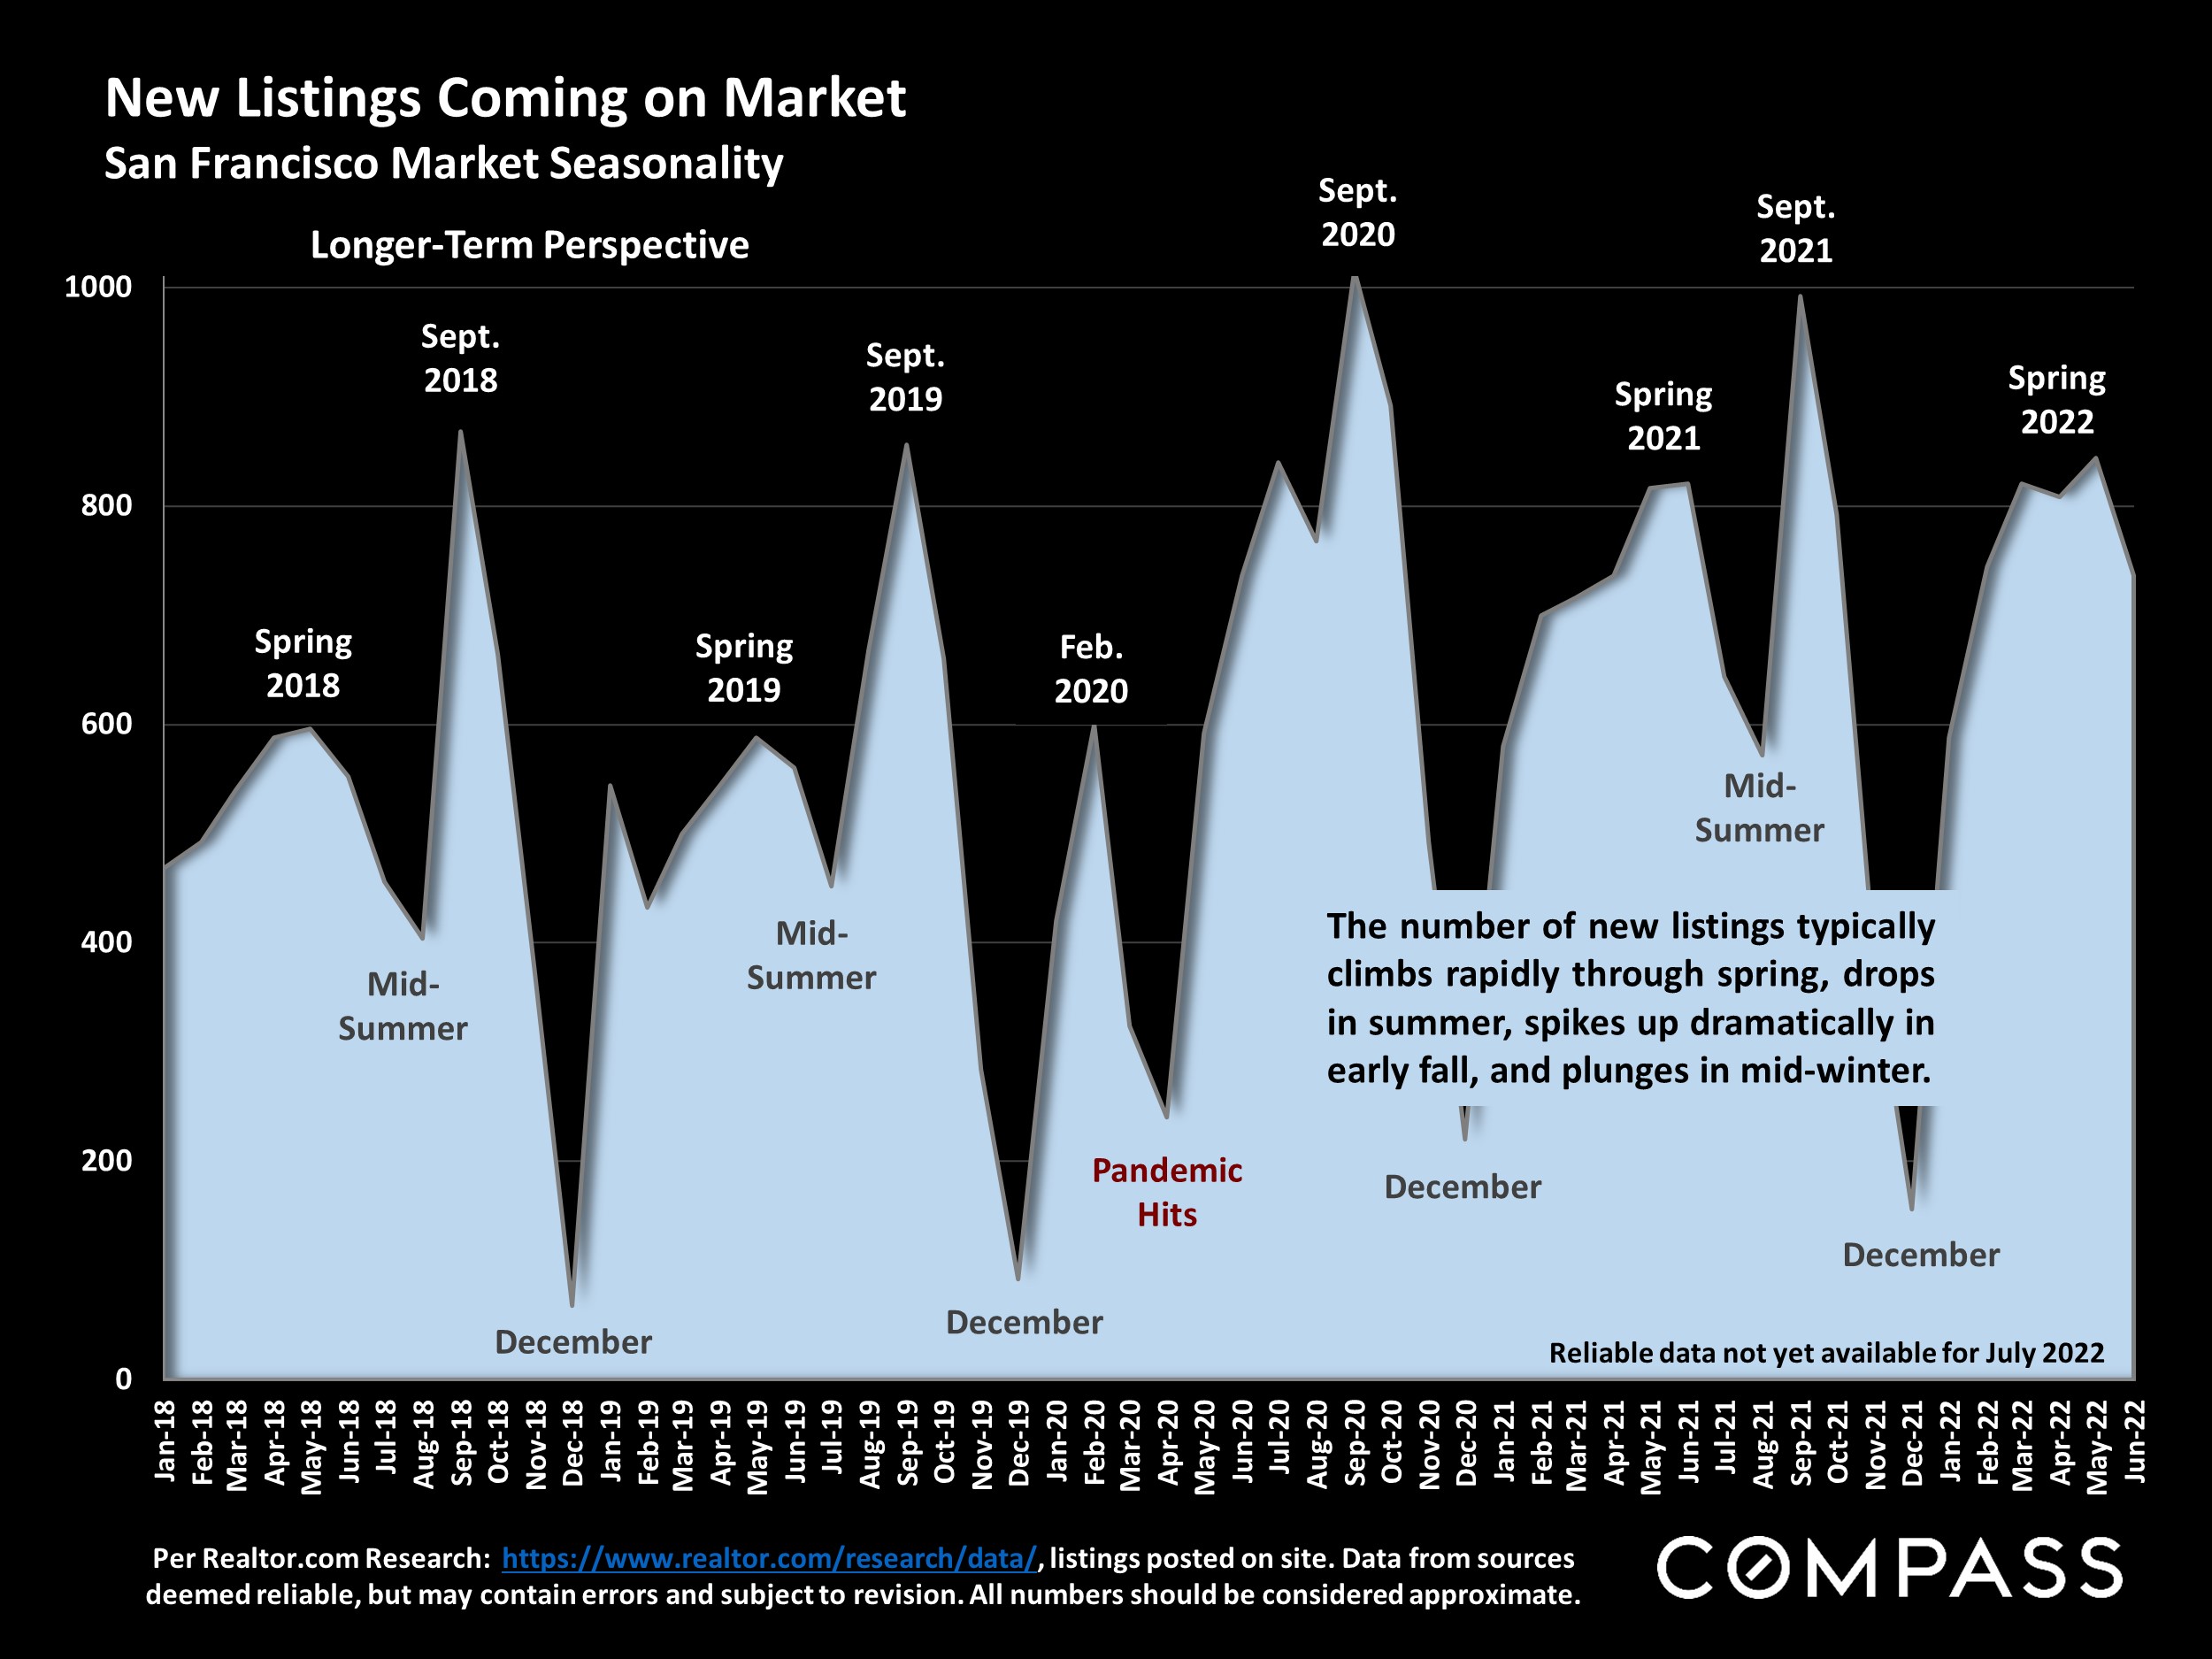
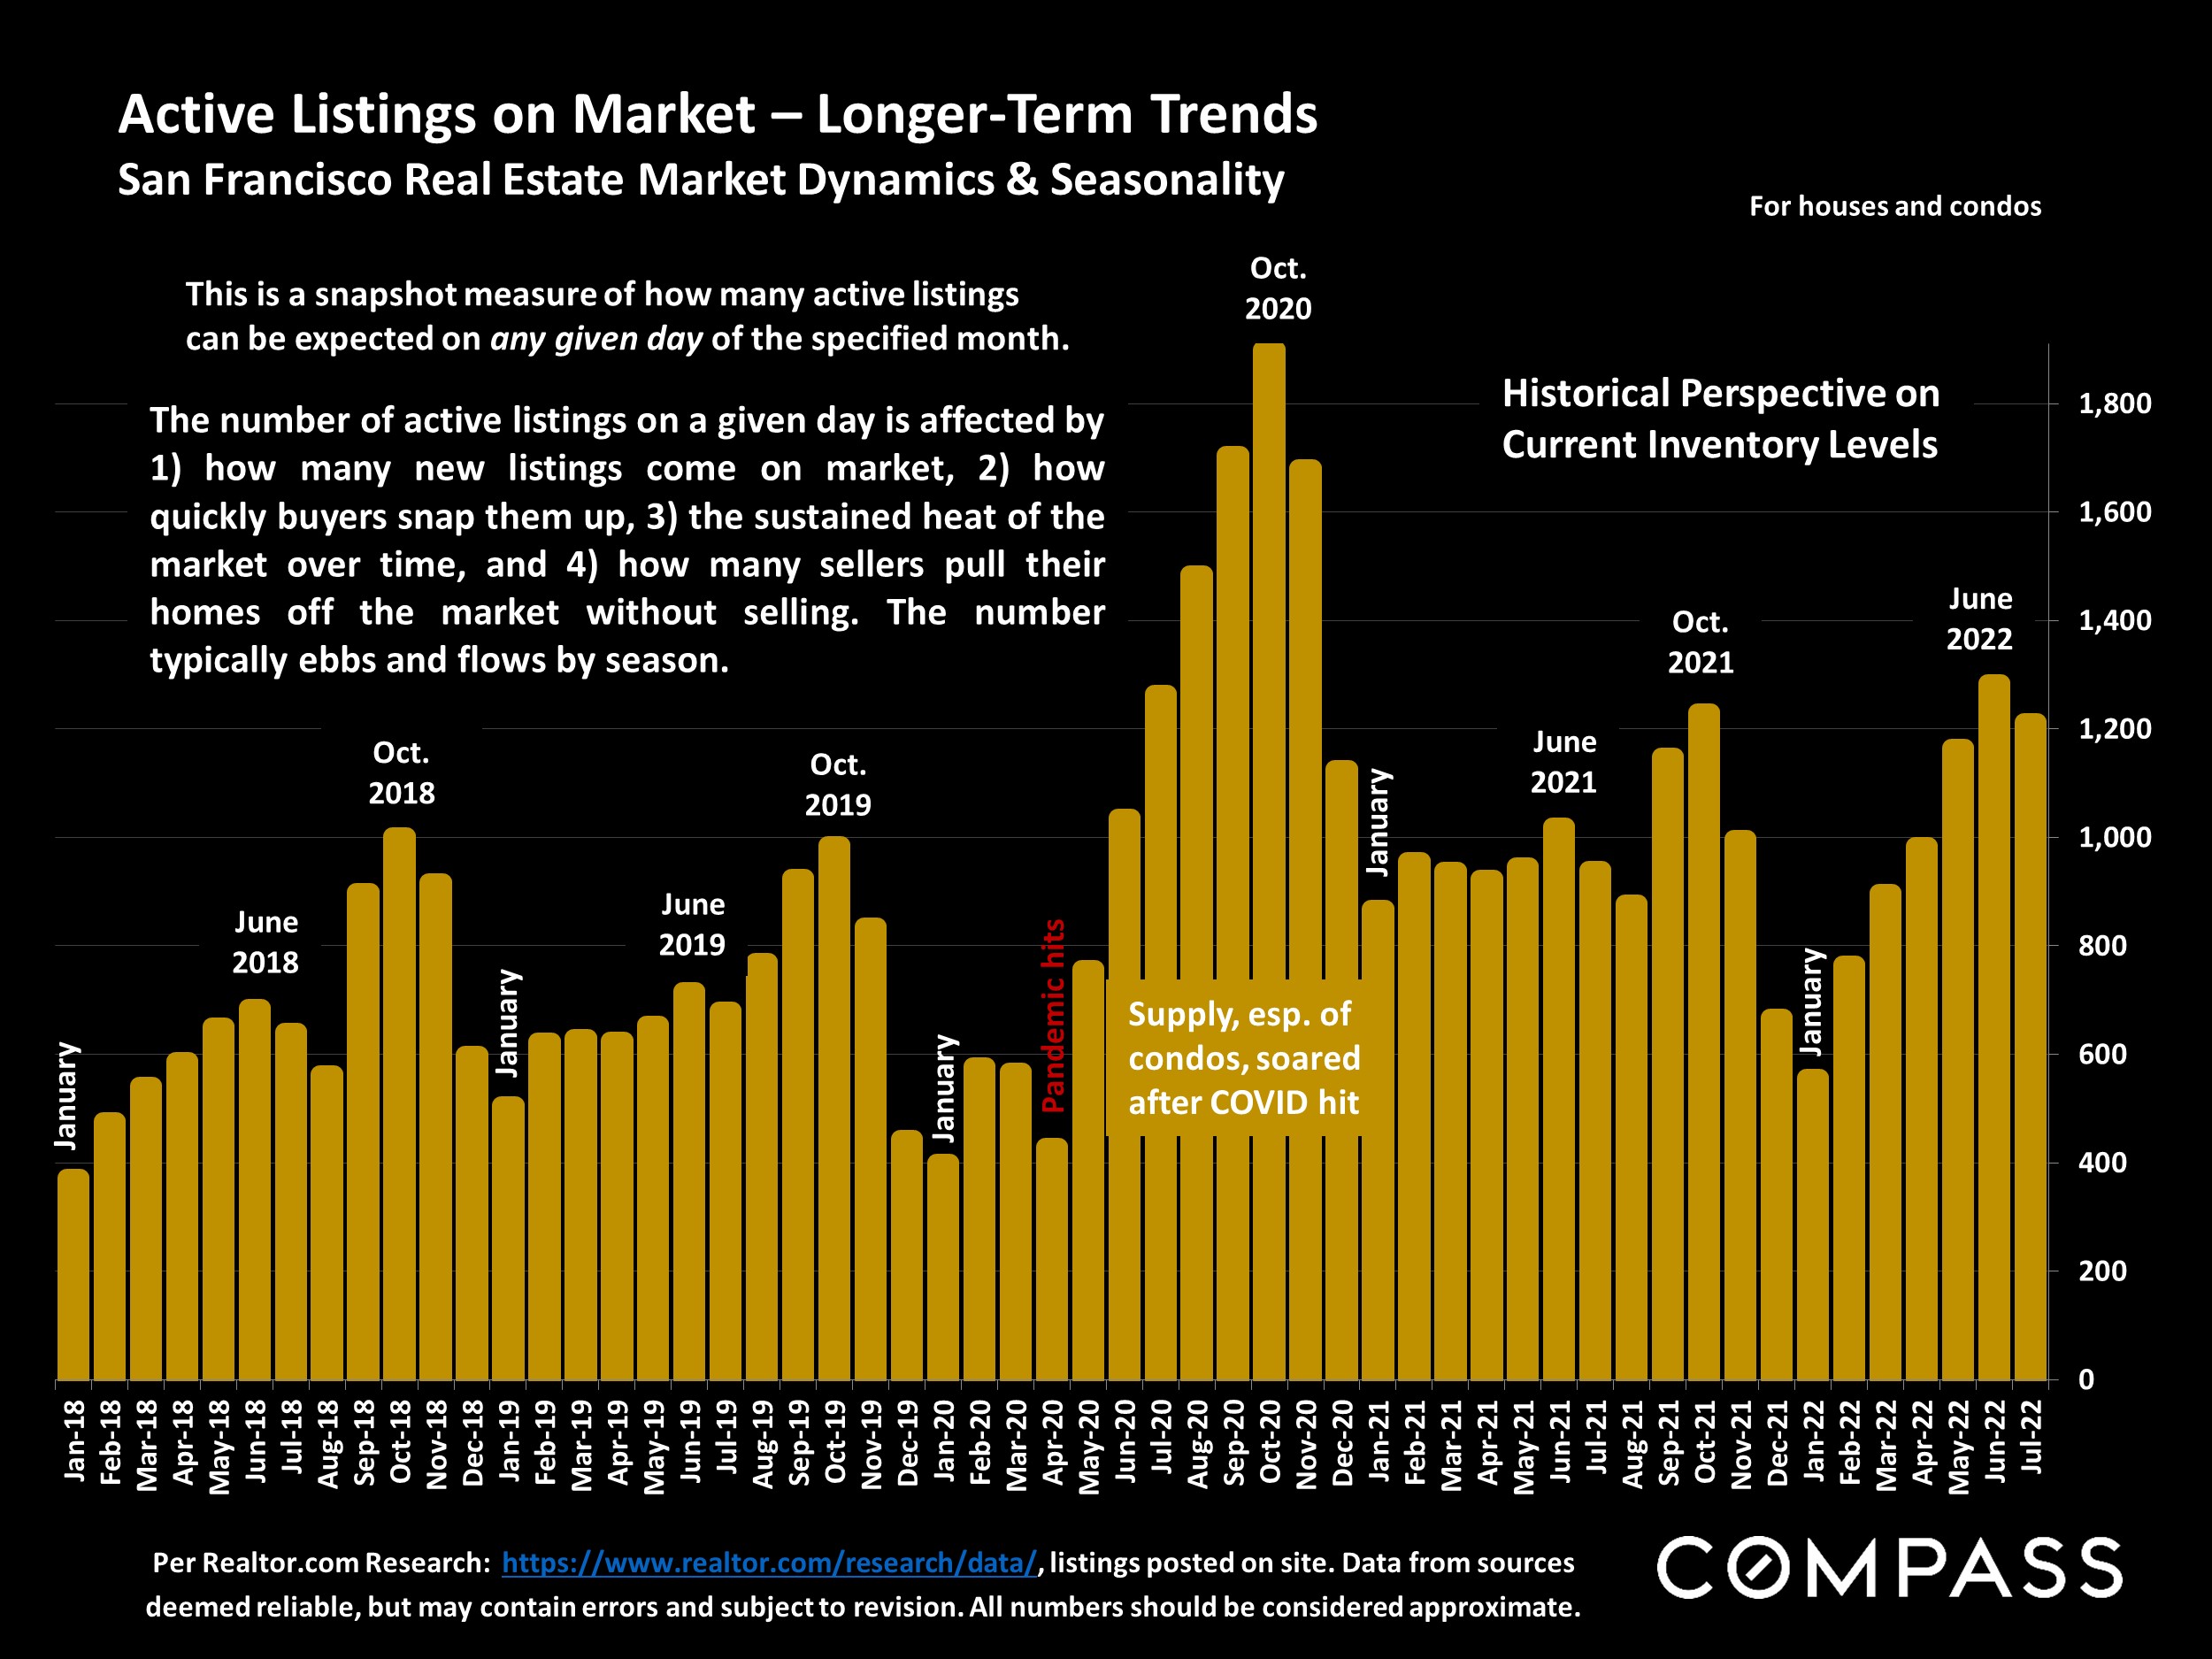
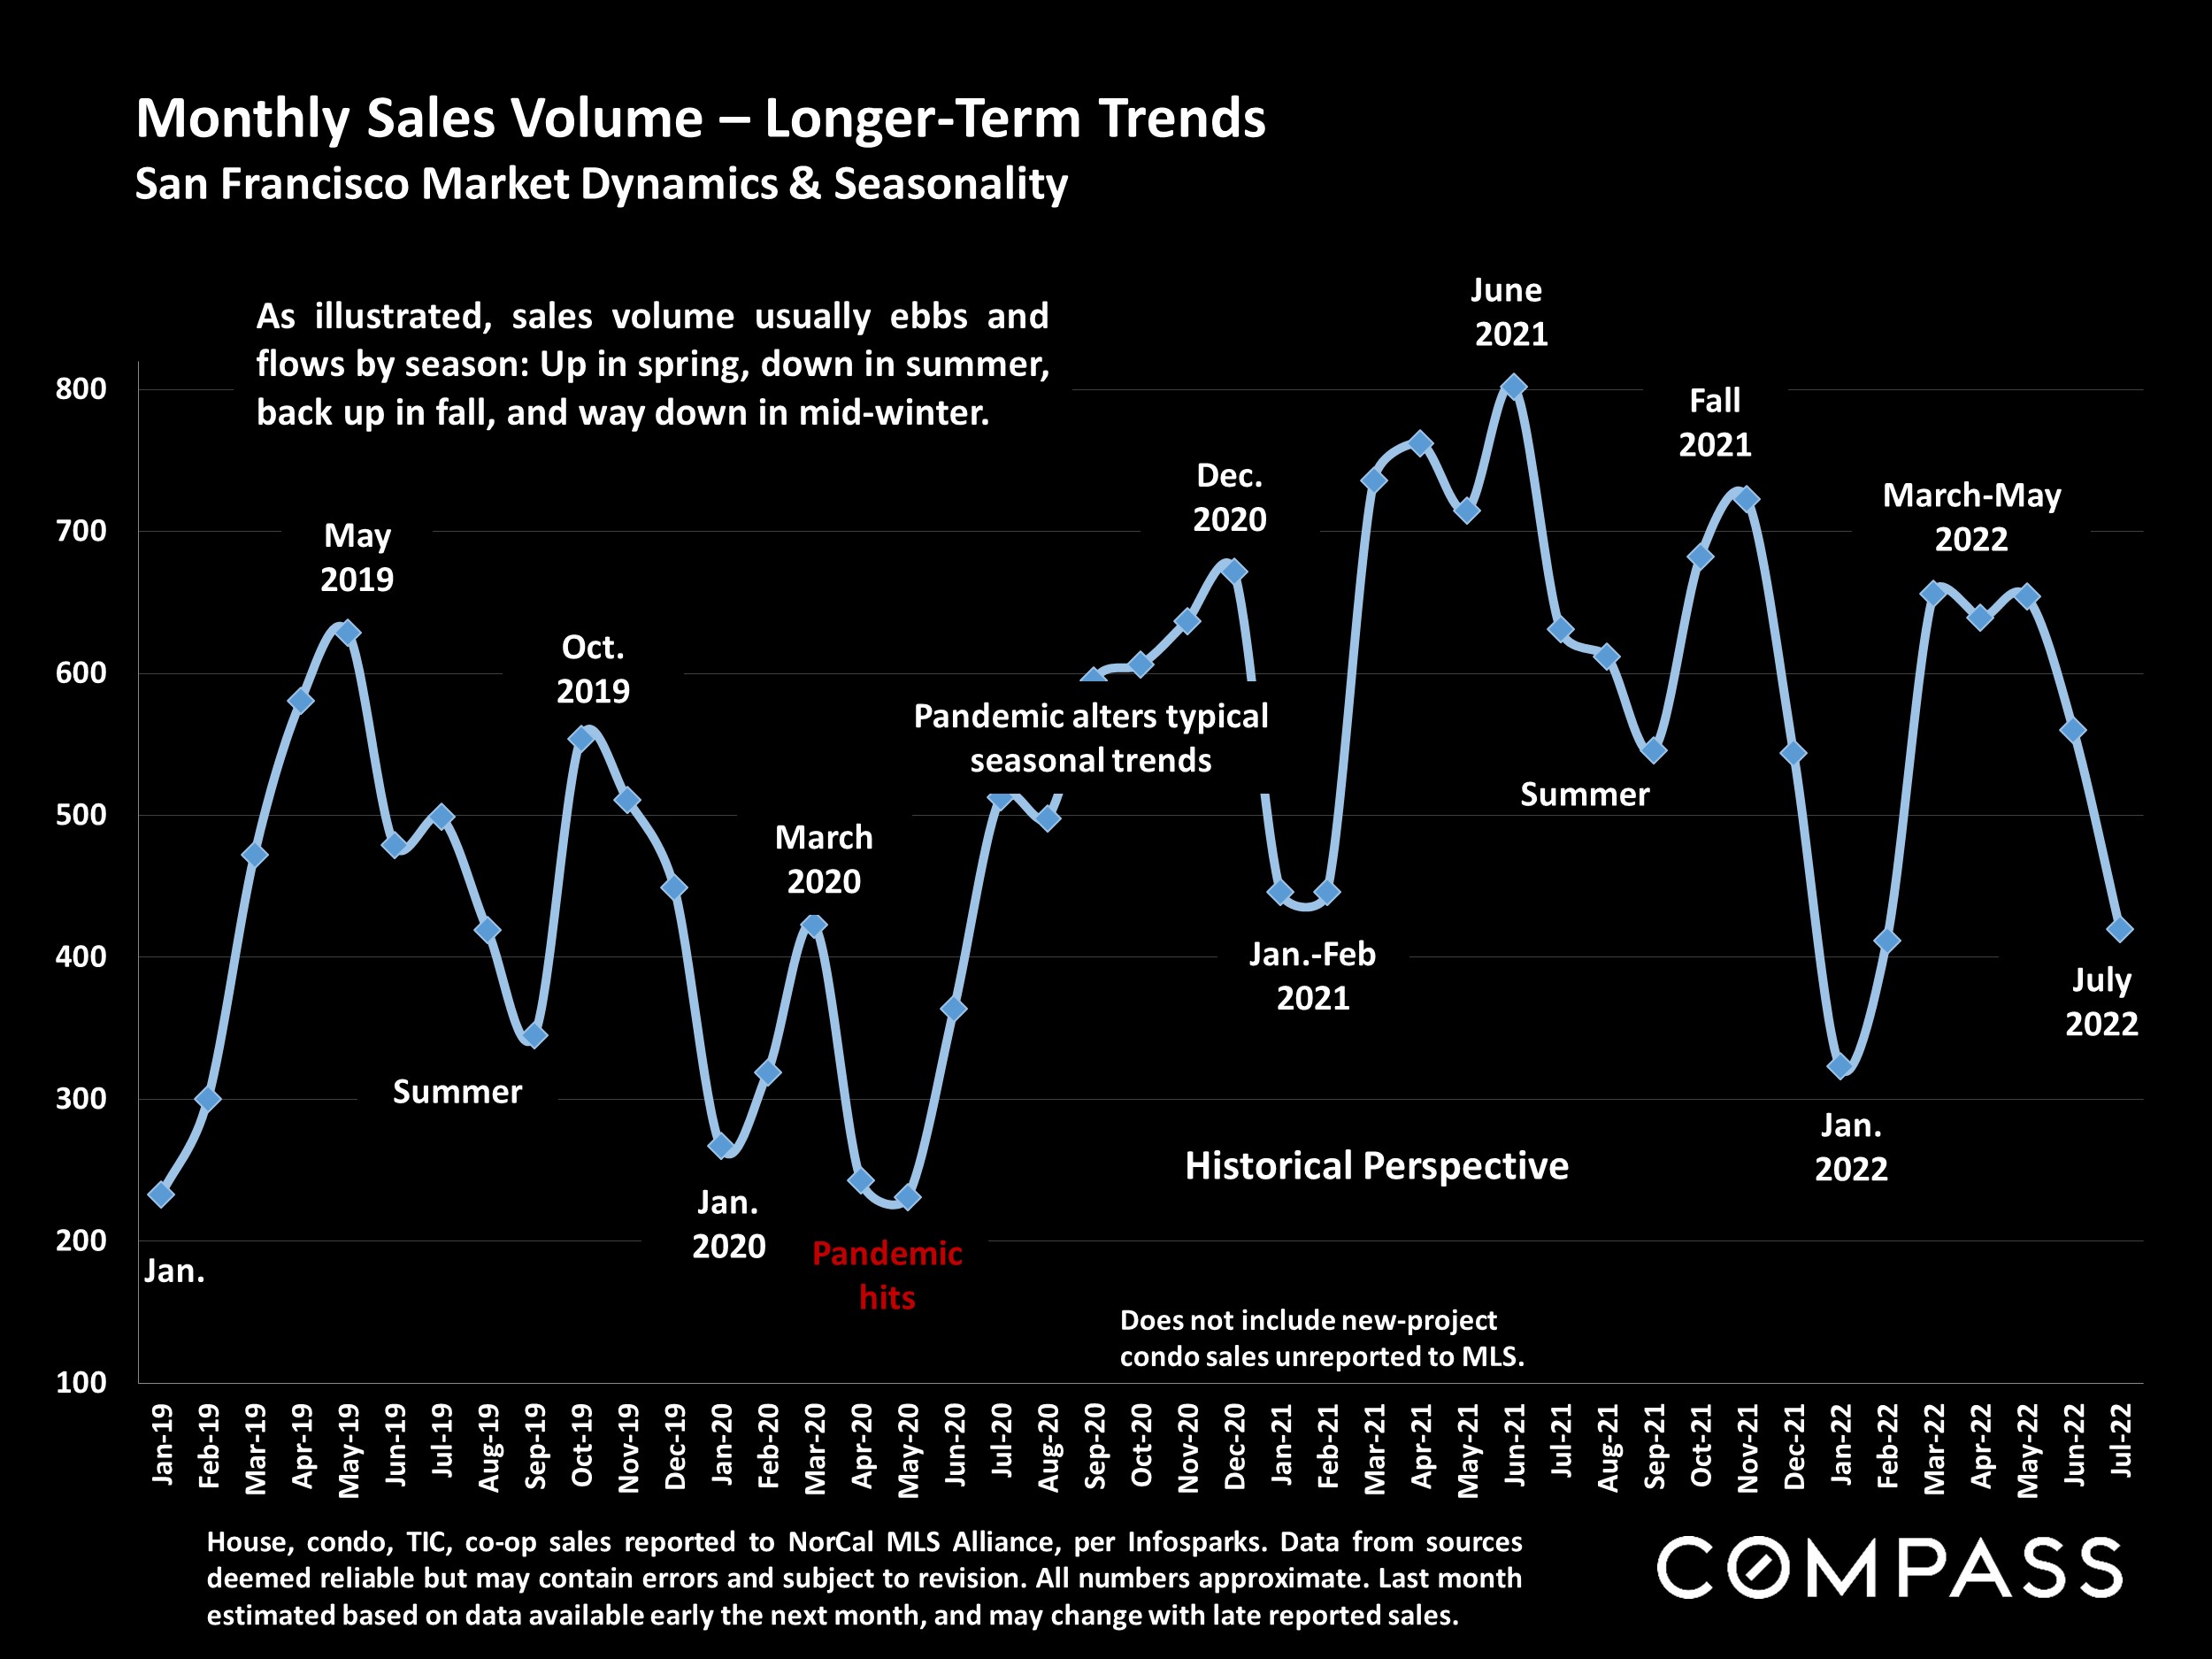
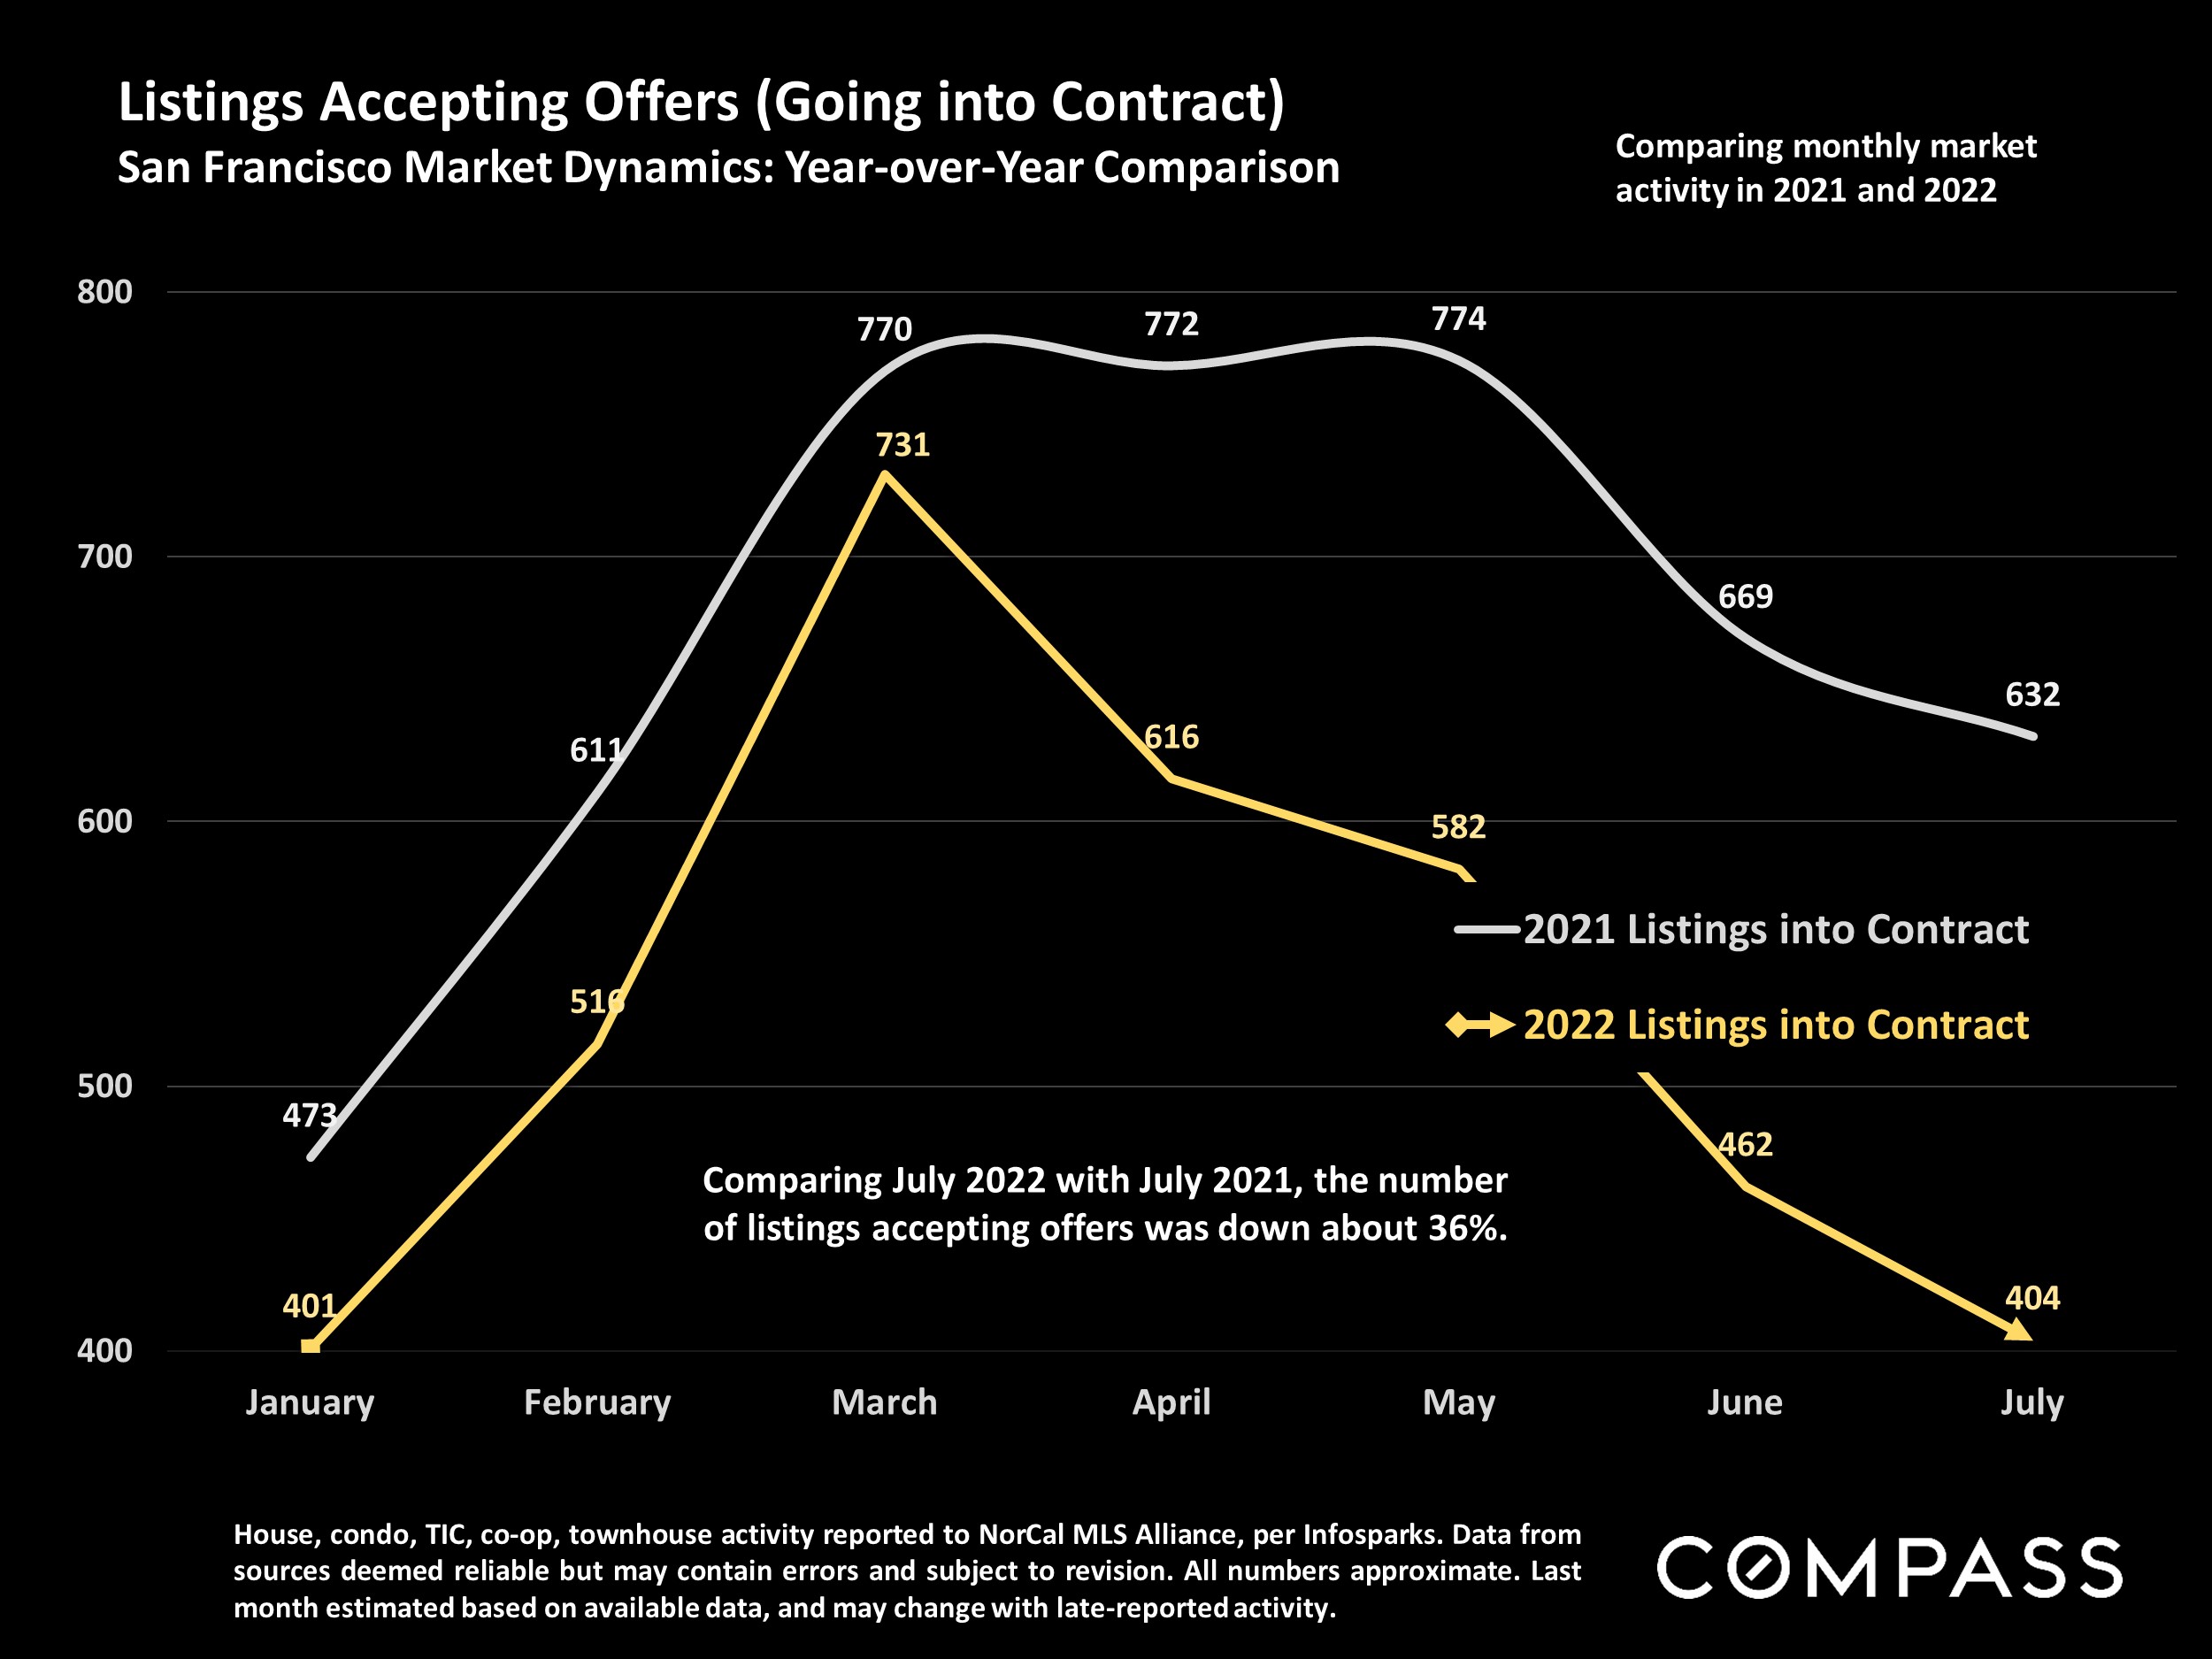
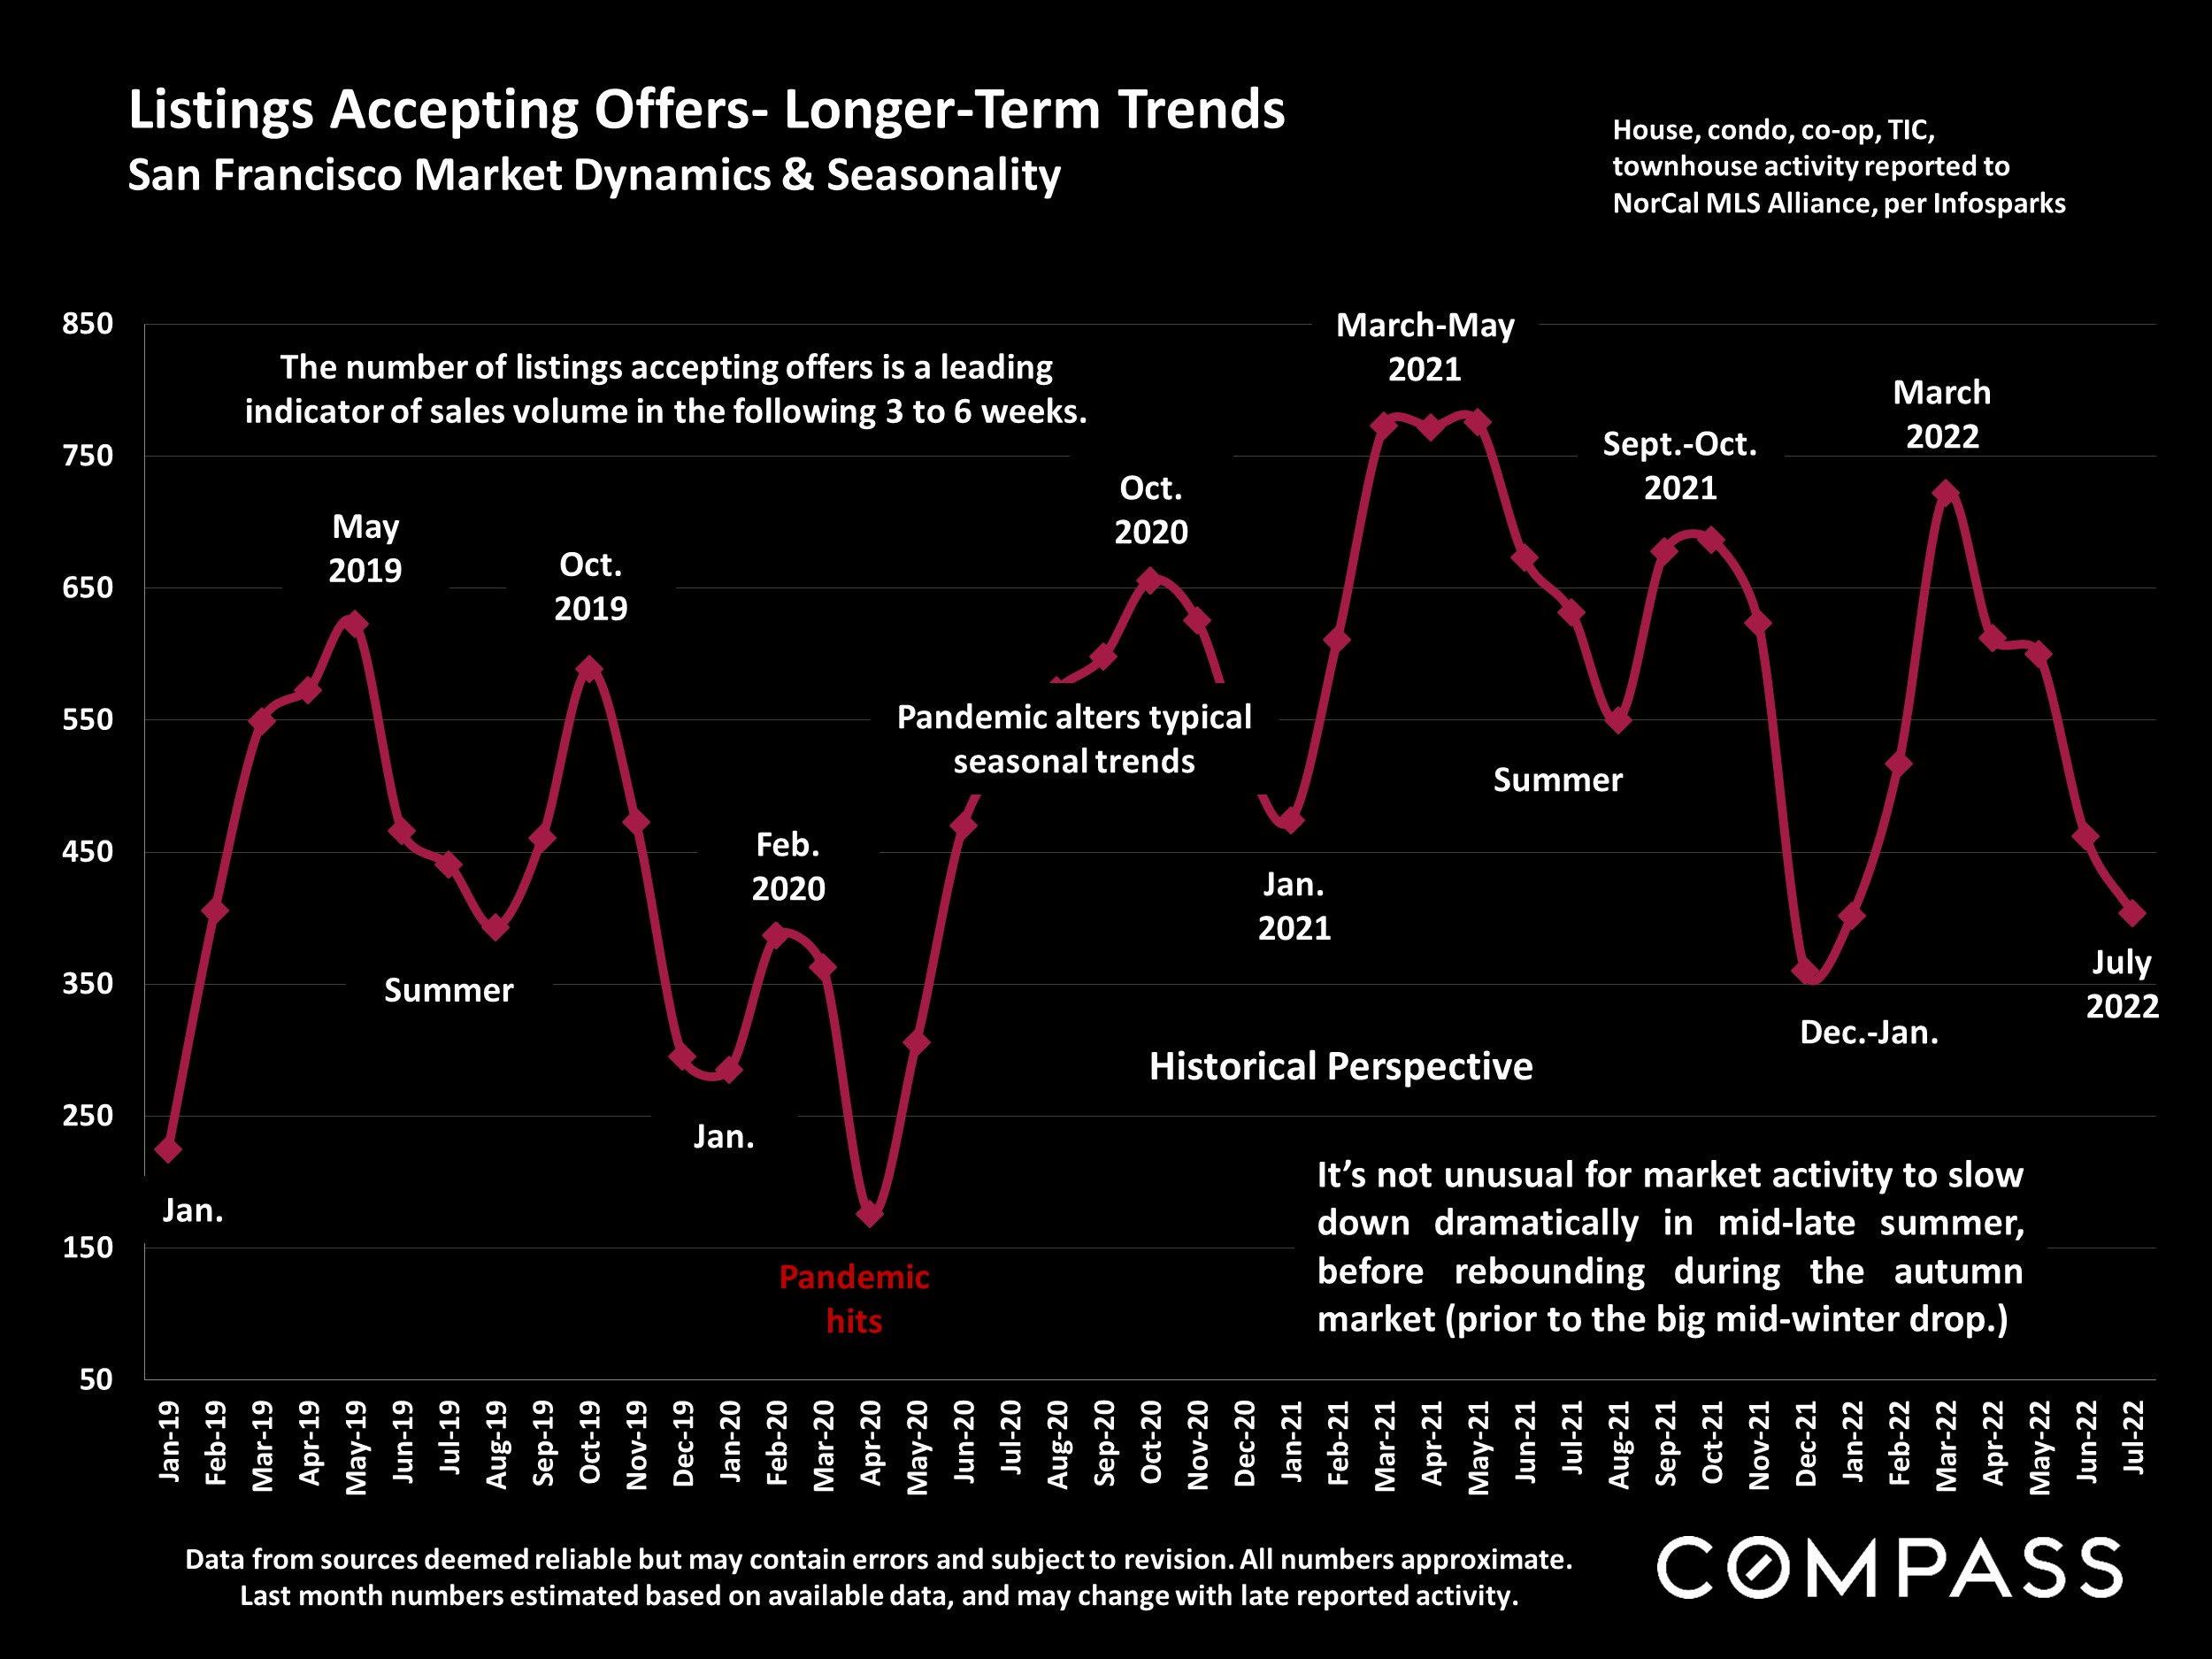
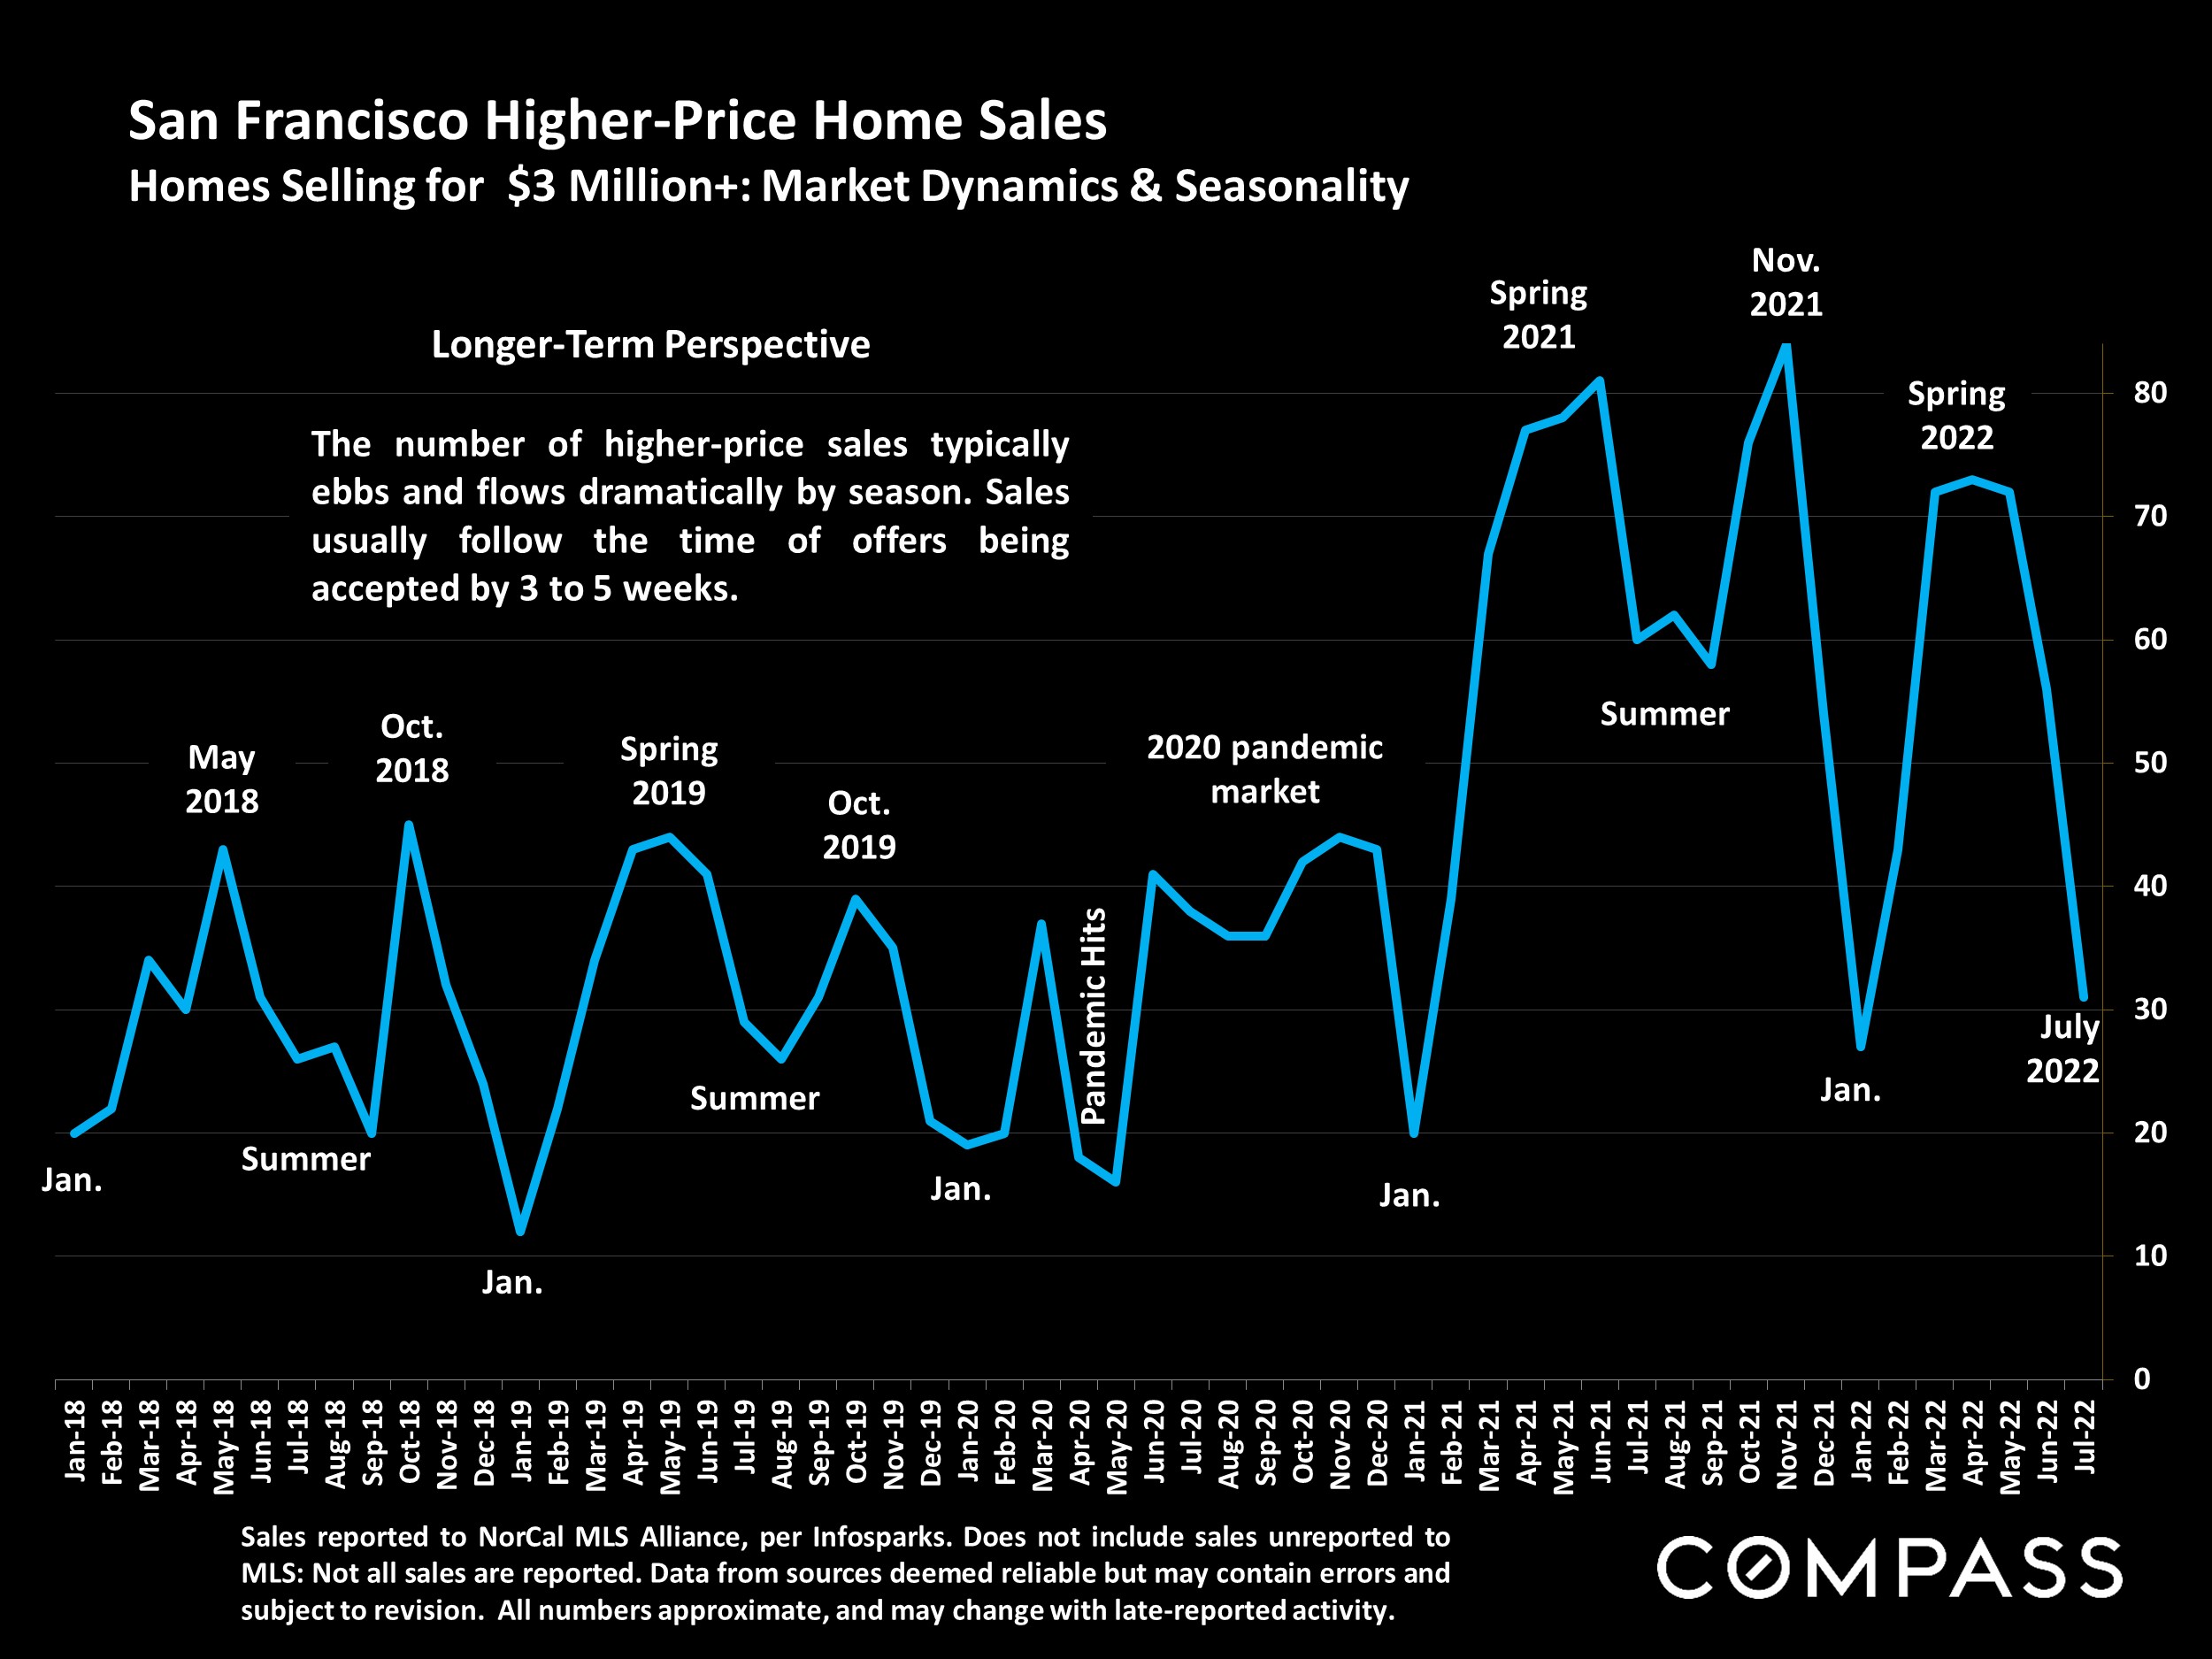
According to some agents, buyer interest has begun to rekindle with the decline in competition, increase in inventory, and economic changes mentioned above, but if this is part of a broader recovery in demand, it has not yet shown up in the statistics – which are lagging indicators of what’s occurring on the ground right now. Monthly data can be volatile, fluctuating according to a wide variety of factors, including market seasonality. Longer-term trends are more meaningful than short-term fluctuations.
Mid-late summer is usually a much slower period compared to the spring selling season. Autumn typically sees a very substantial spike in new listings and sales prior to the big mid-winter slowdown.


 If you have any questions or want to talk more about local market trends, please don't hesitate to reach out. I'd be happy to grab a coffee or chat via phone.
Thank you,
Shannon
Want to learn more about Bay Area market trends?
Let’s connect! With relationships and networks across the city, there are a variety of ways I can help you make informed real estate decisions. Call, email, or text – I’m here to help.
Contact