August 20, 2026
SF: August 2026 Market Stats
By Compass
San Francisco Recap
Single-Family Homes
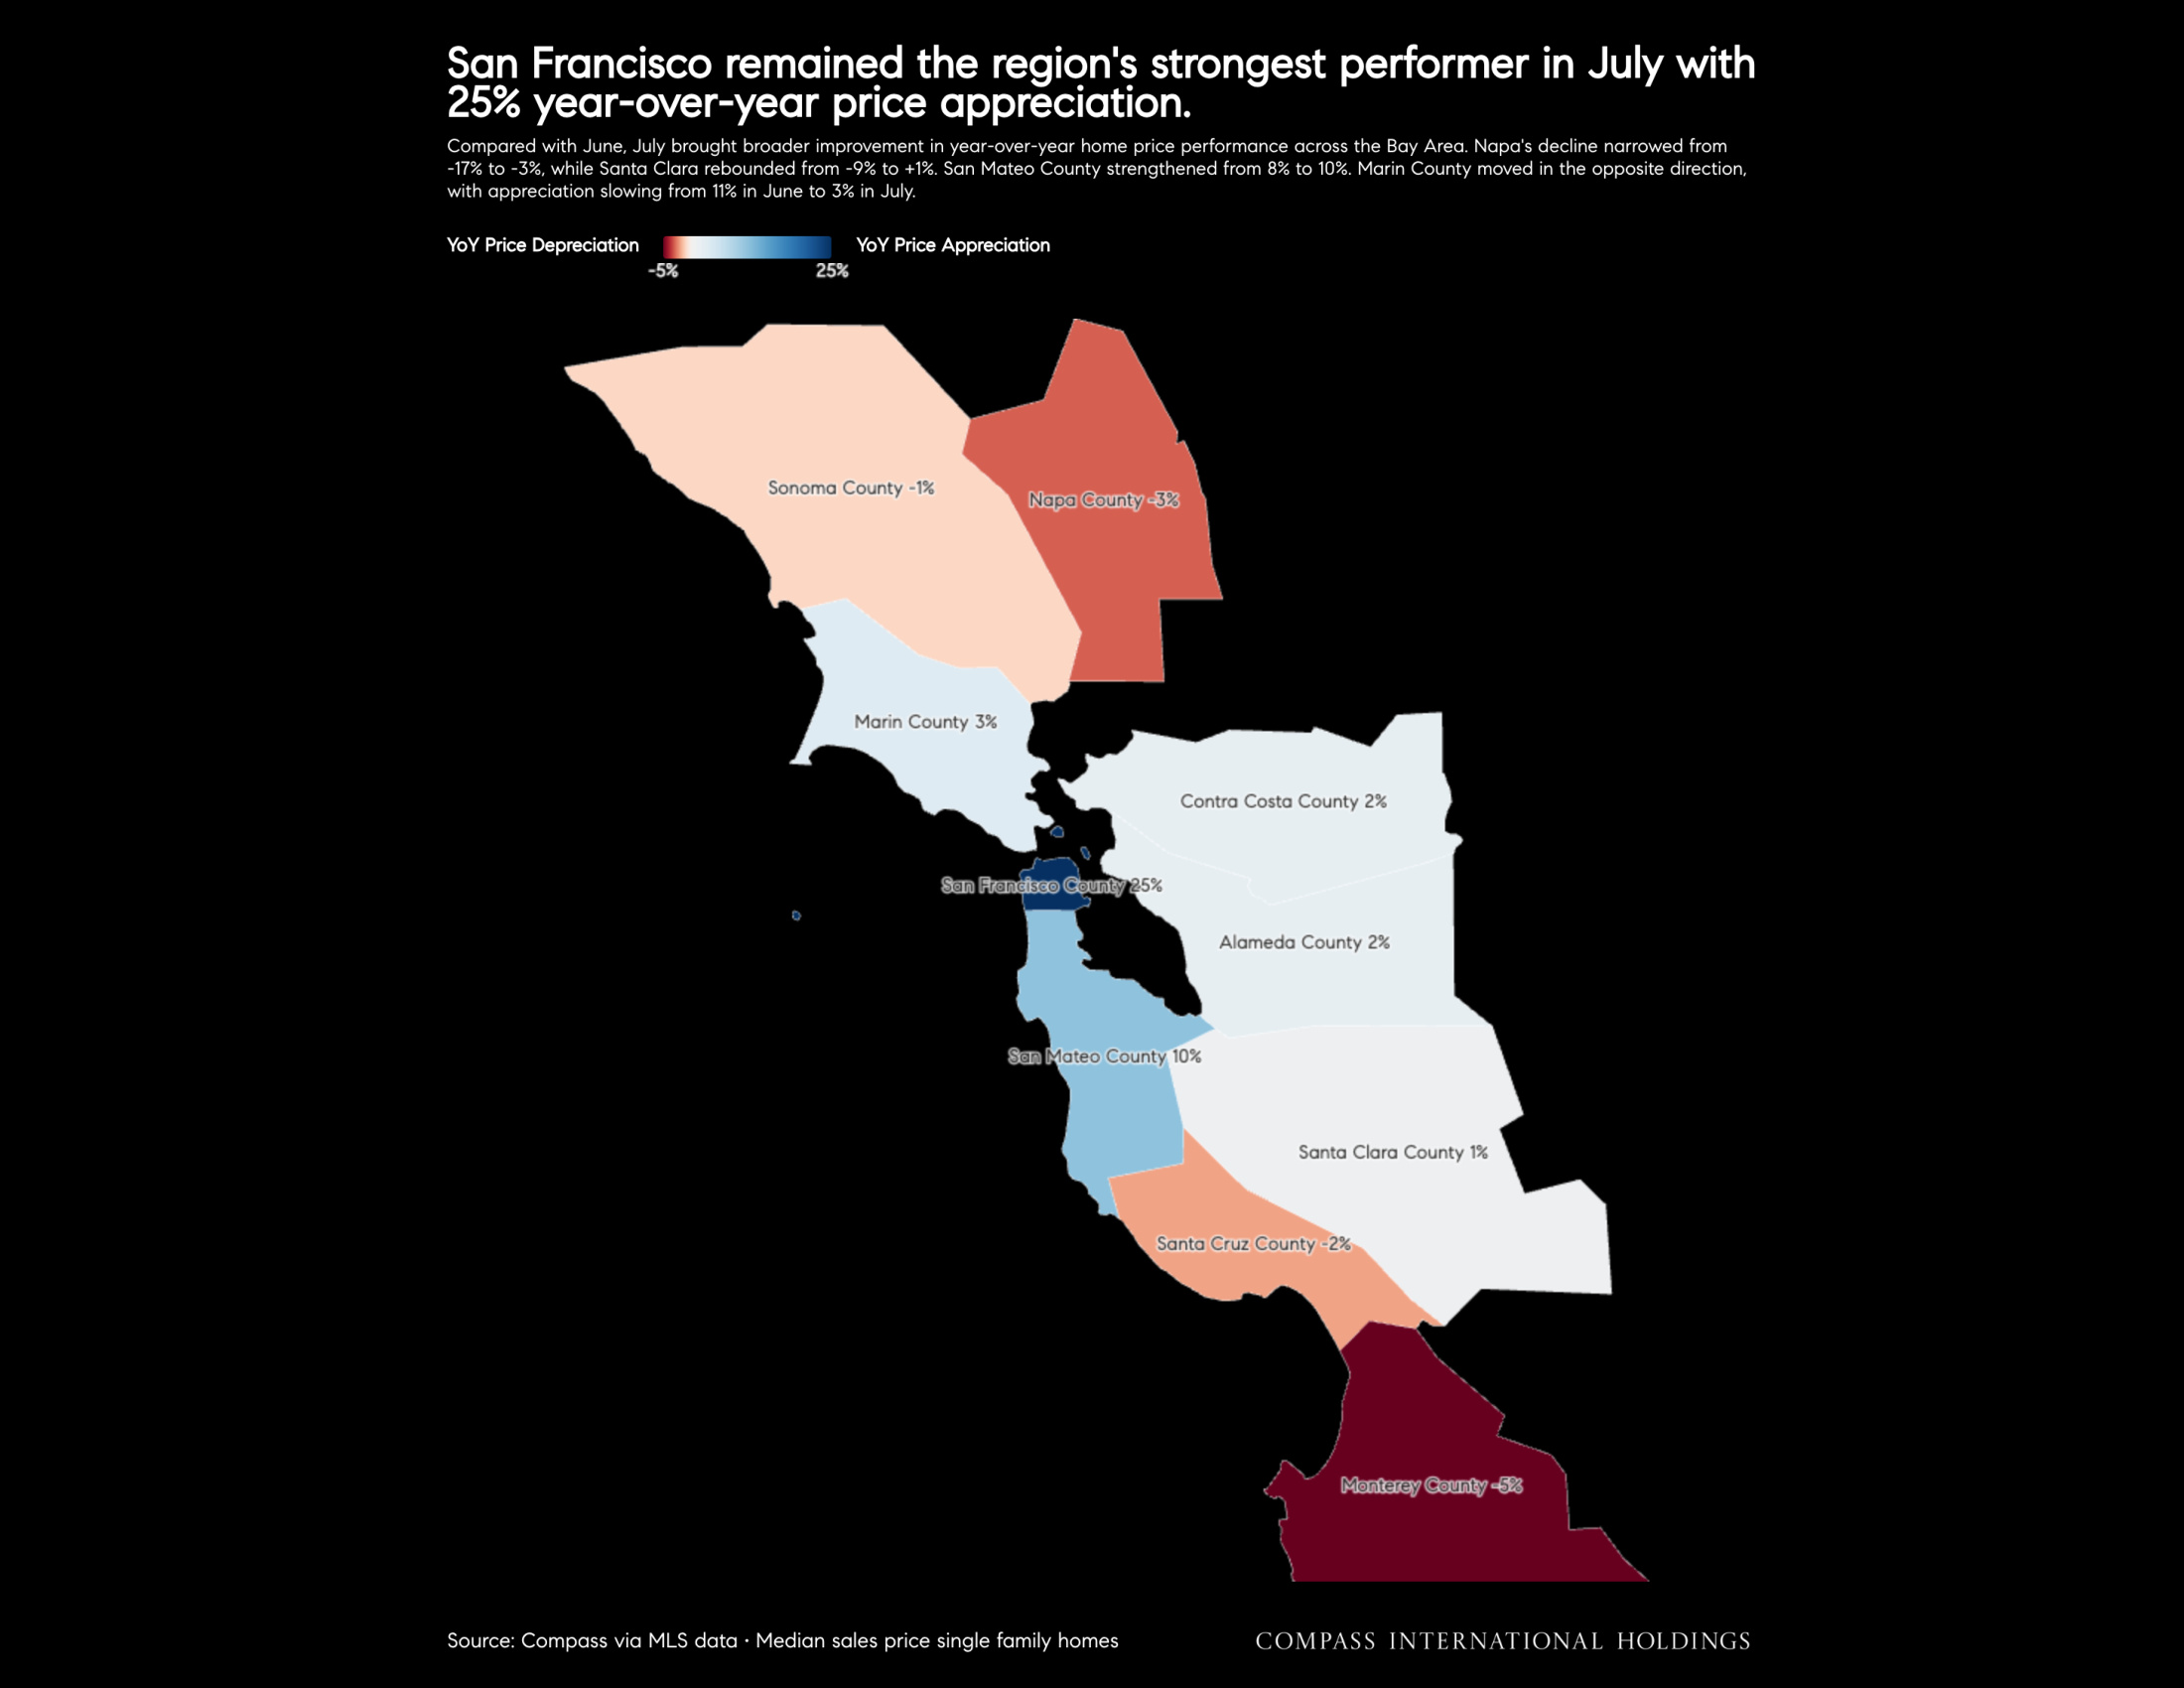
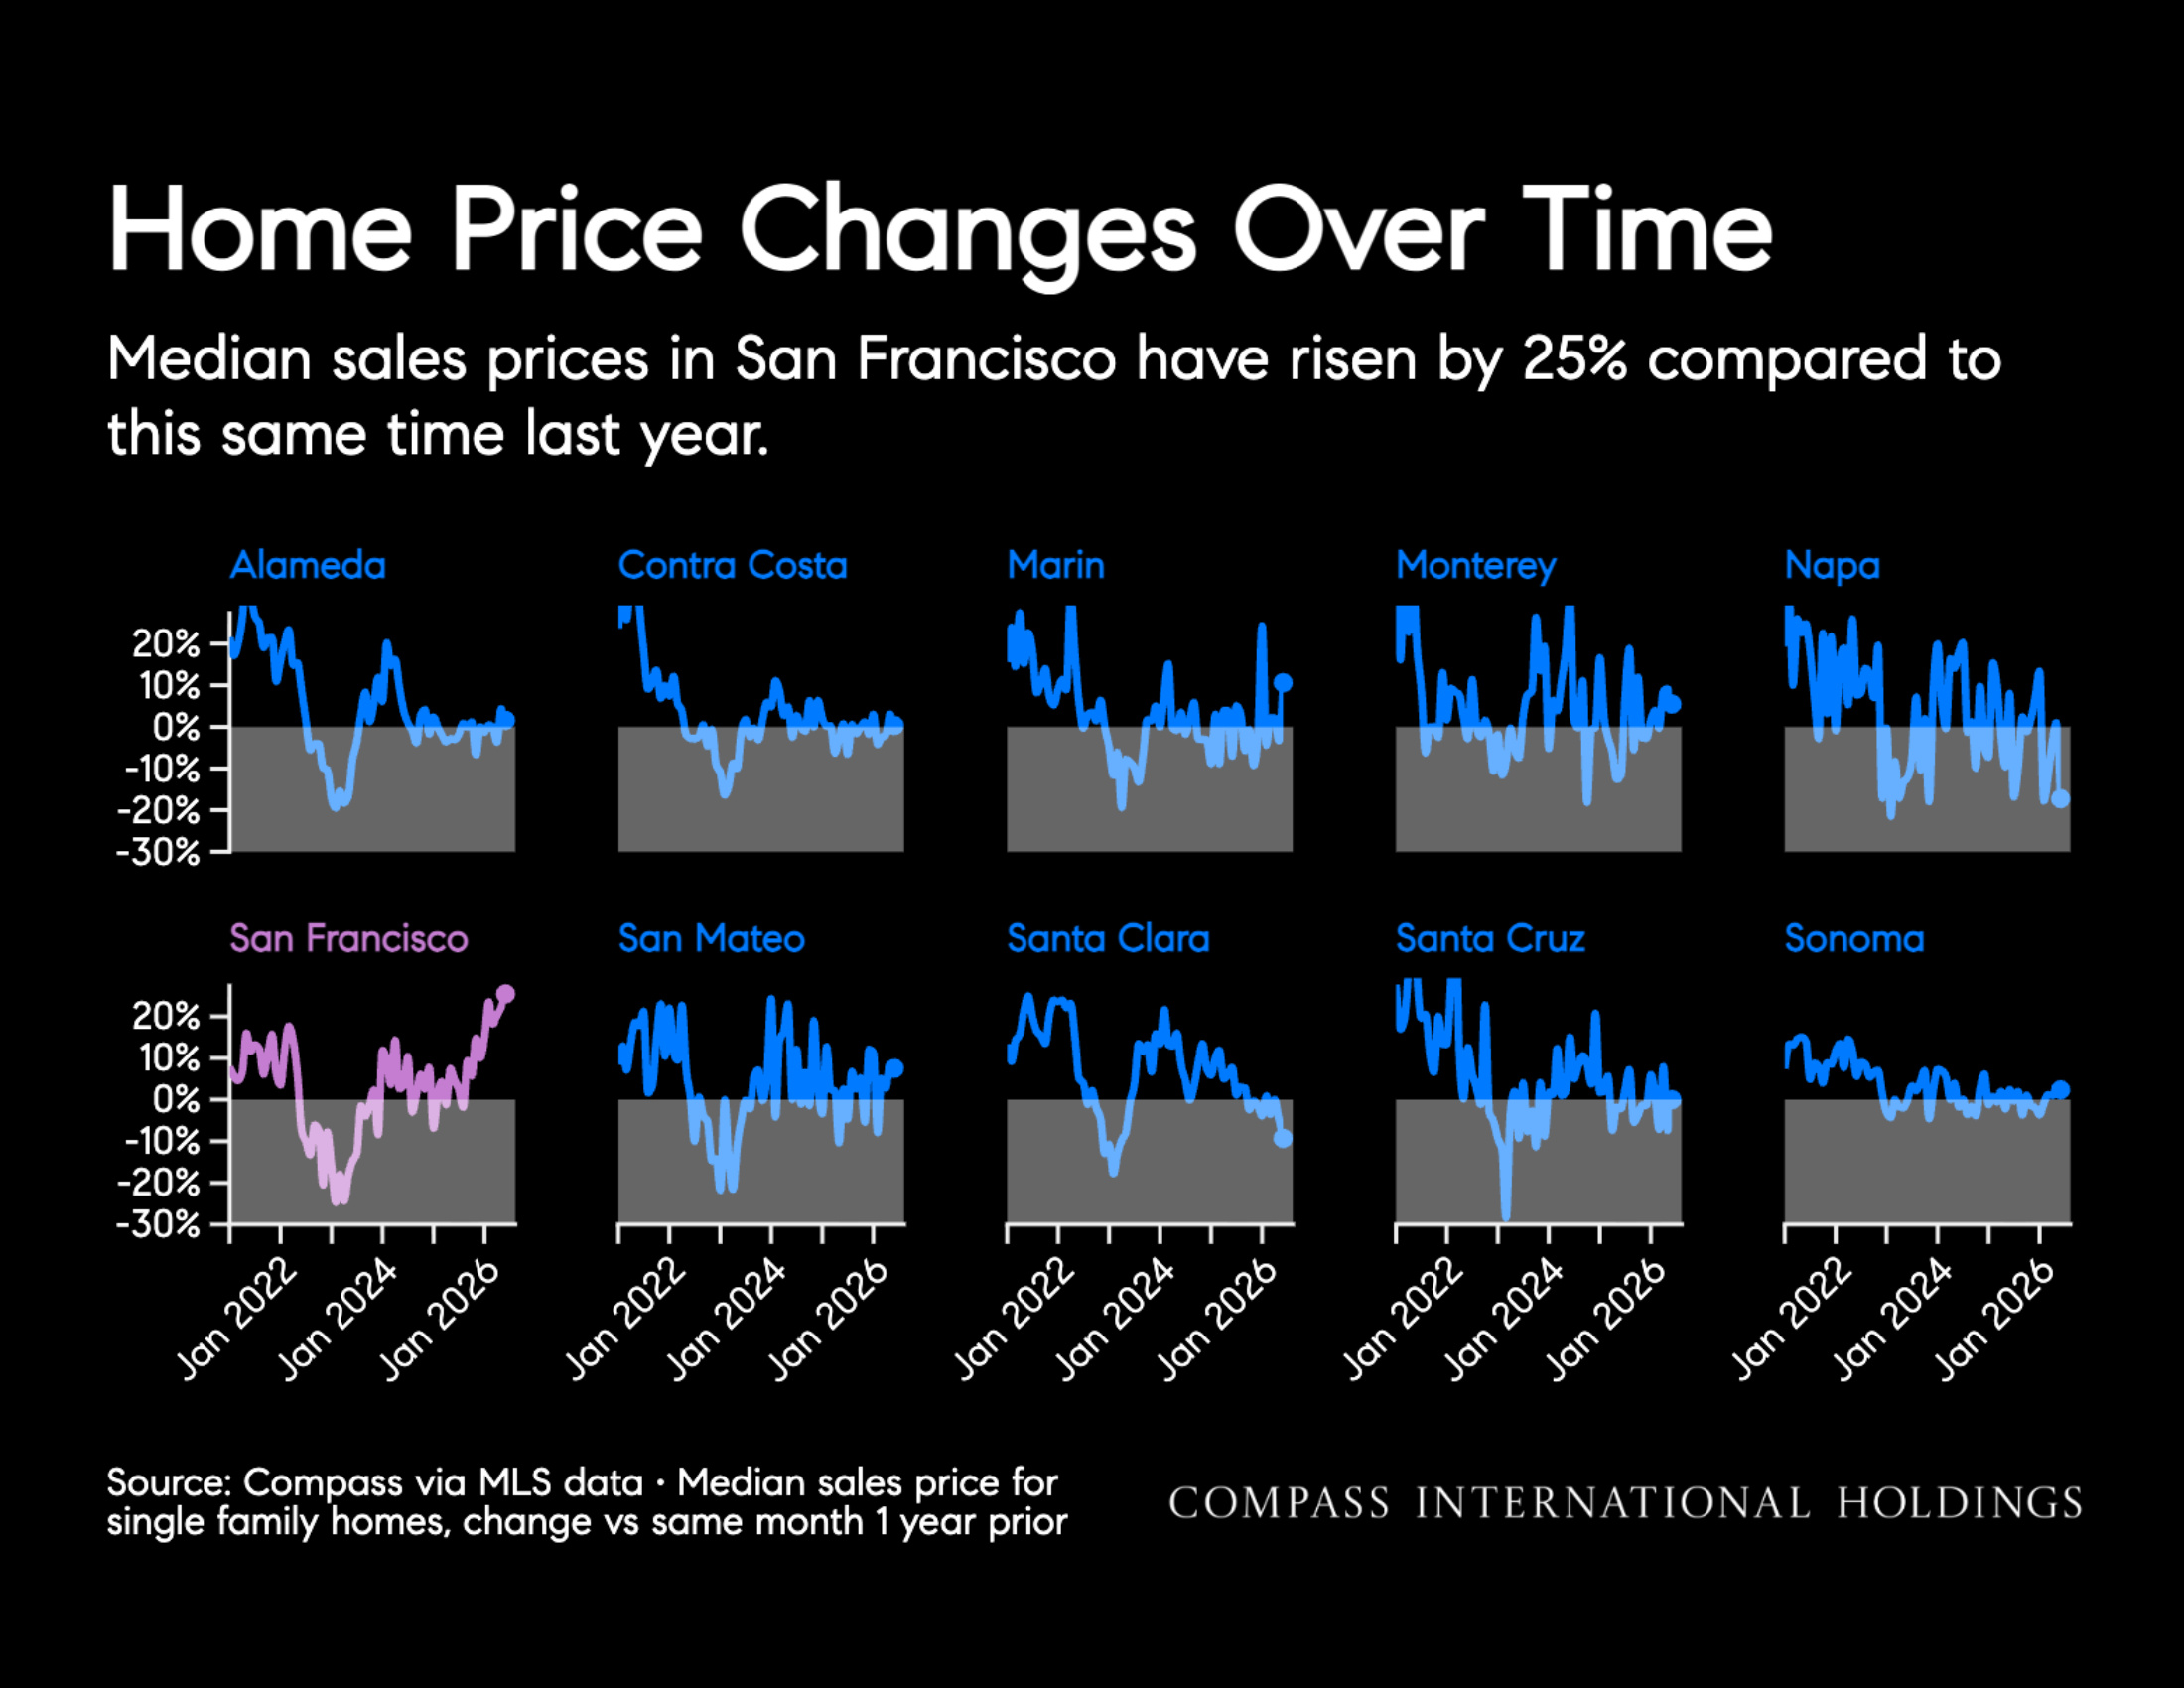
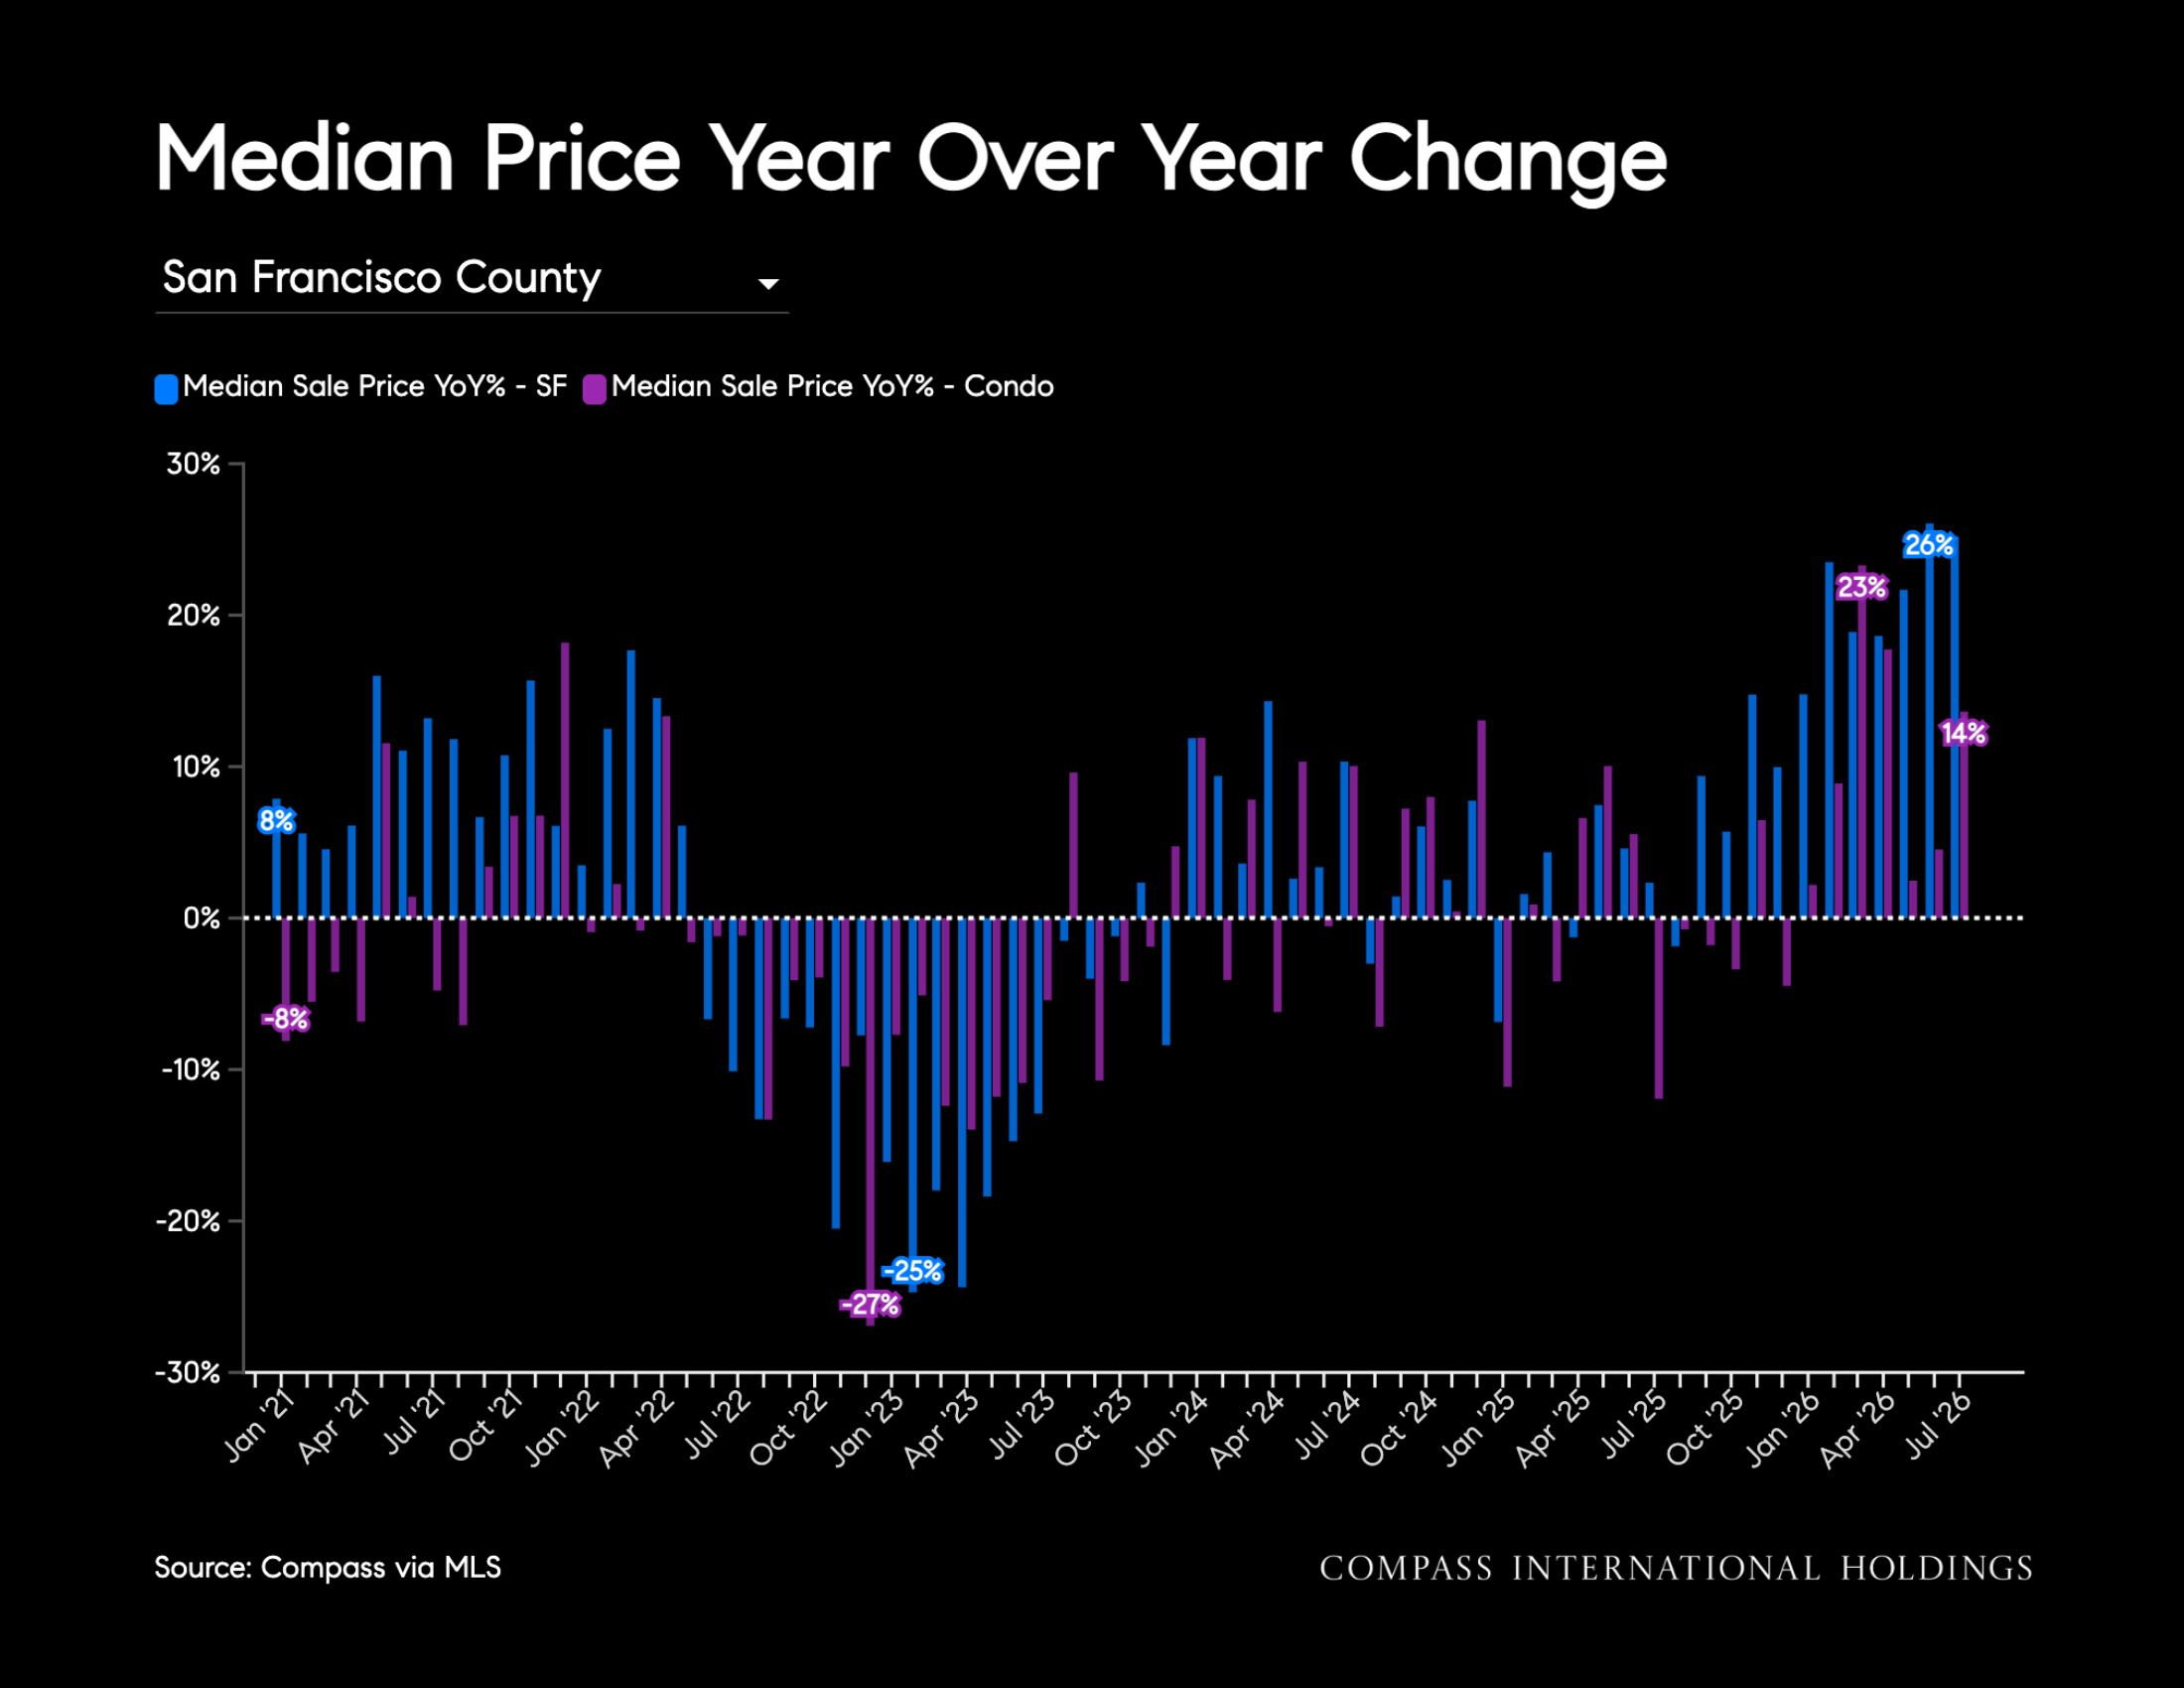
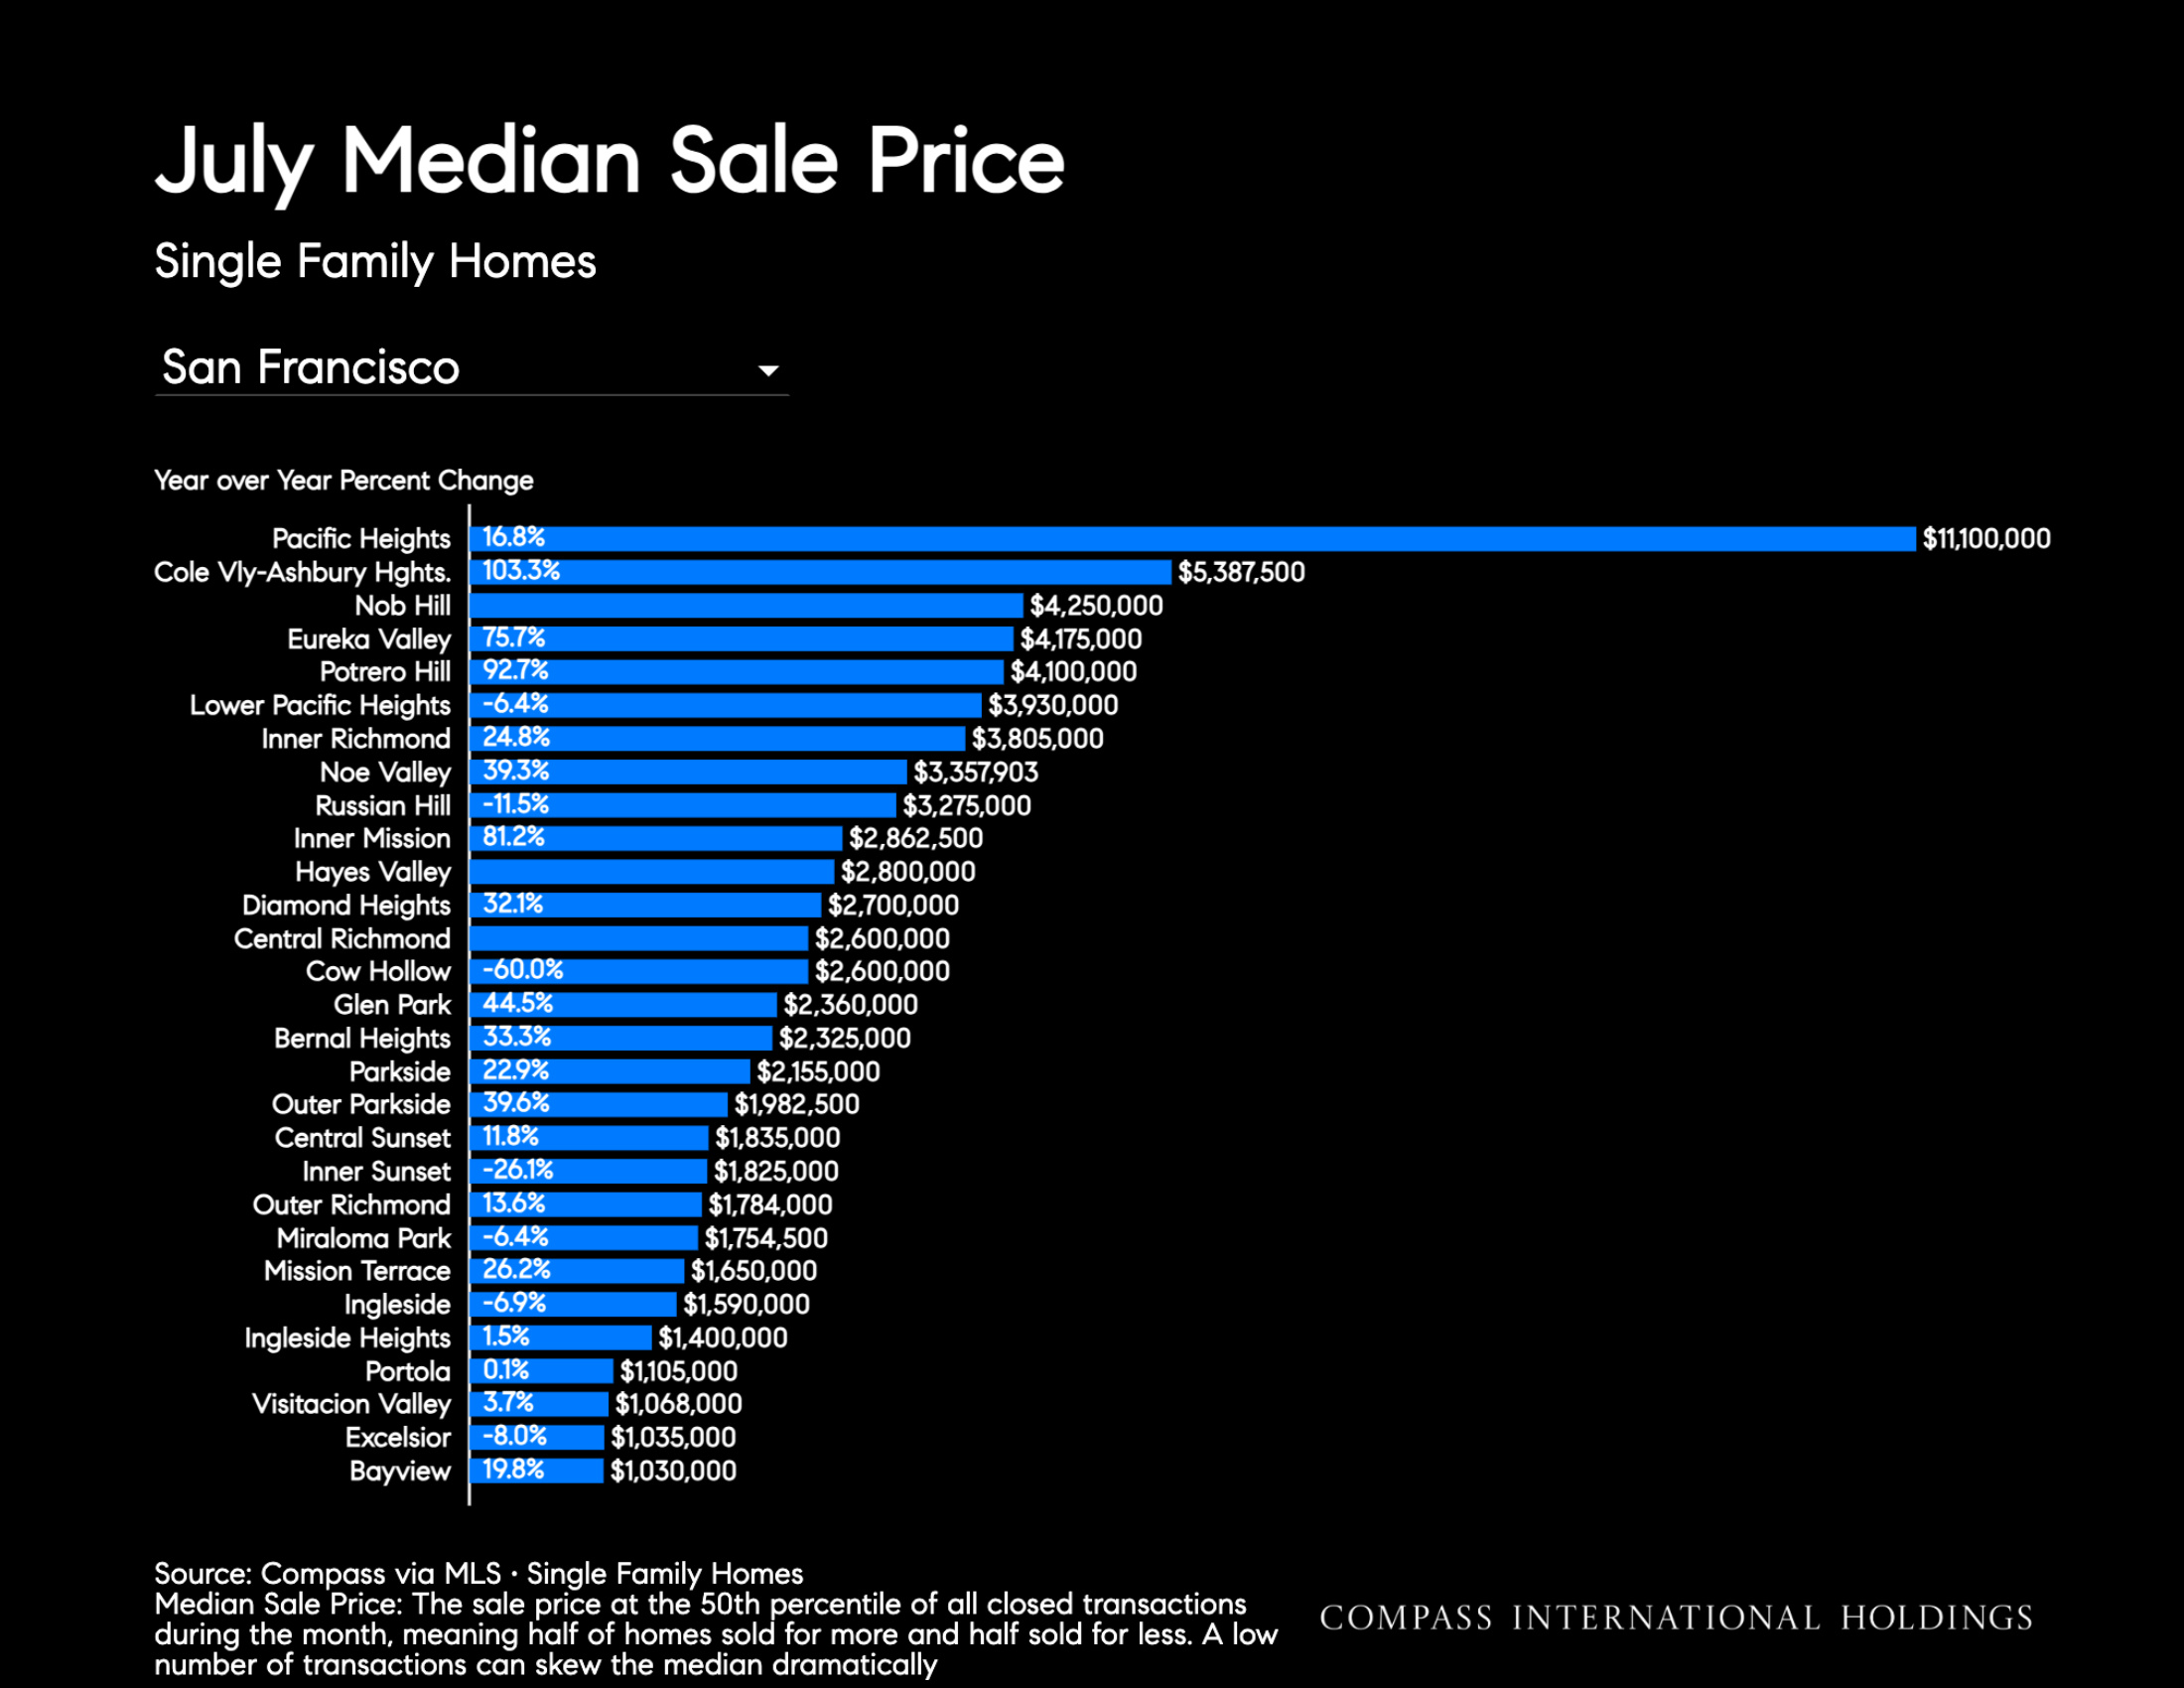
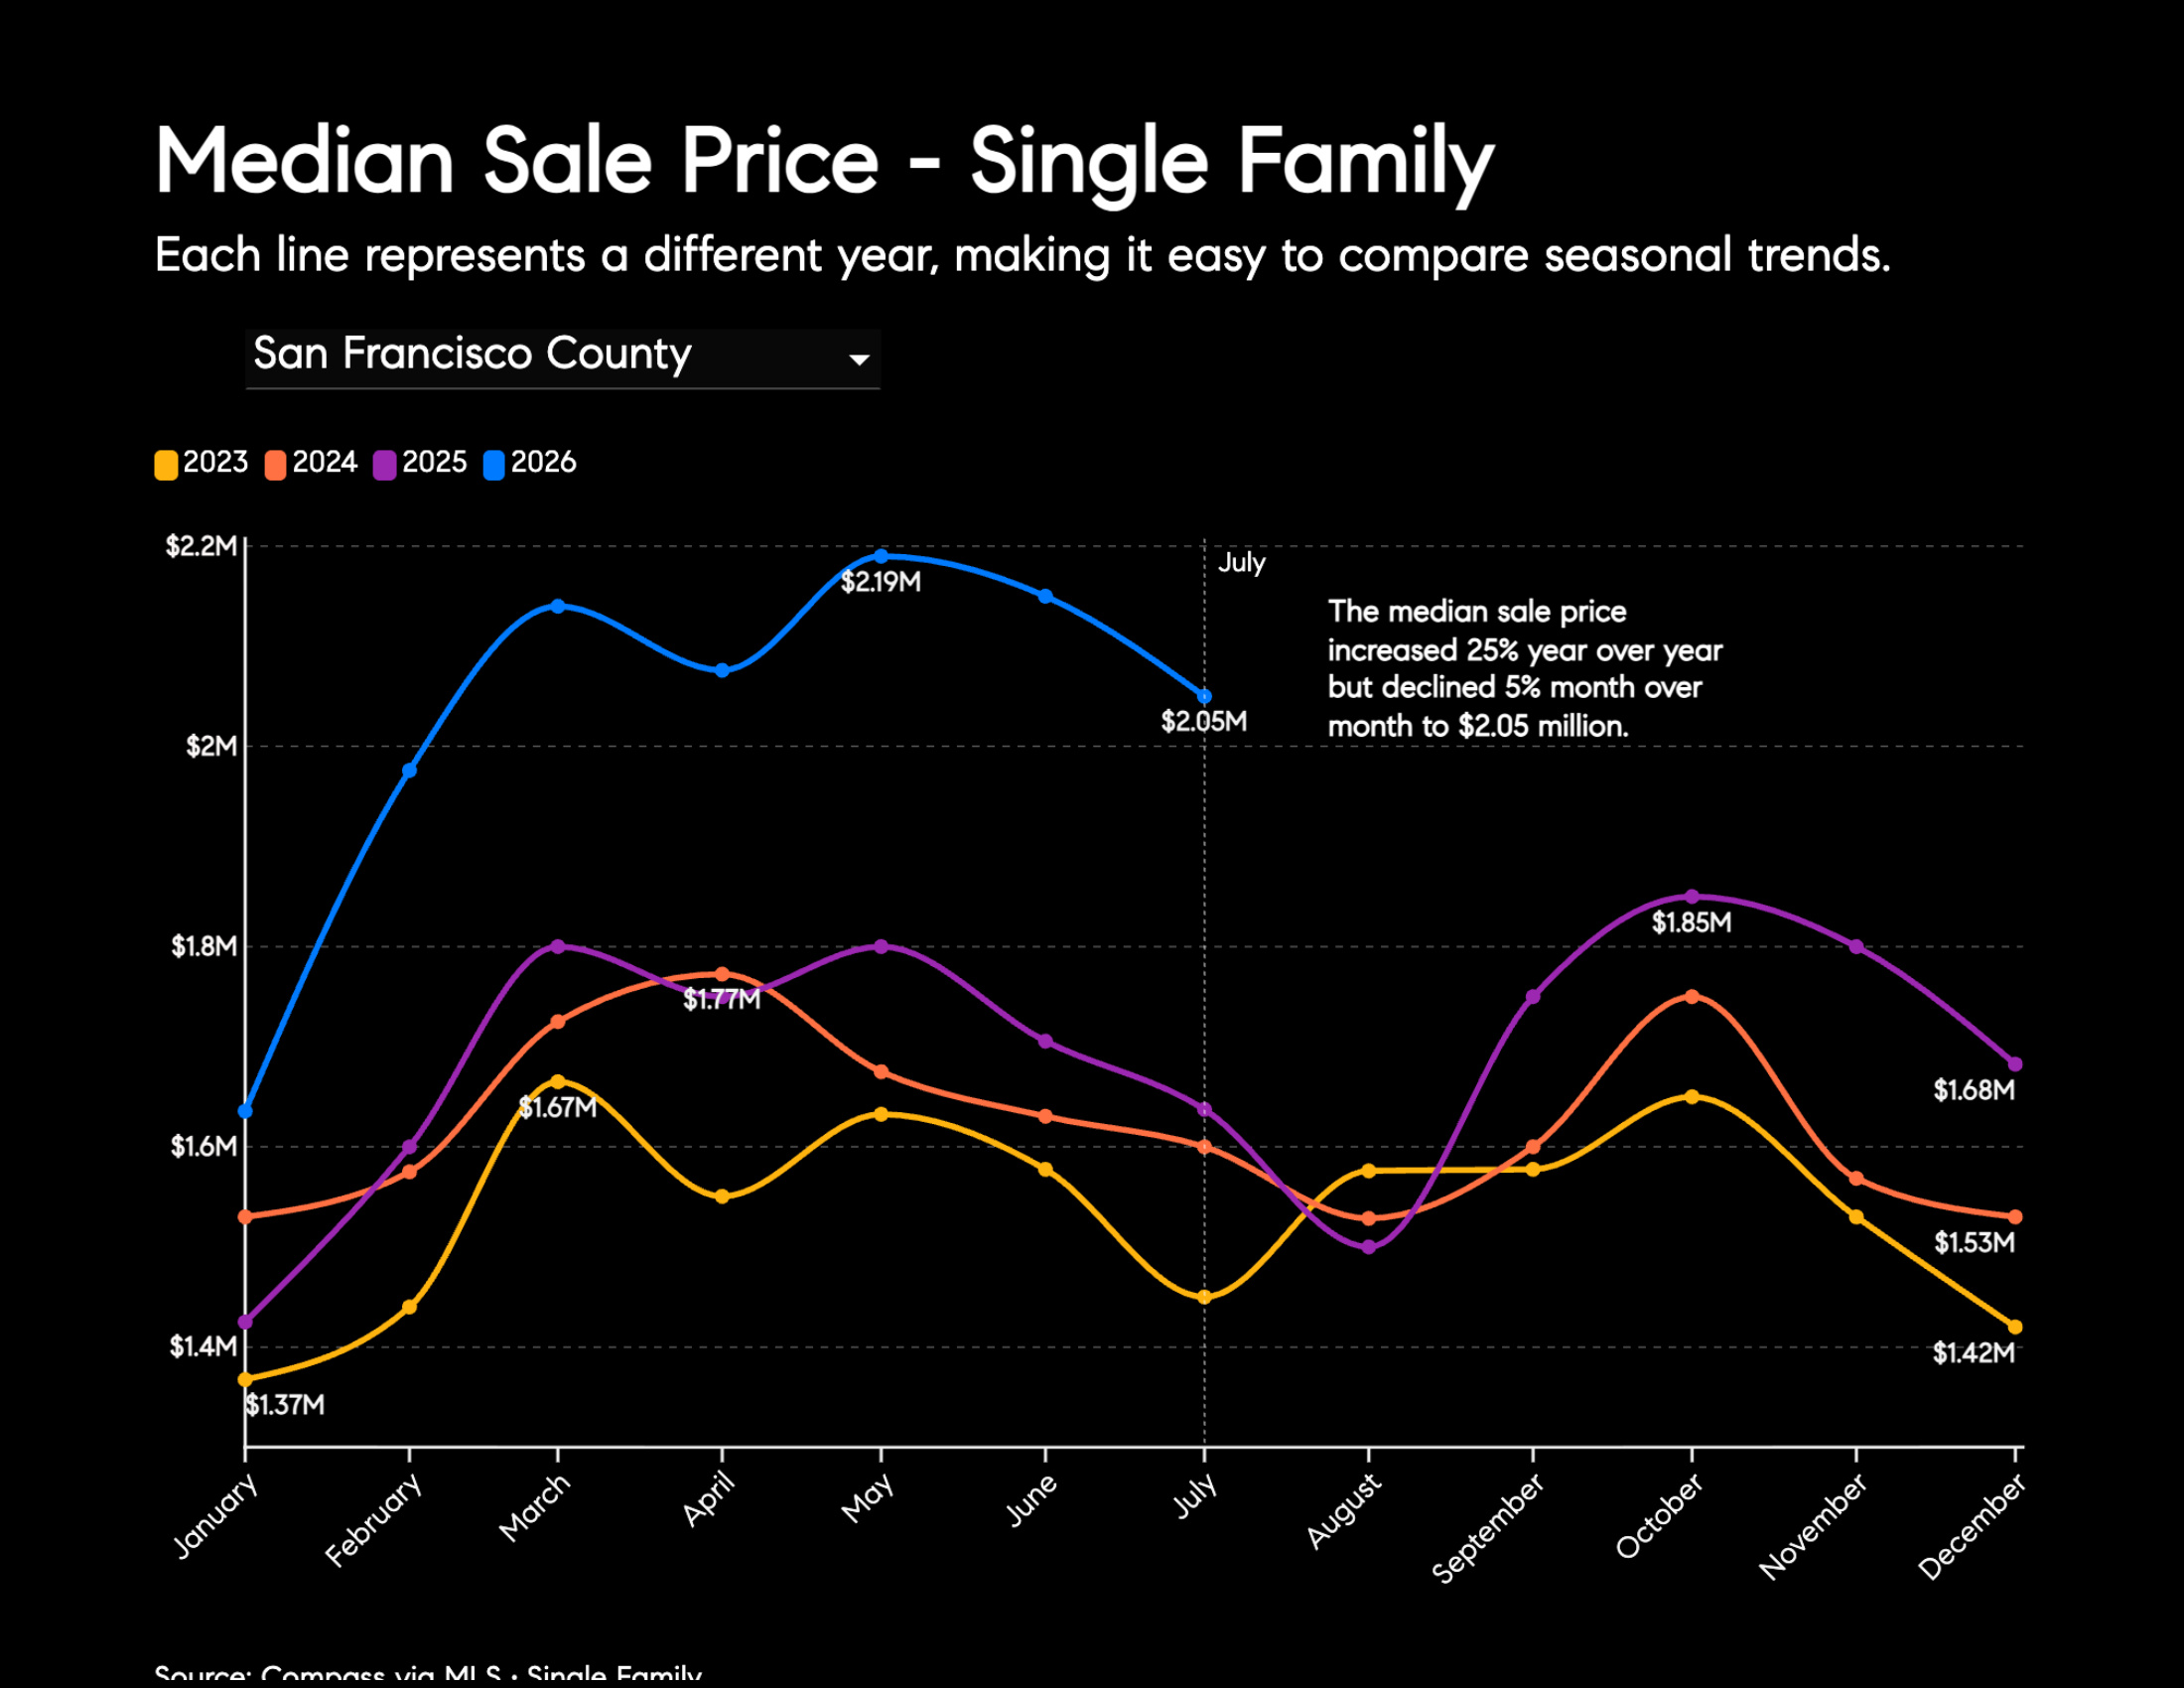
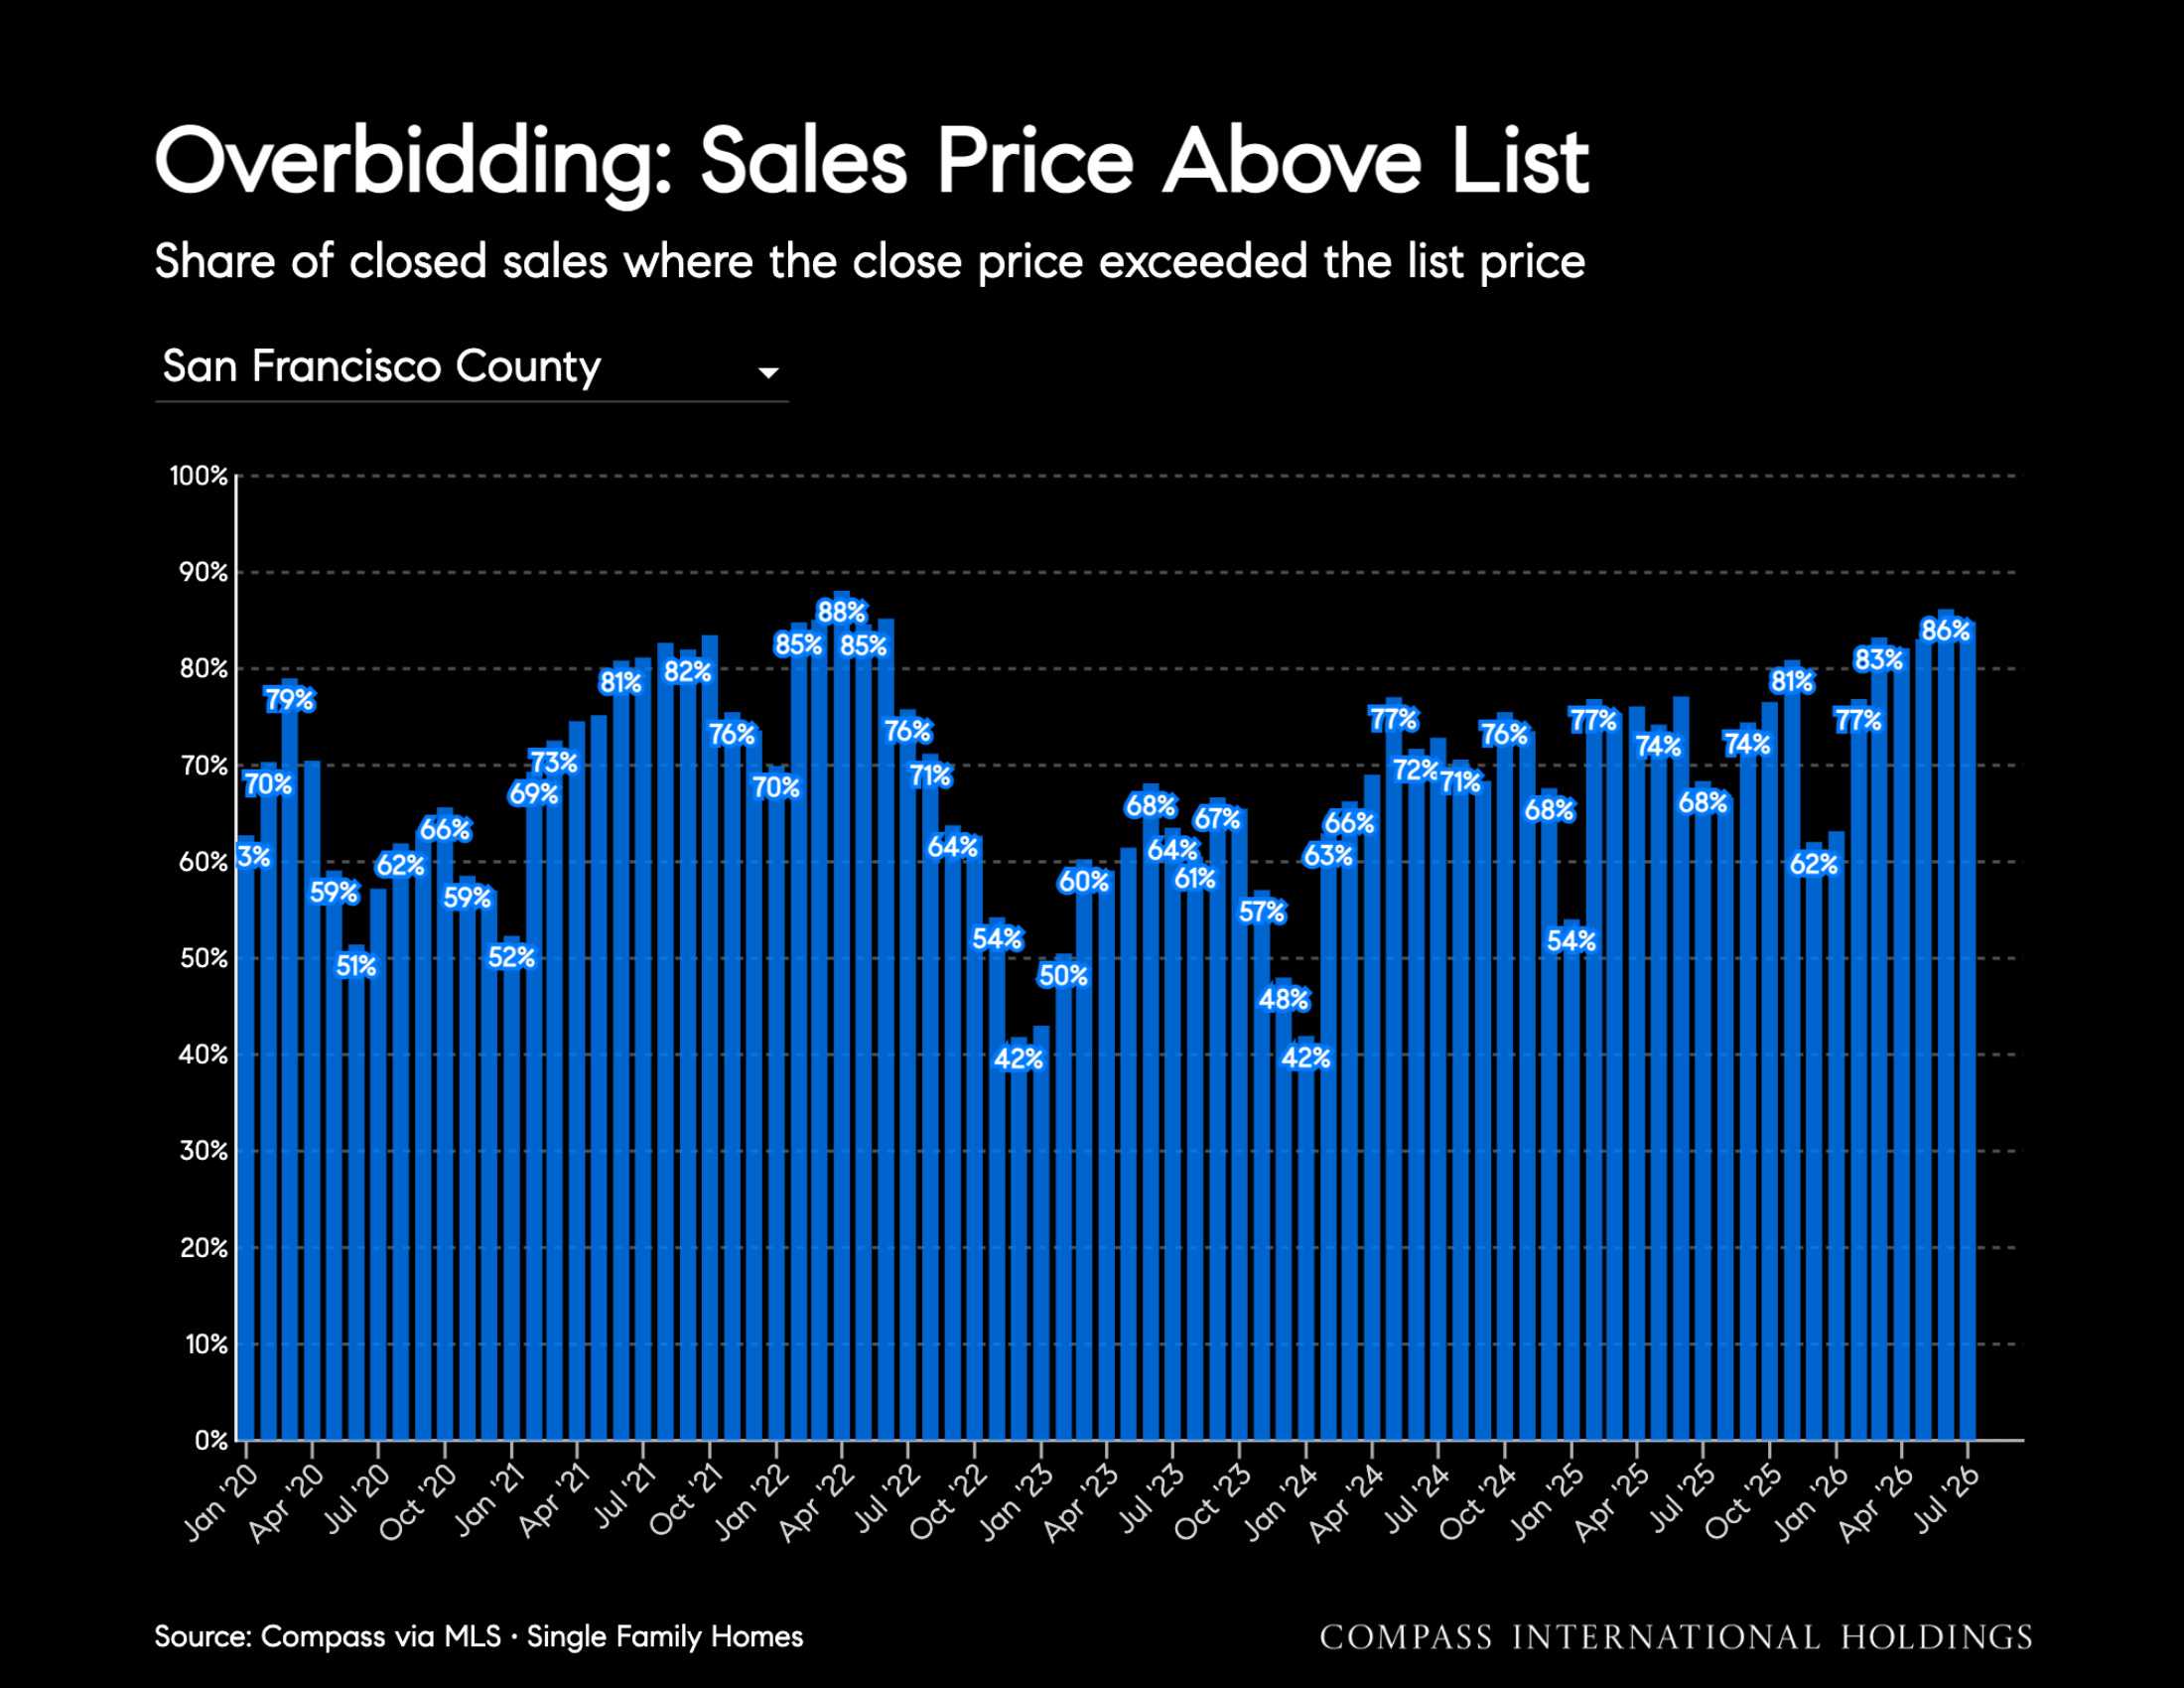
- The median sale price increased 25.2% year over year but declined 4.7% month over month to $2.05 million.
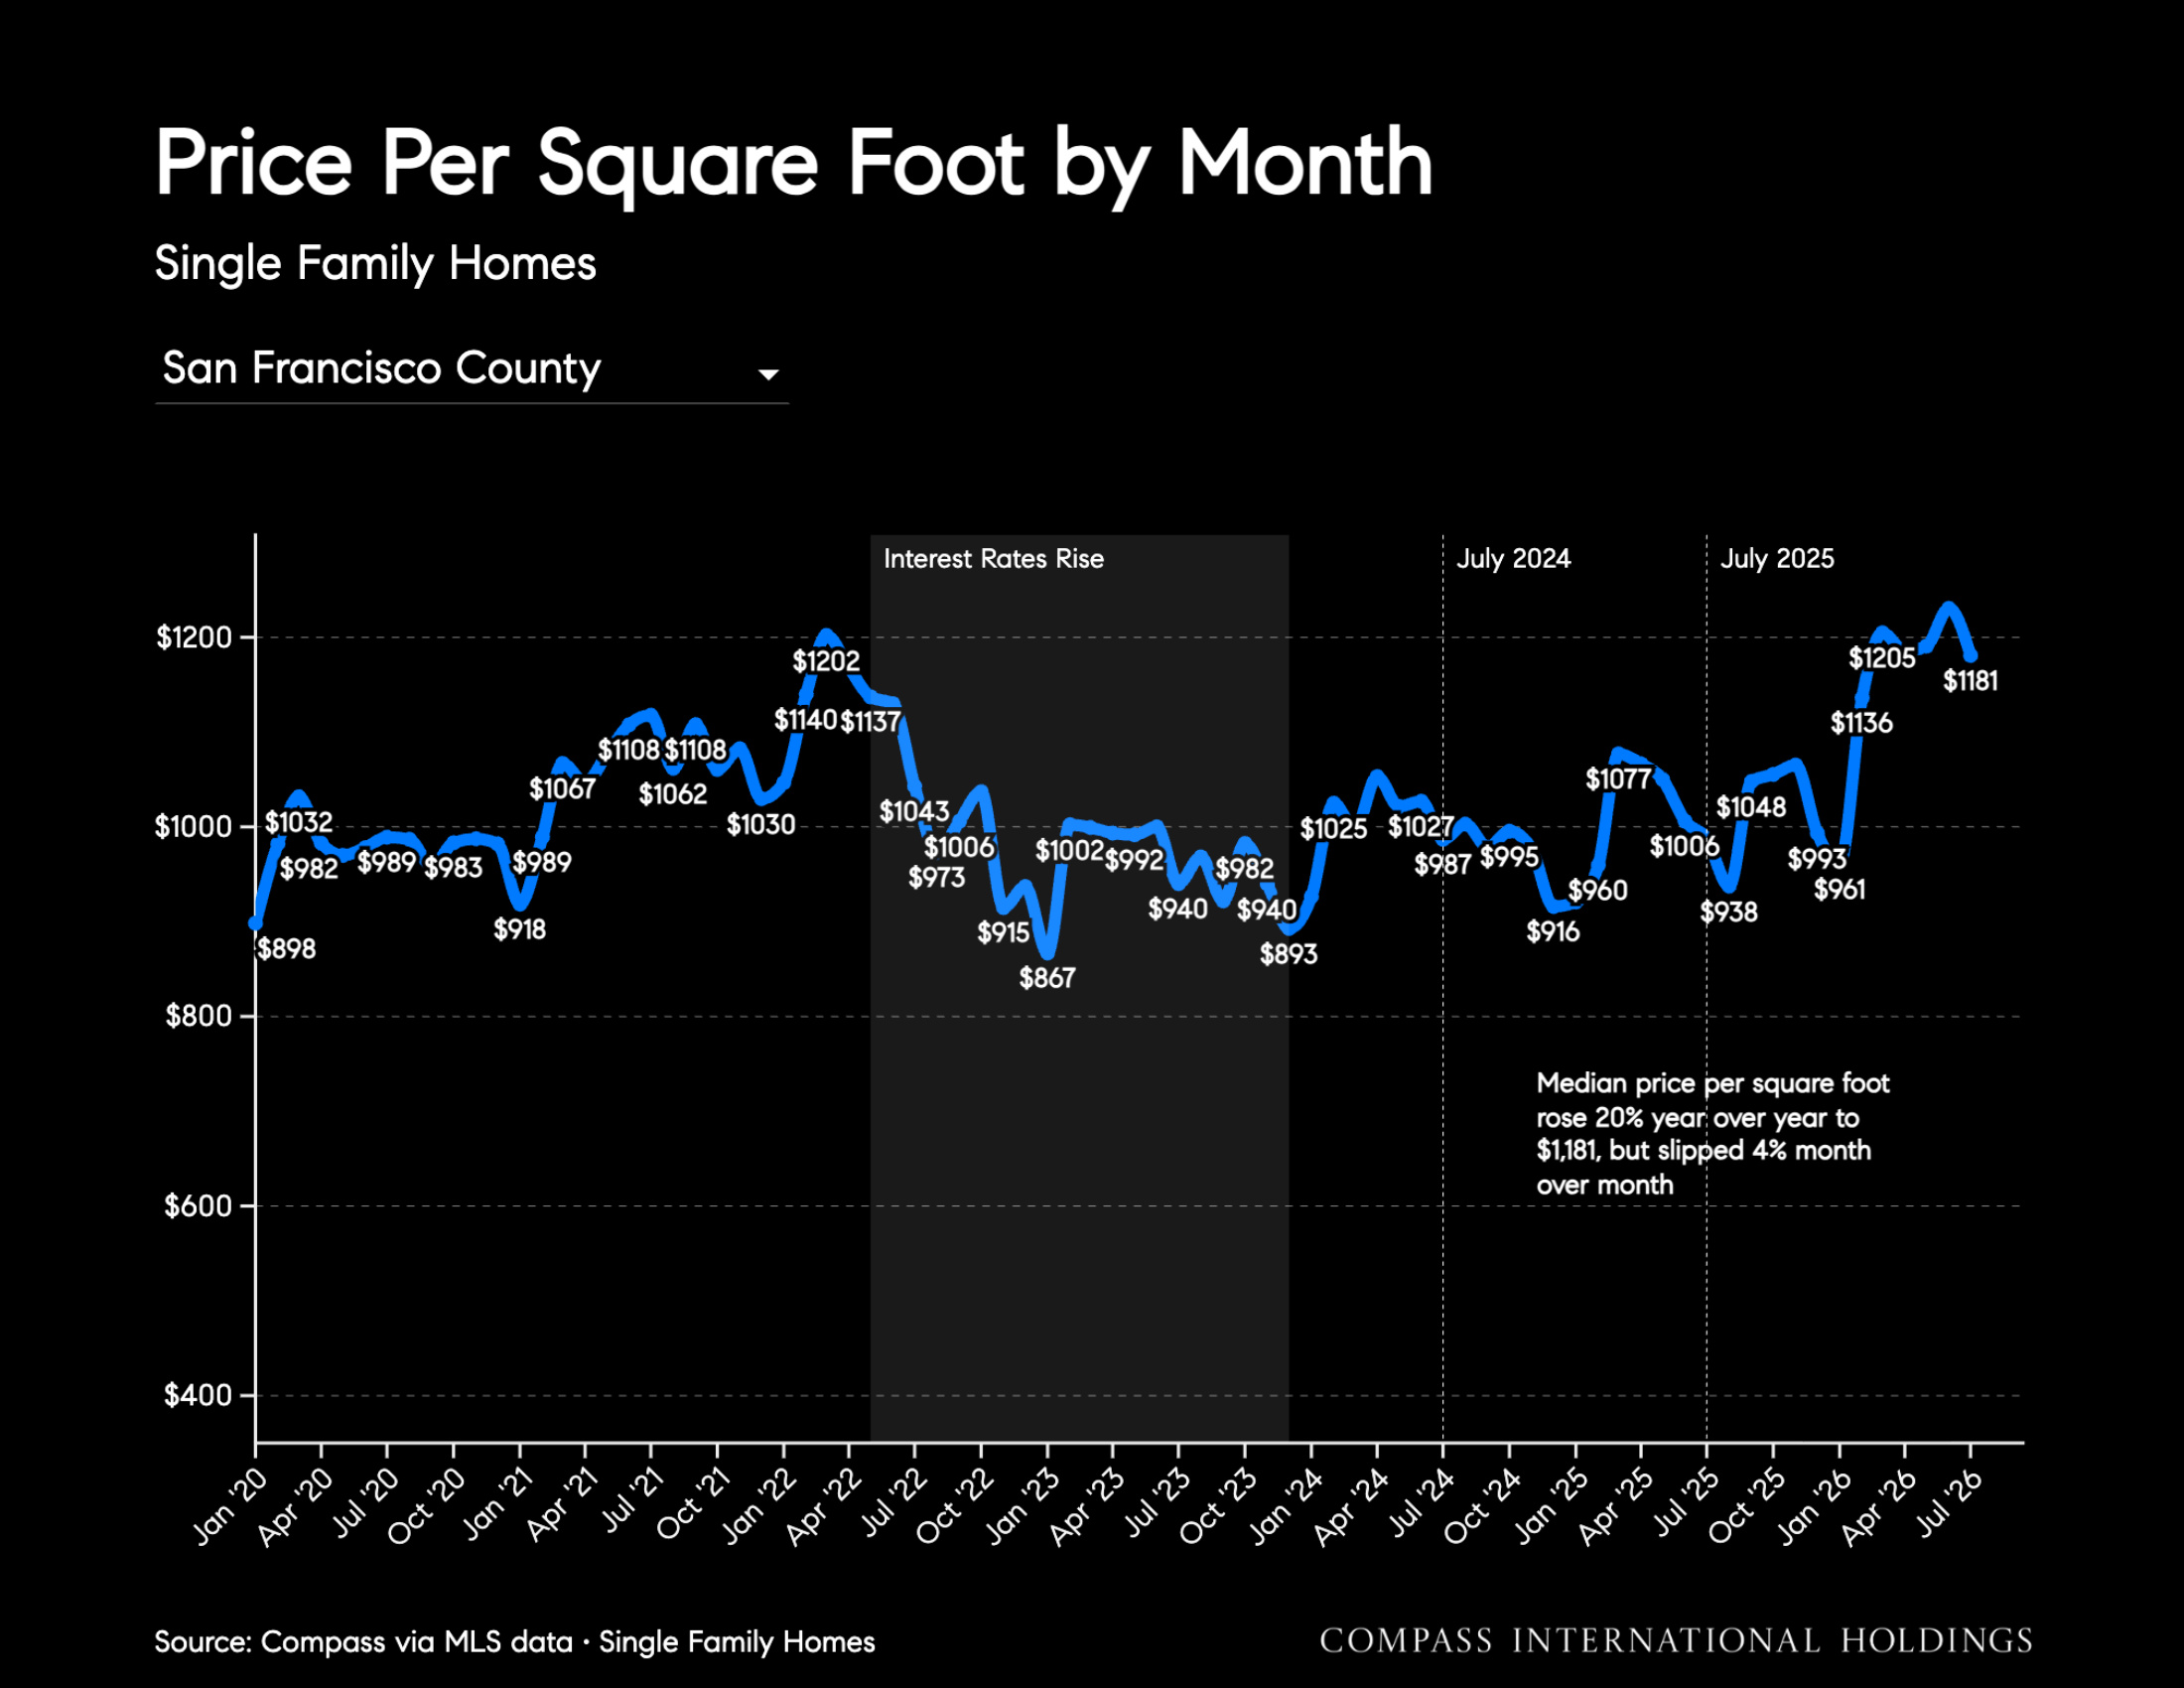
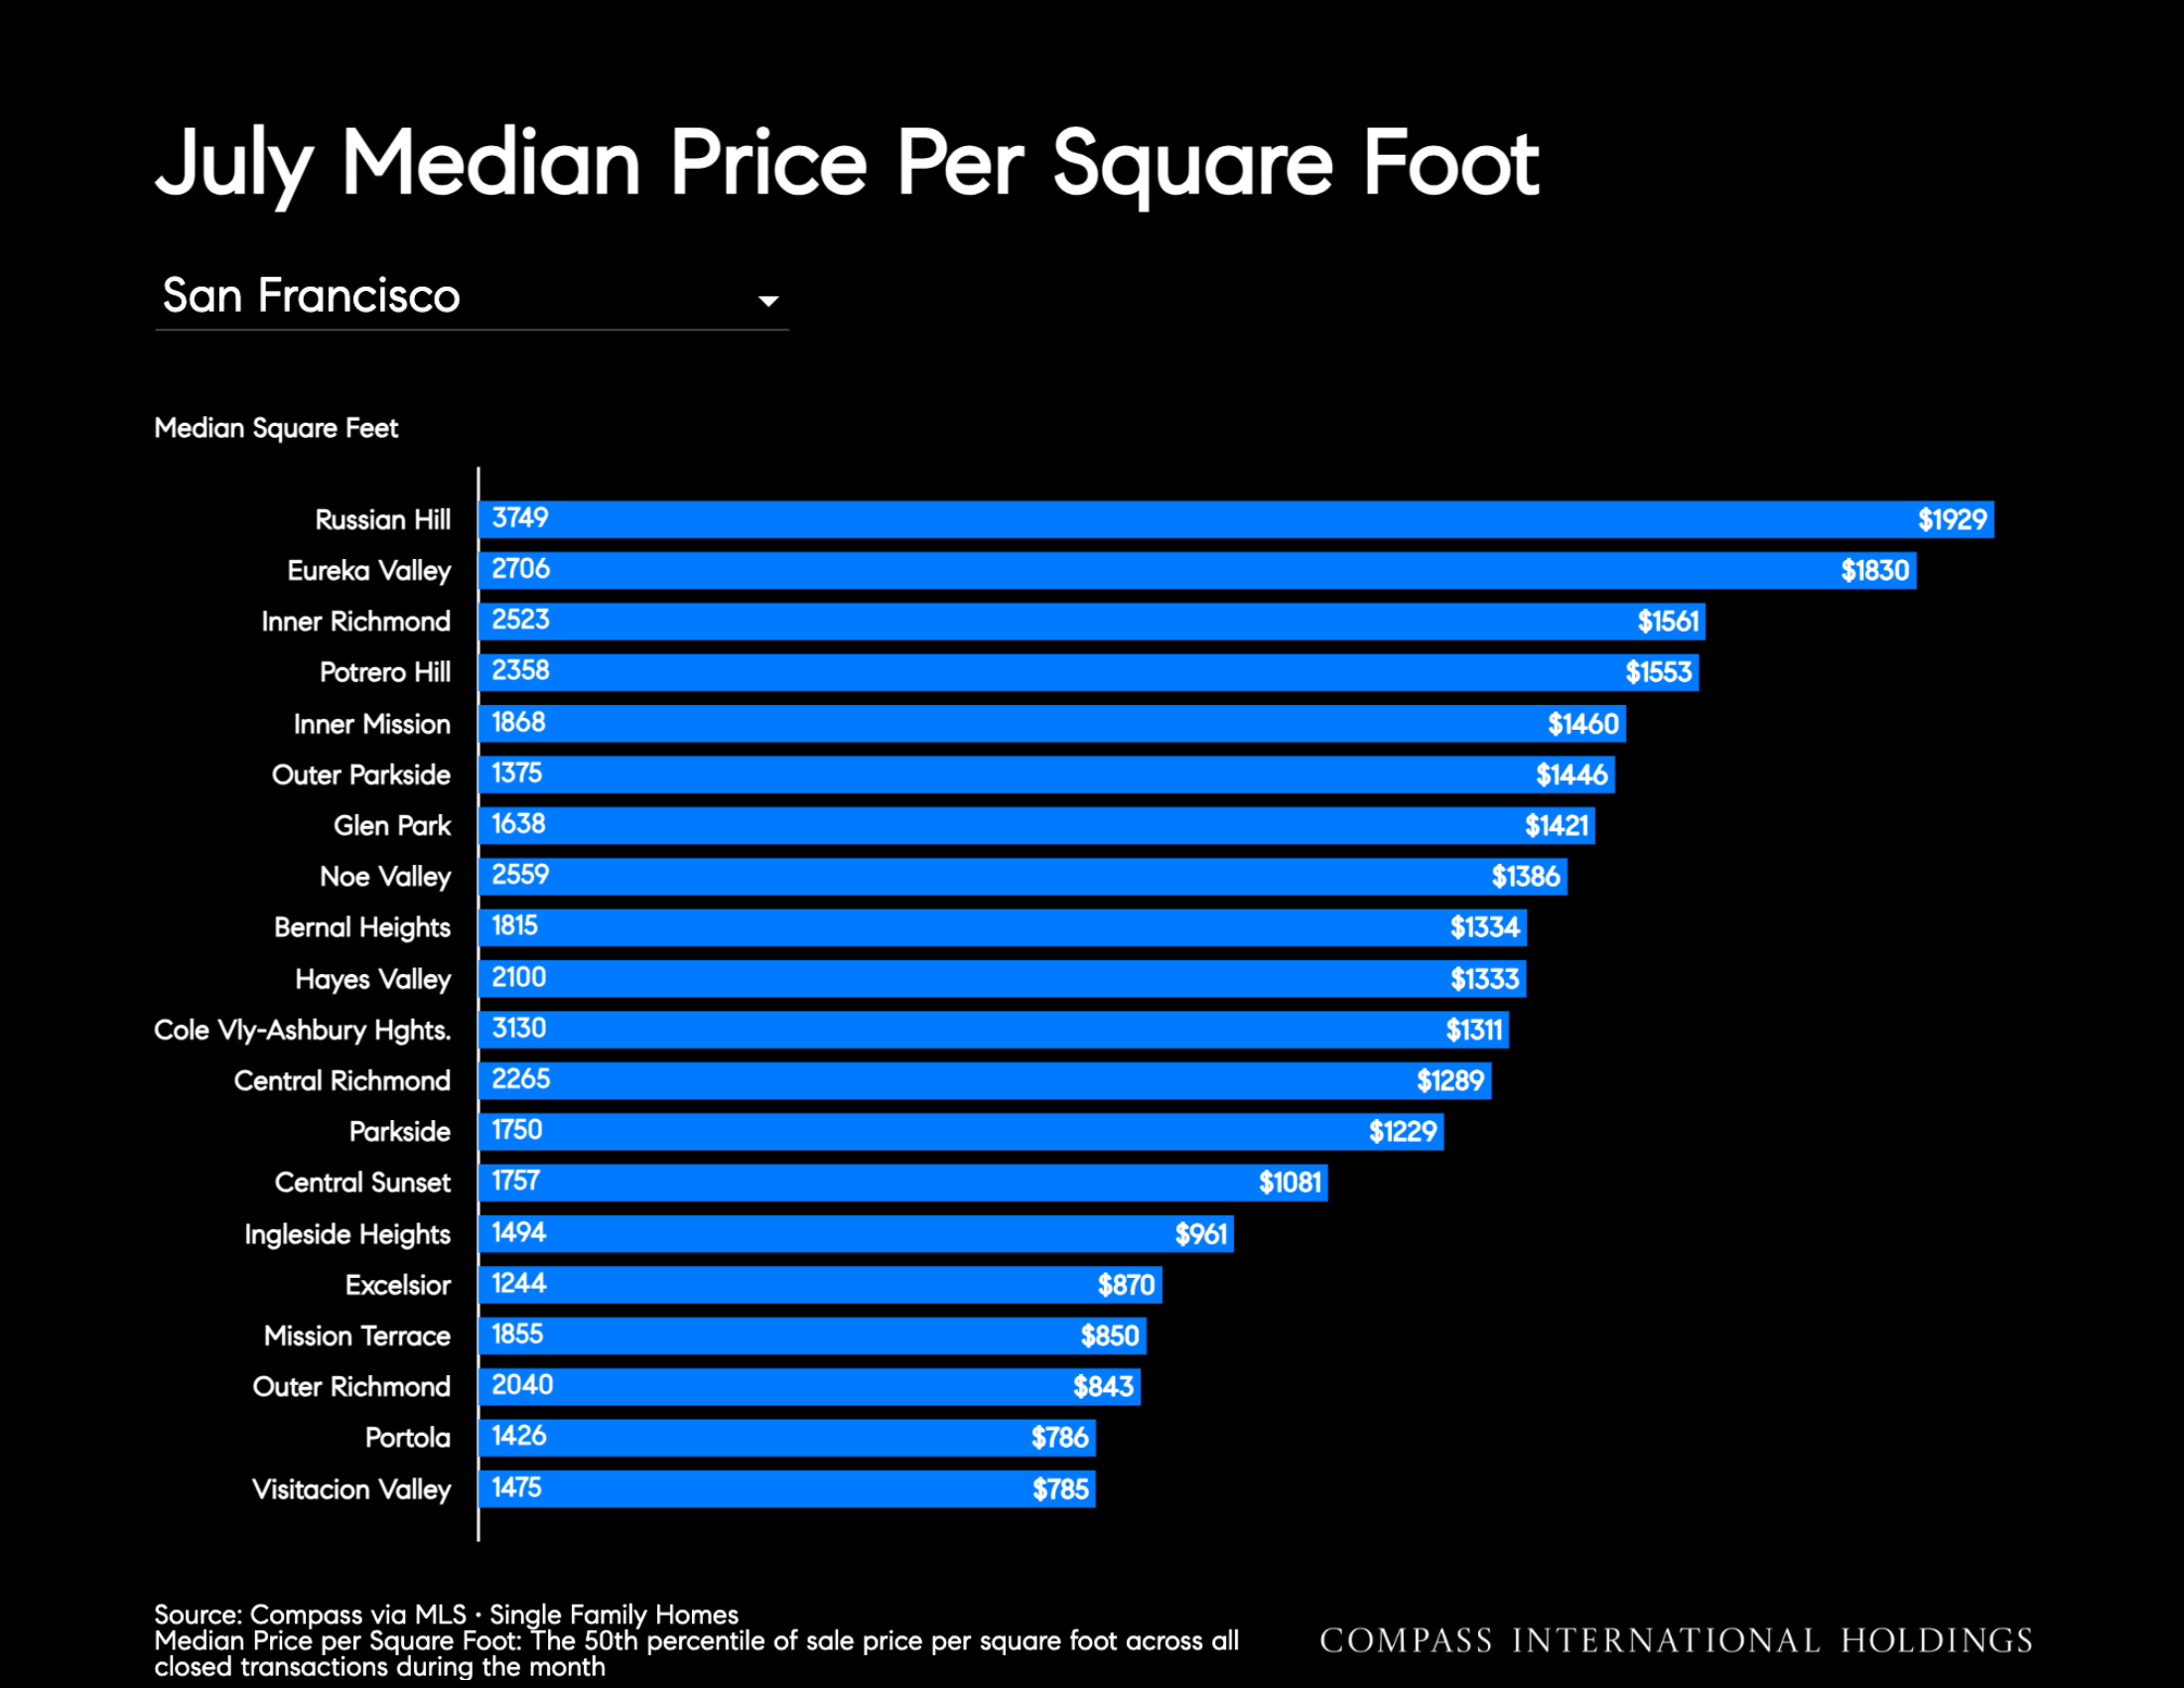
- Median price per square foot rose 19.6% year over year to $1,181, but slipped 4.0% month over month.
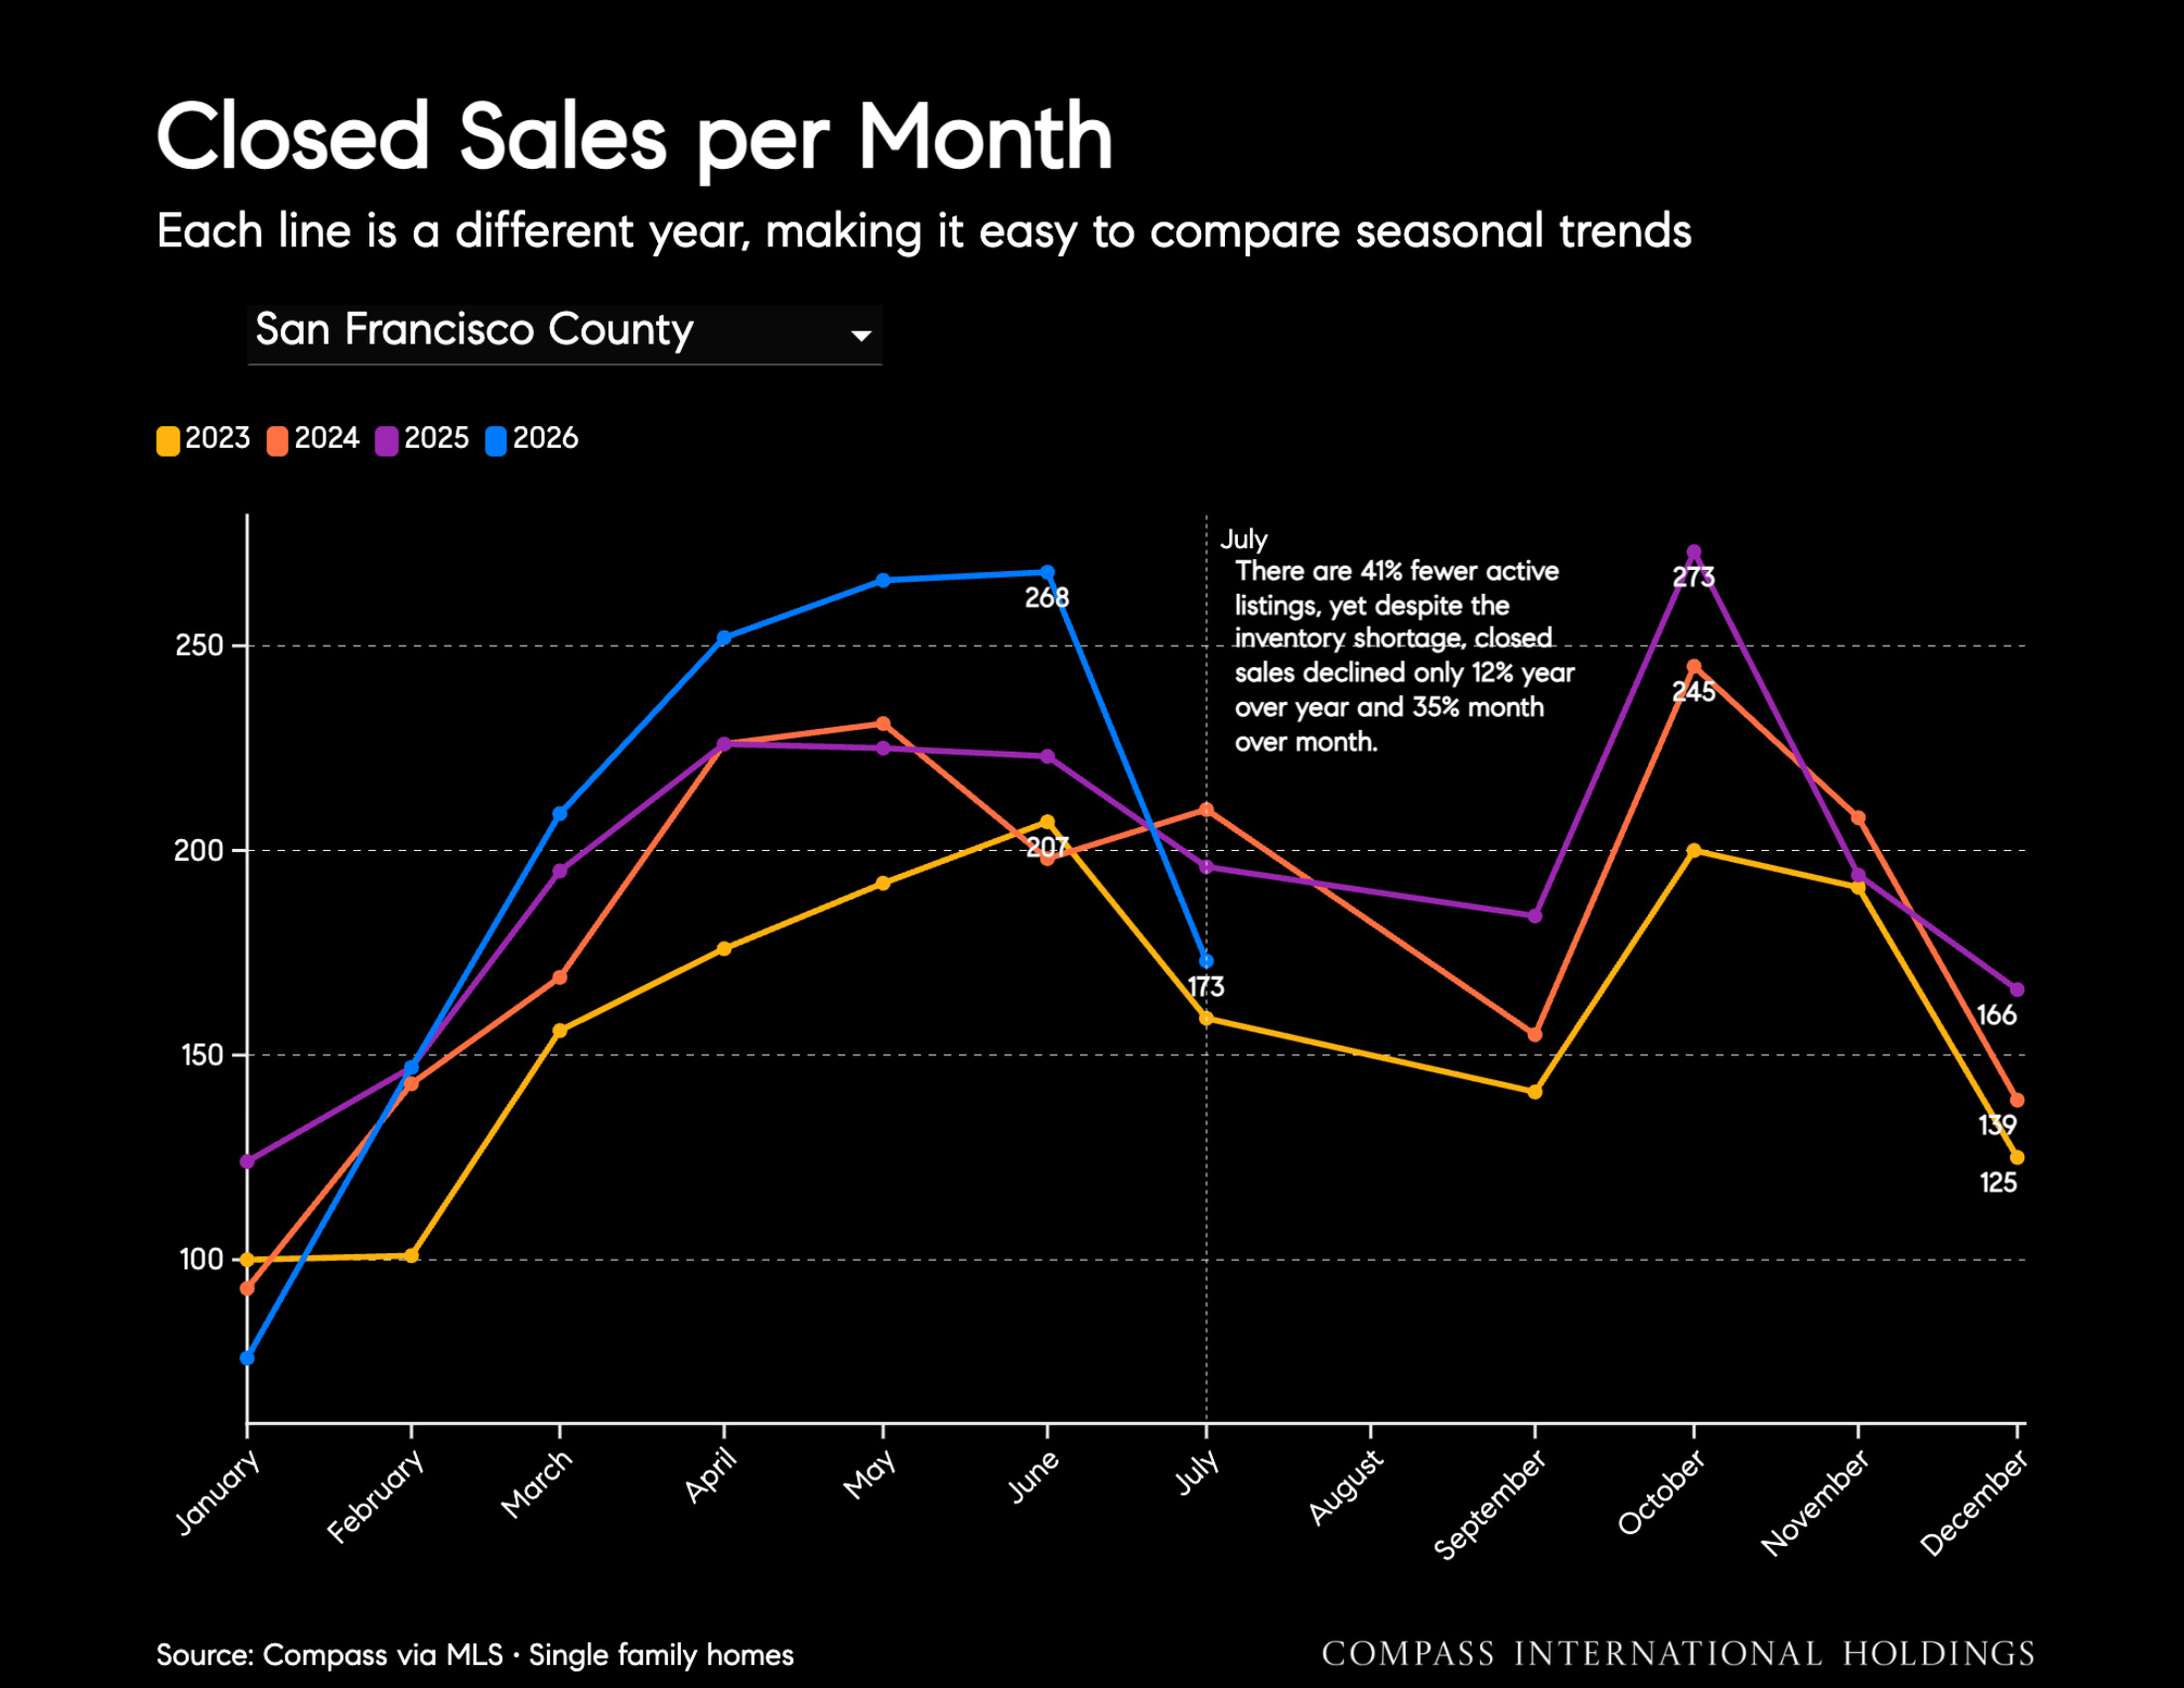
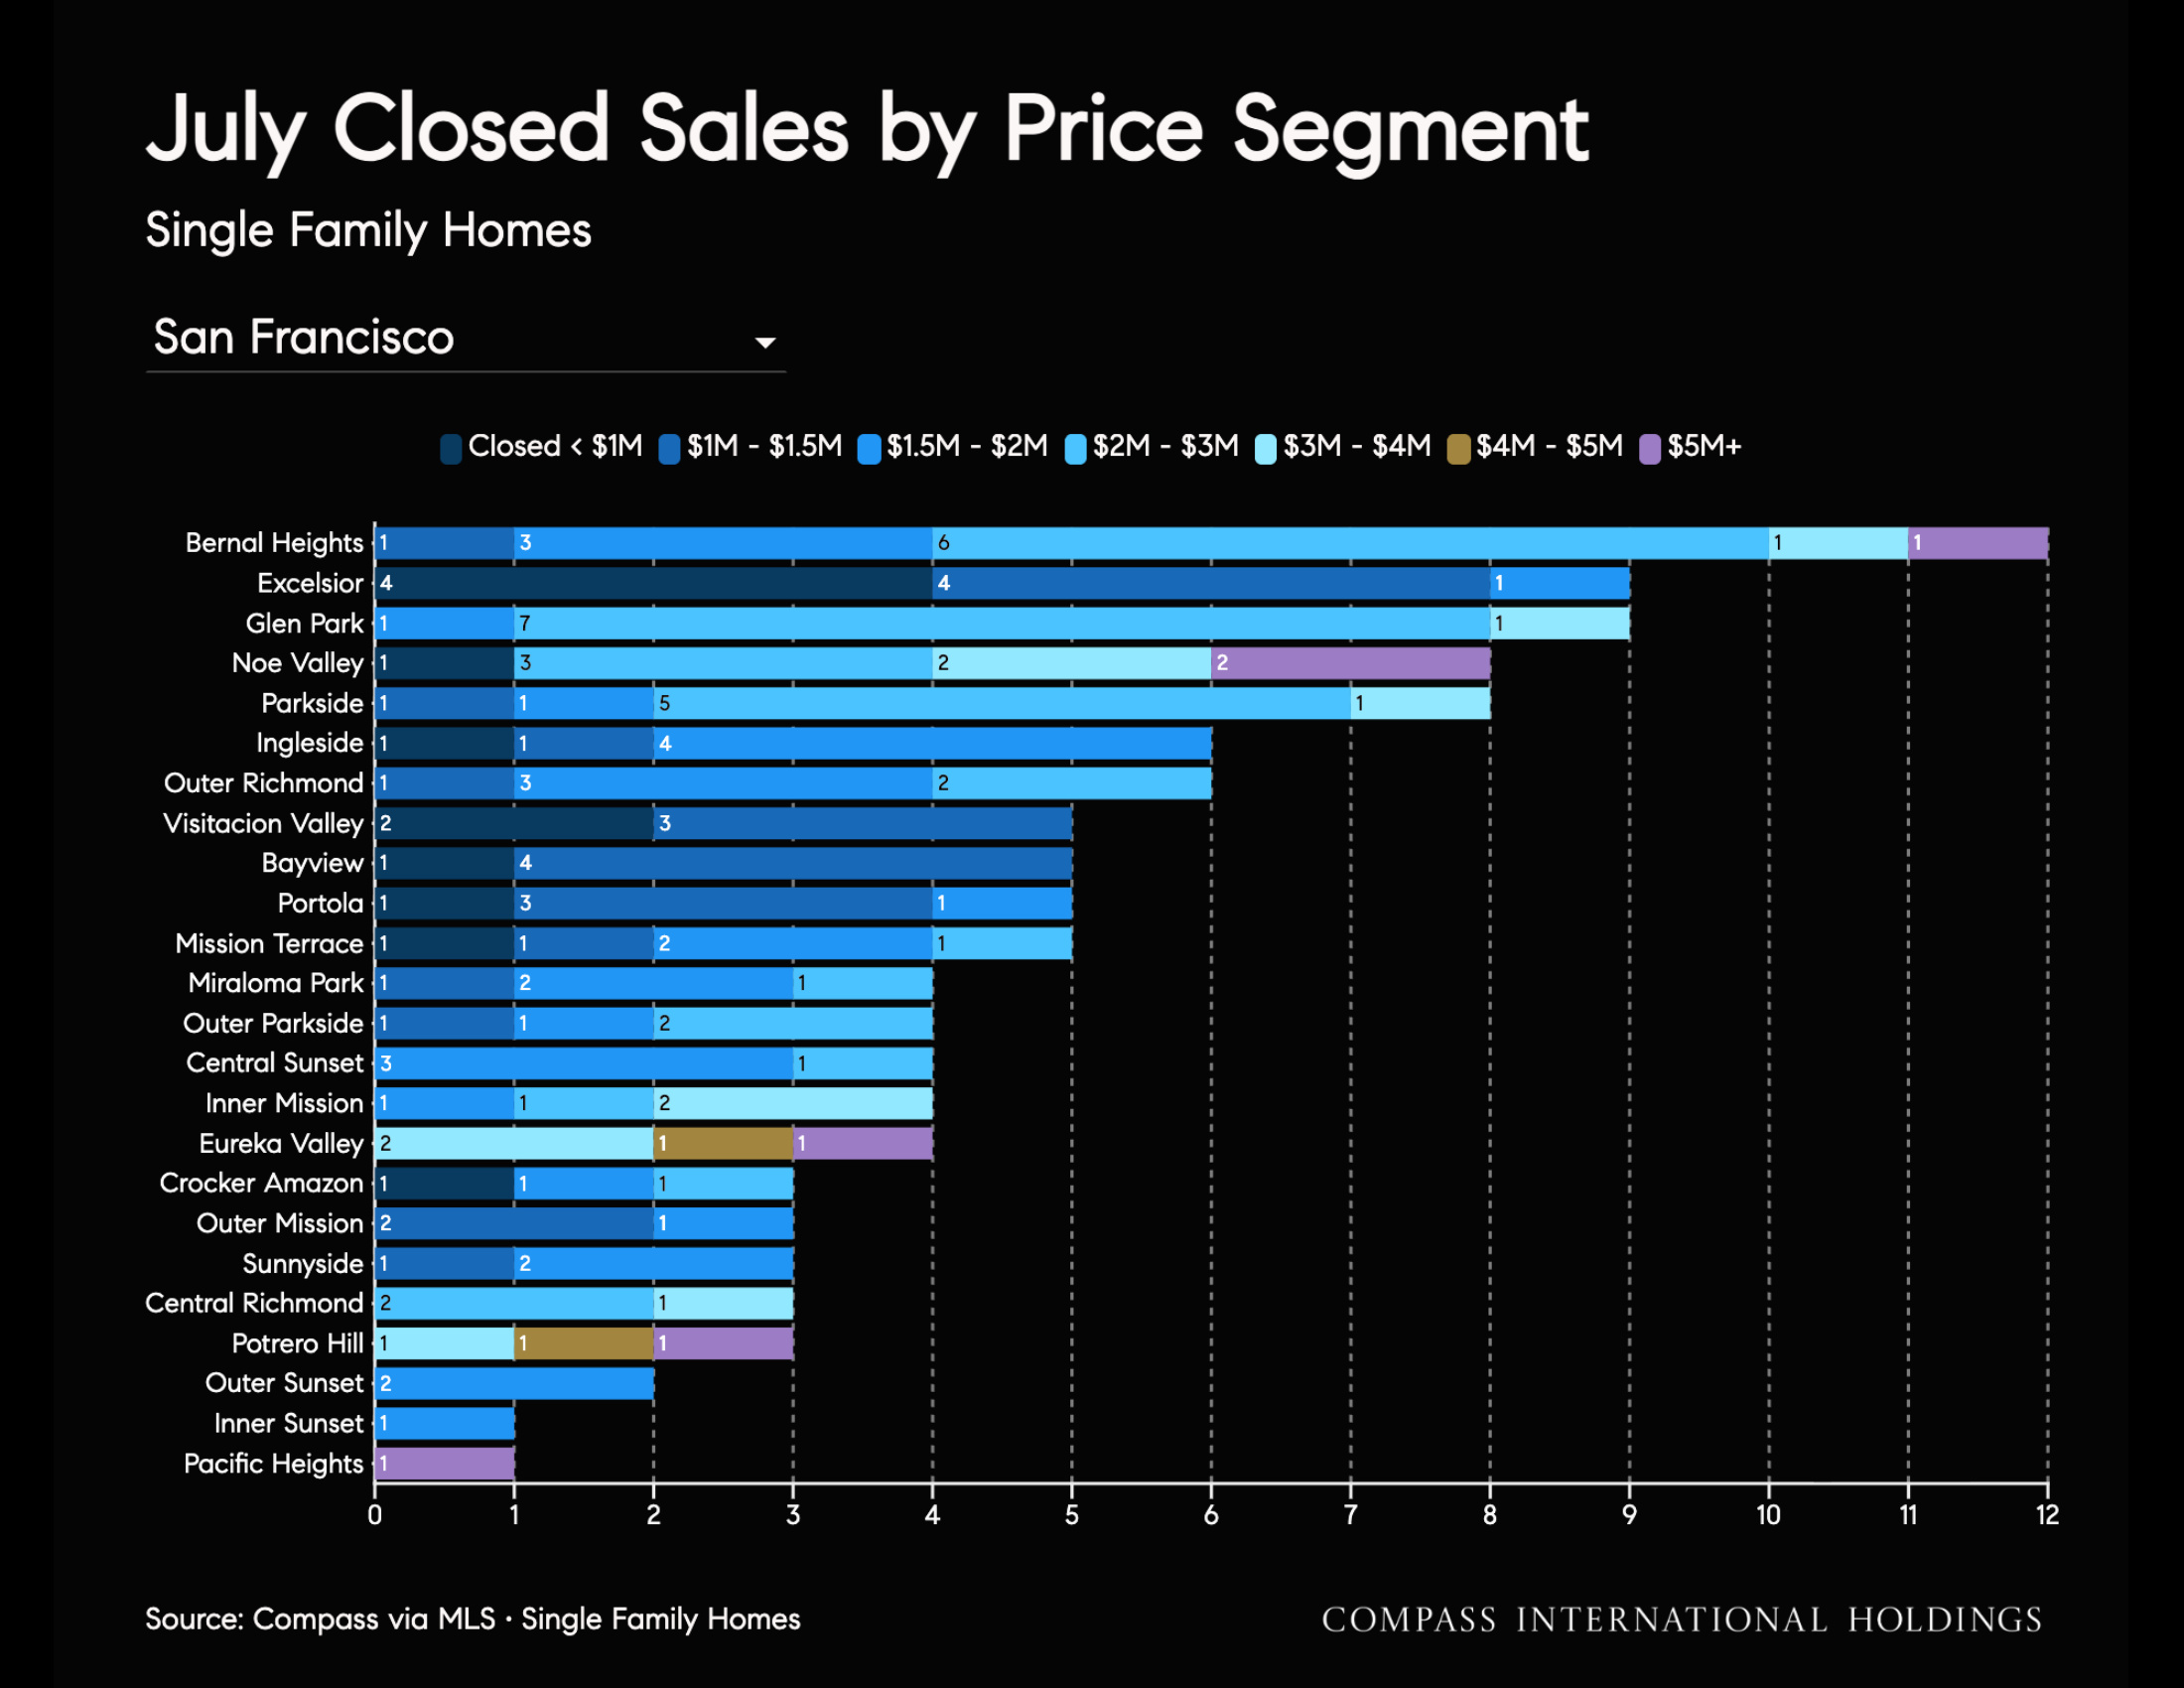
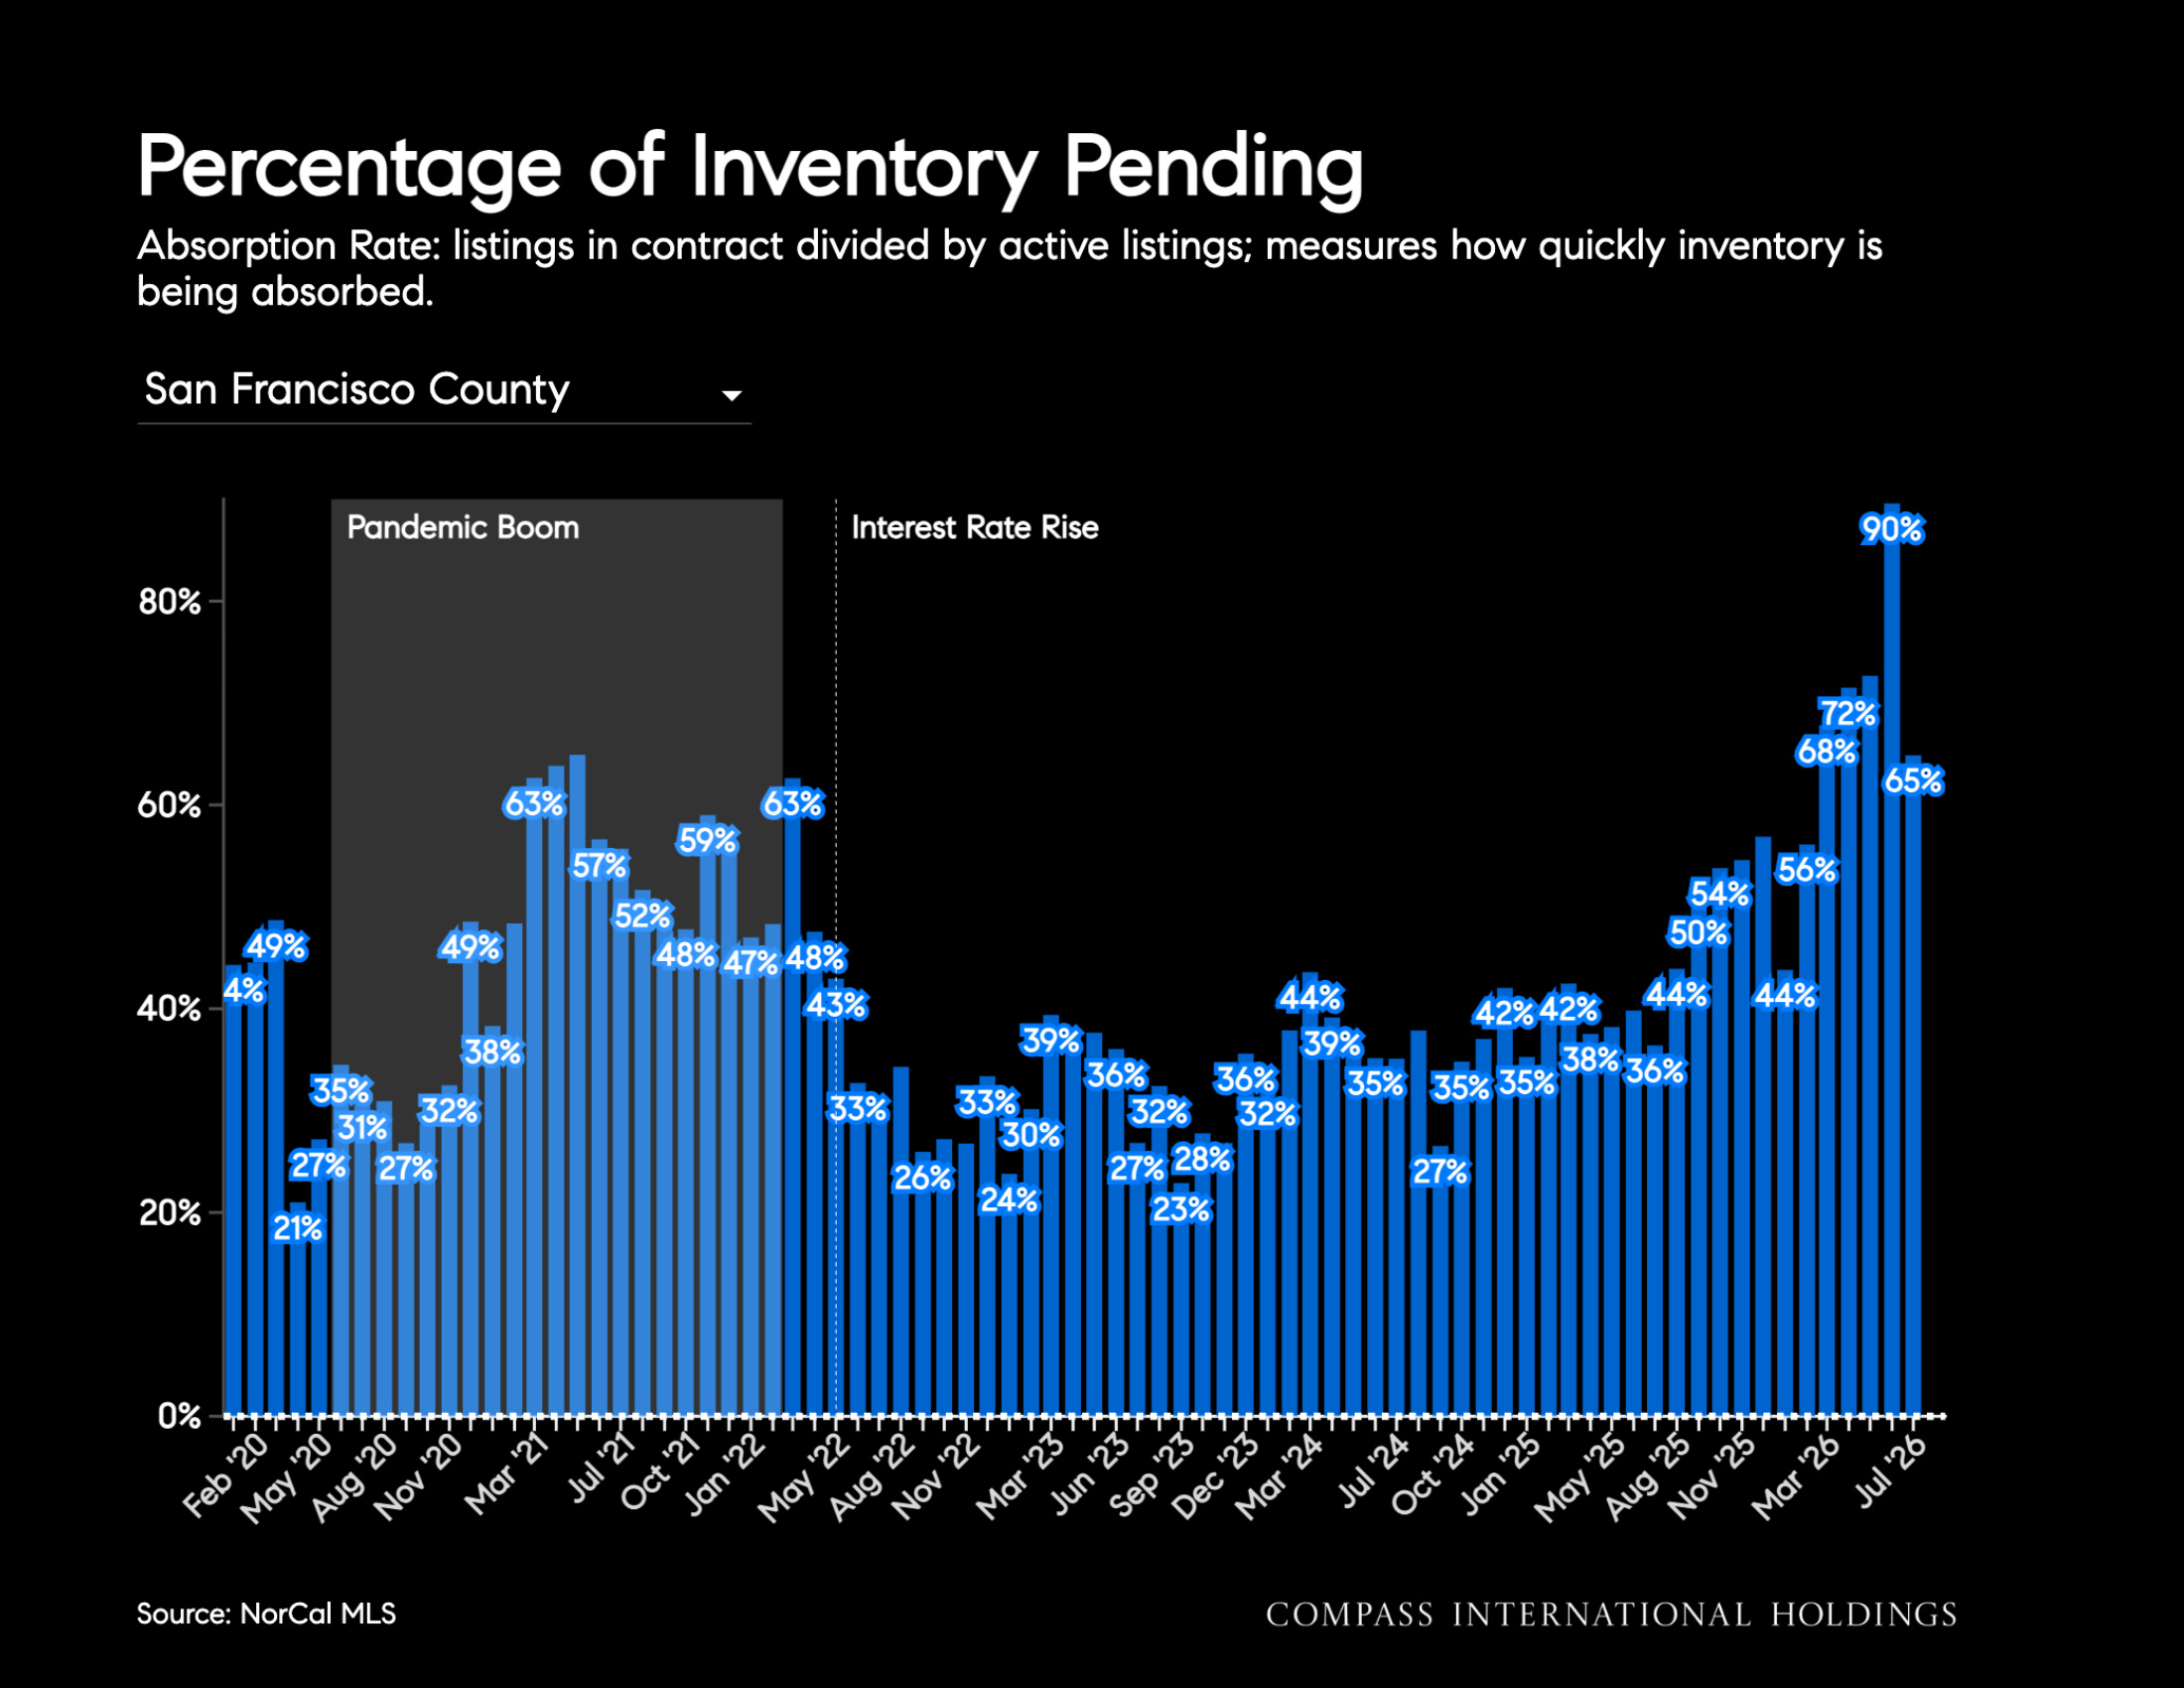
- Closed sales declined 11.7% year over year and 35.4% month over month to 173 transactions, while pending sales fell 11.2% year over year and 32.7% from June to 150.
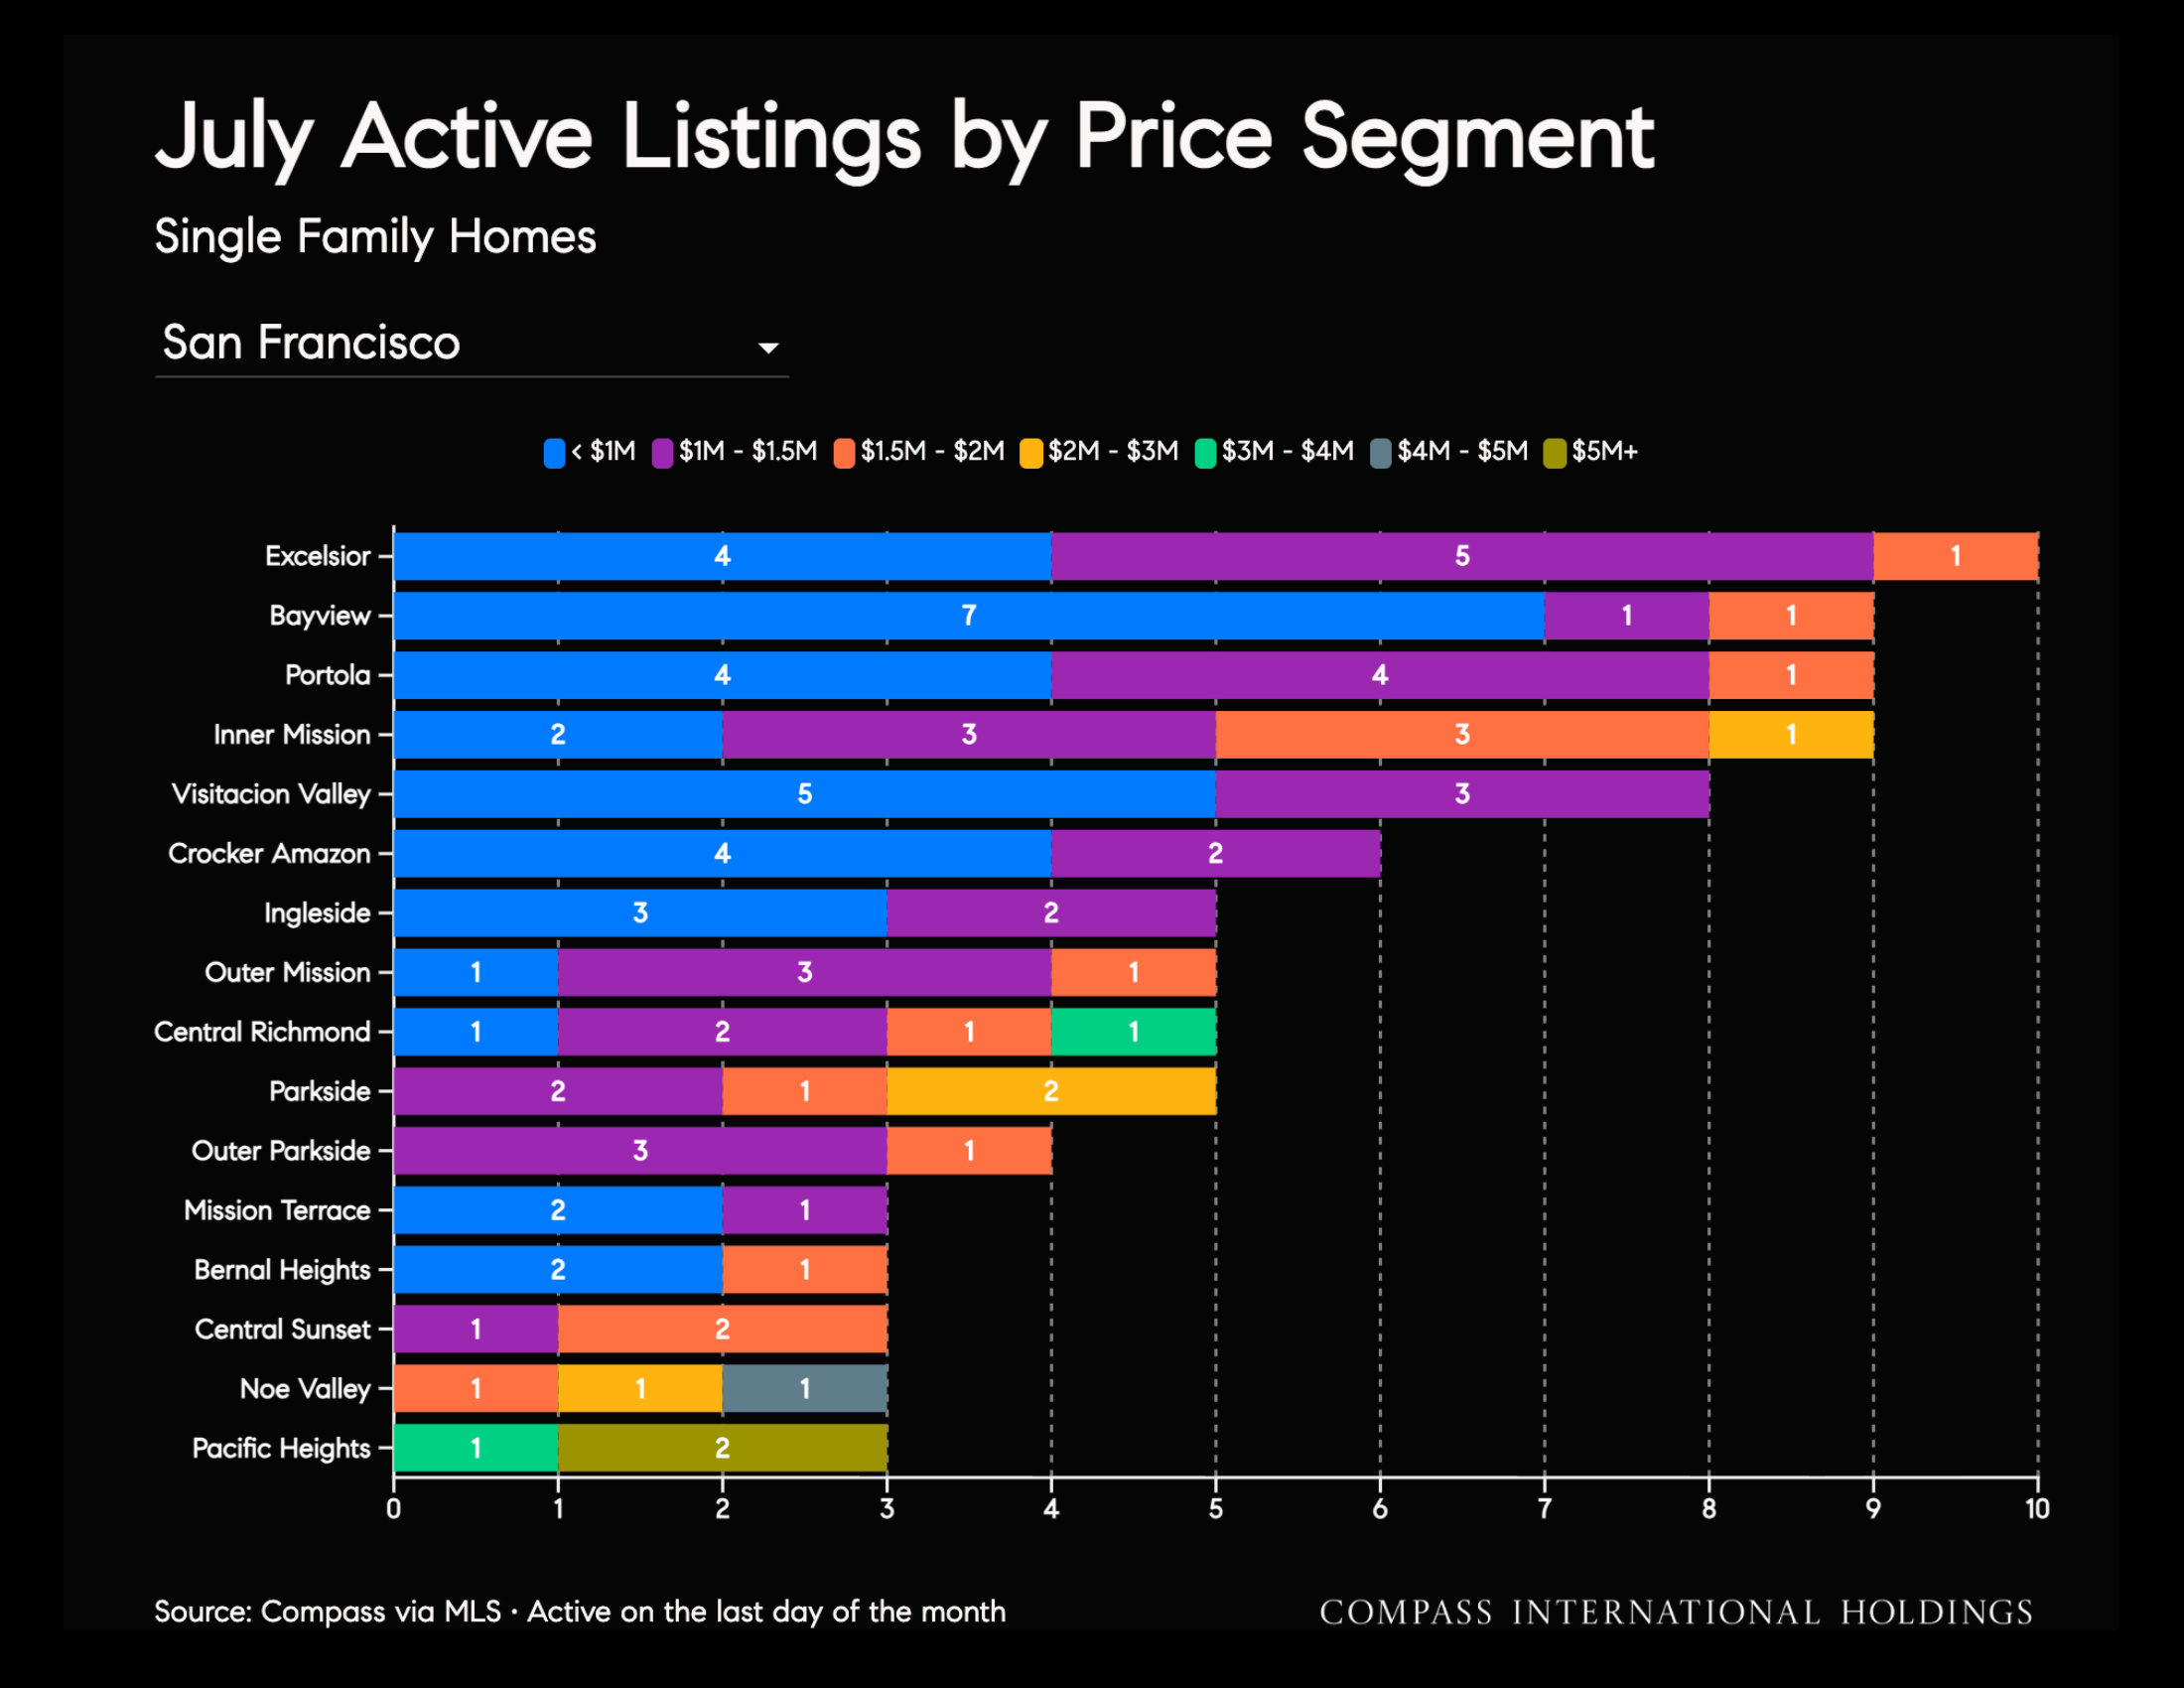
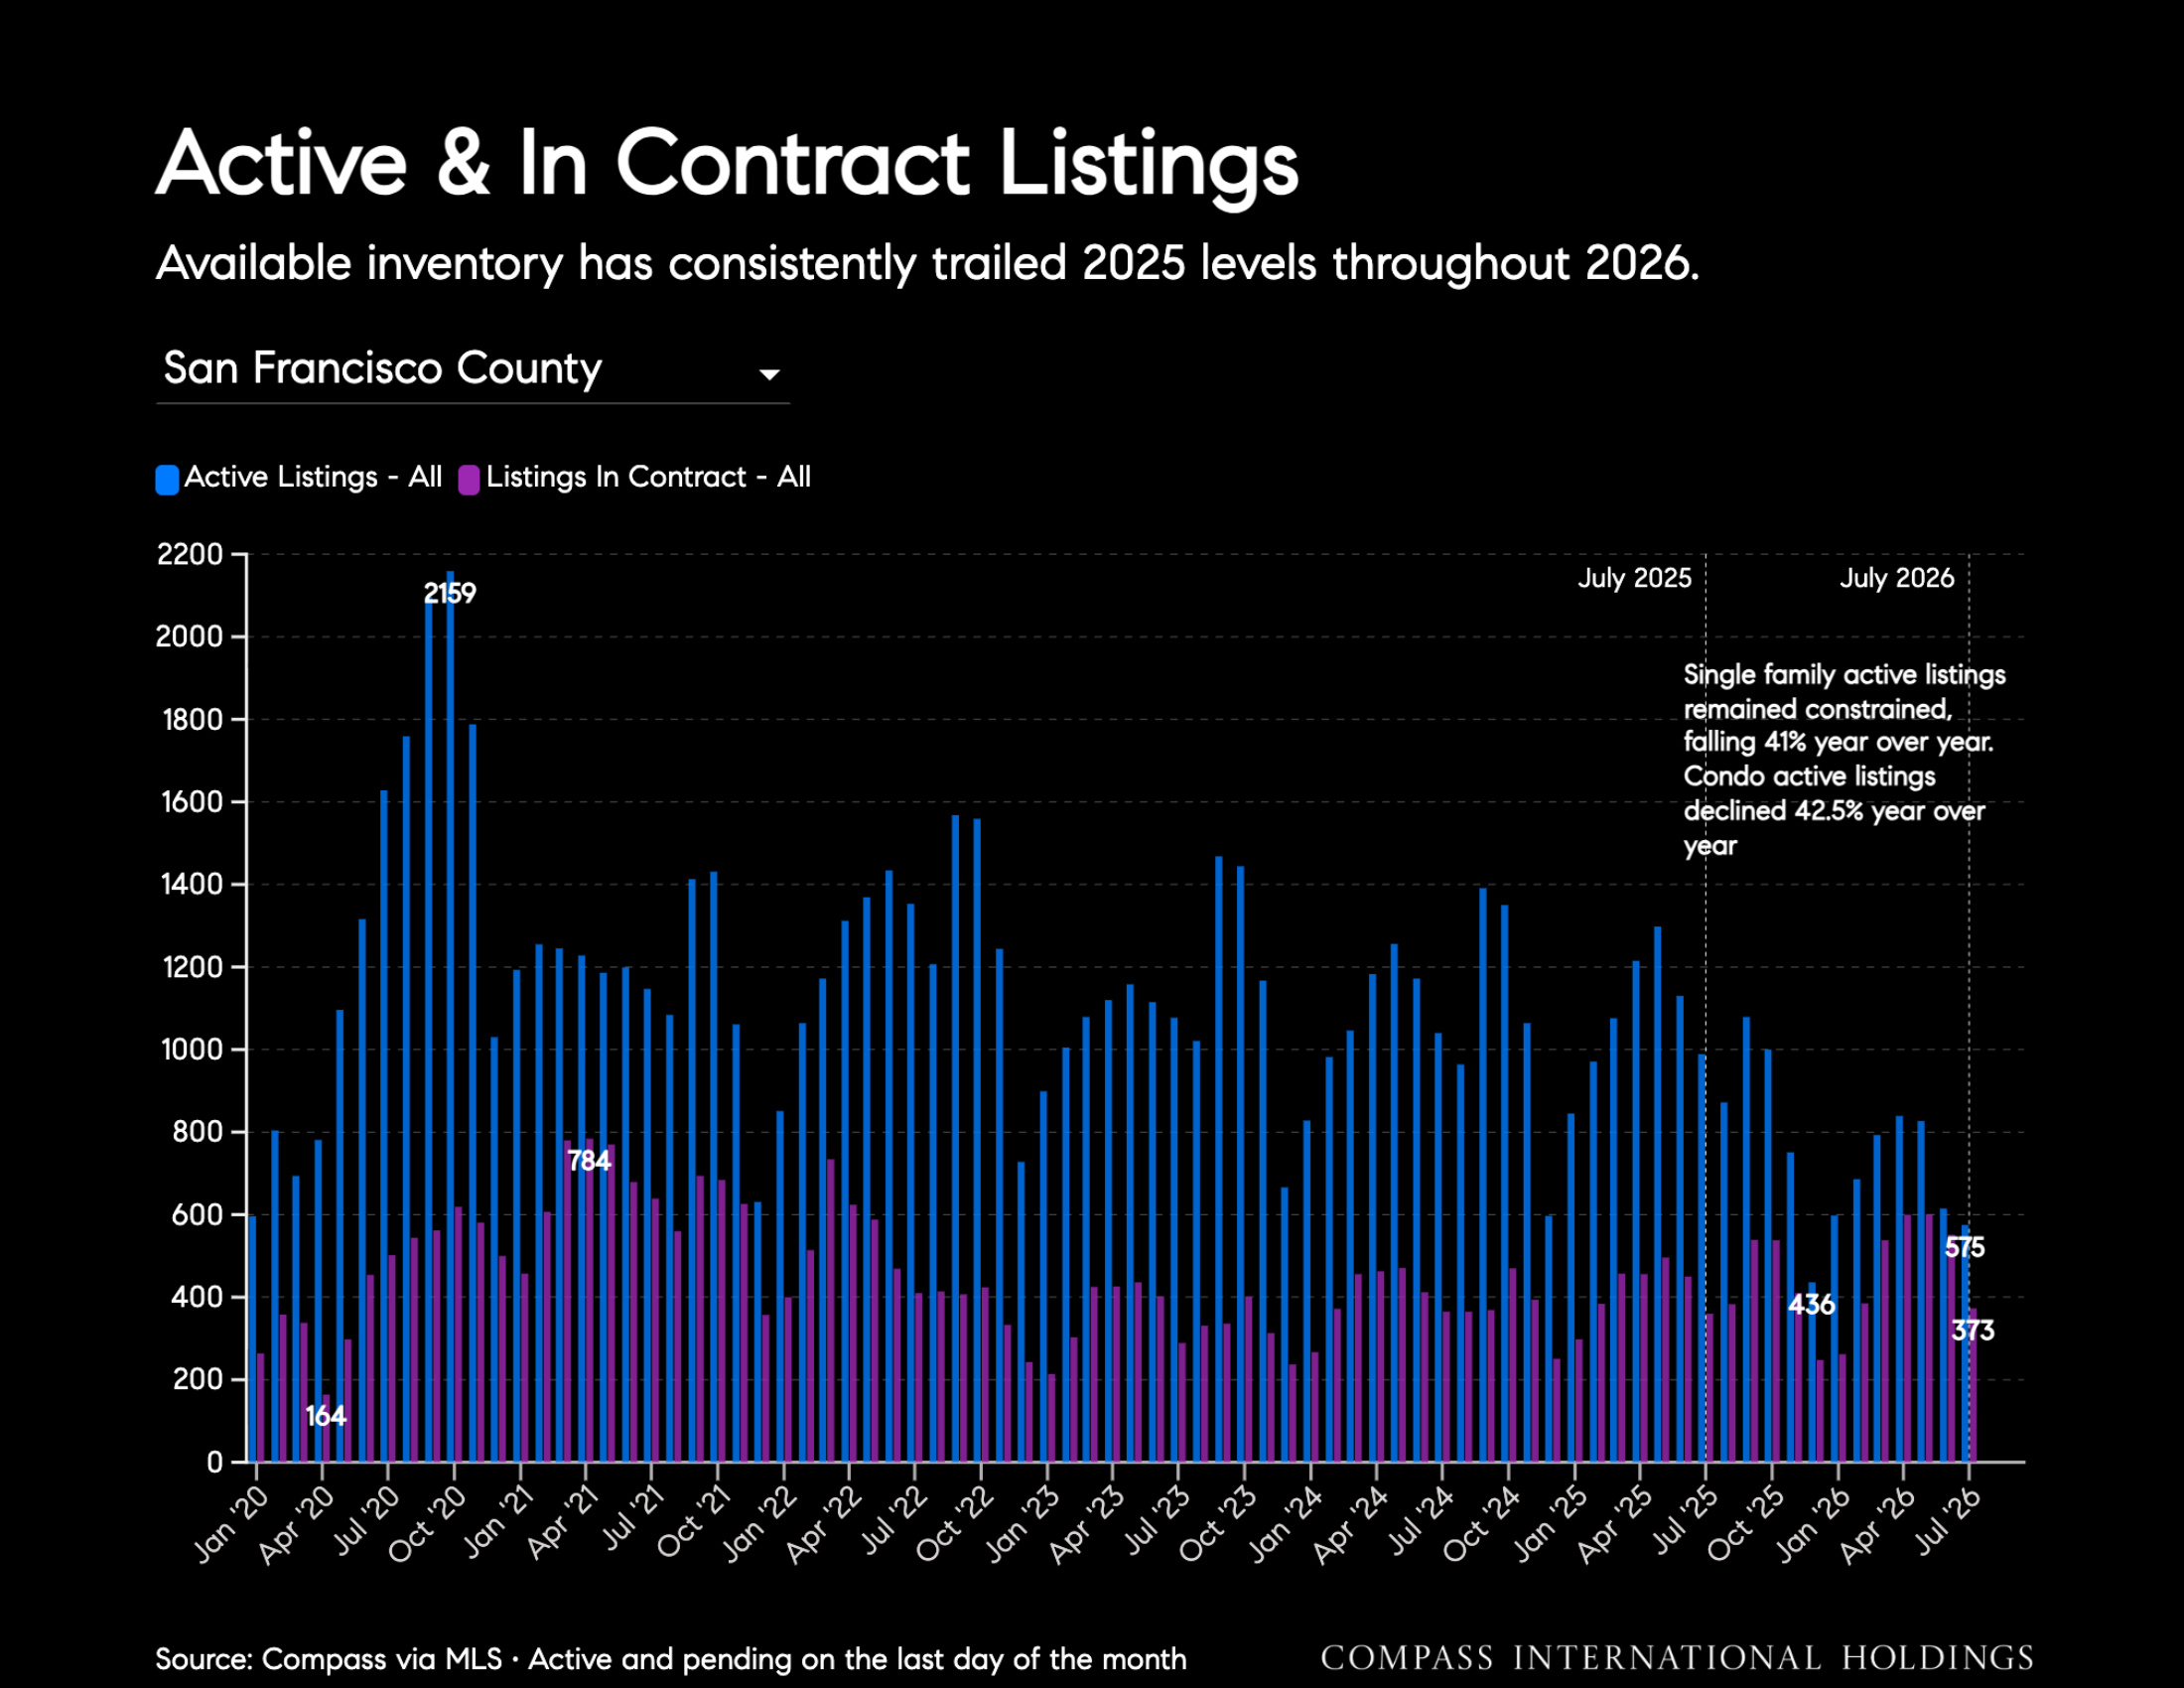
- Inventory remained constrained, falling 40.9% year over year, though it increased 2.6% from last month to 156 active listings.
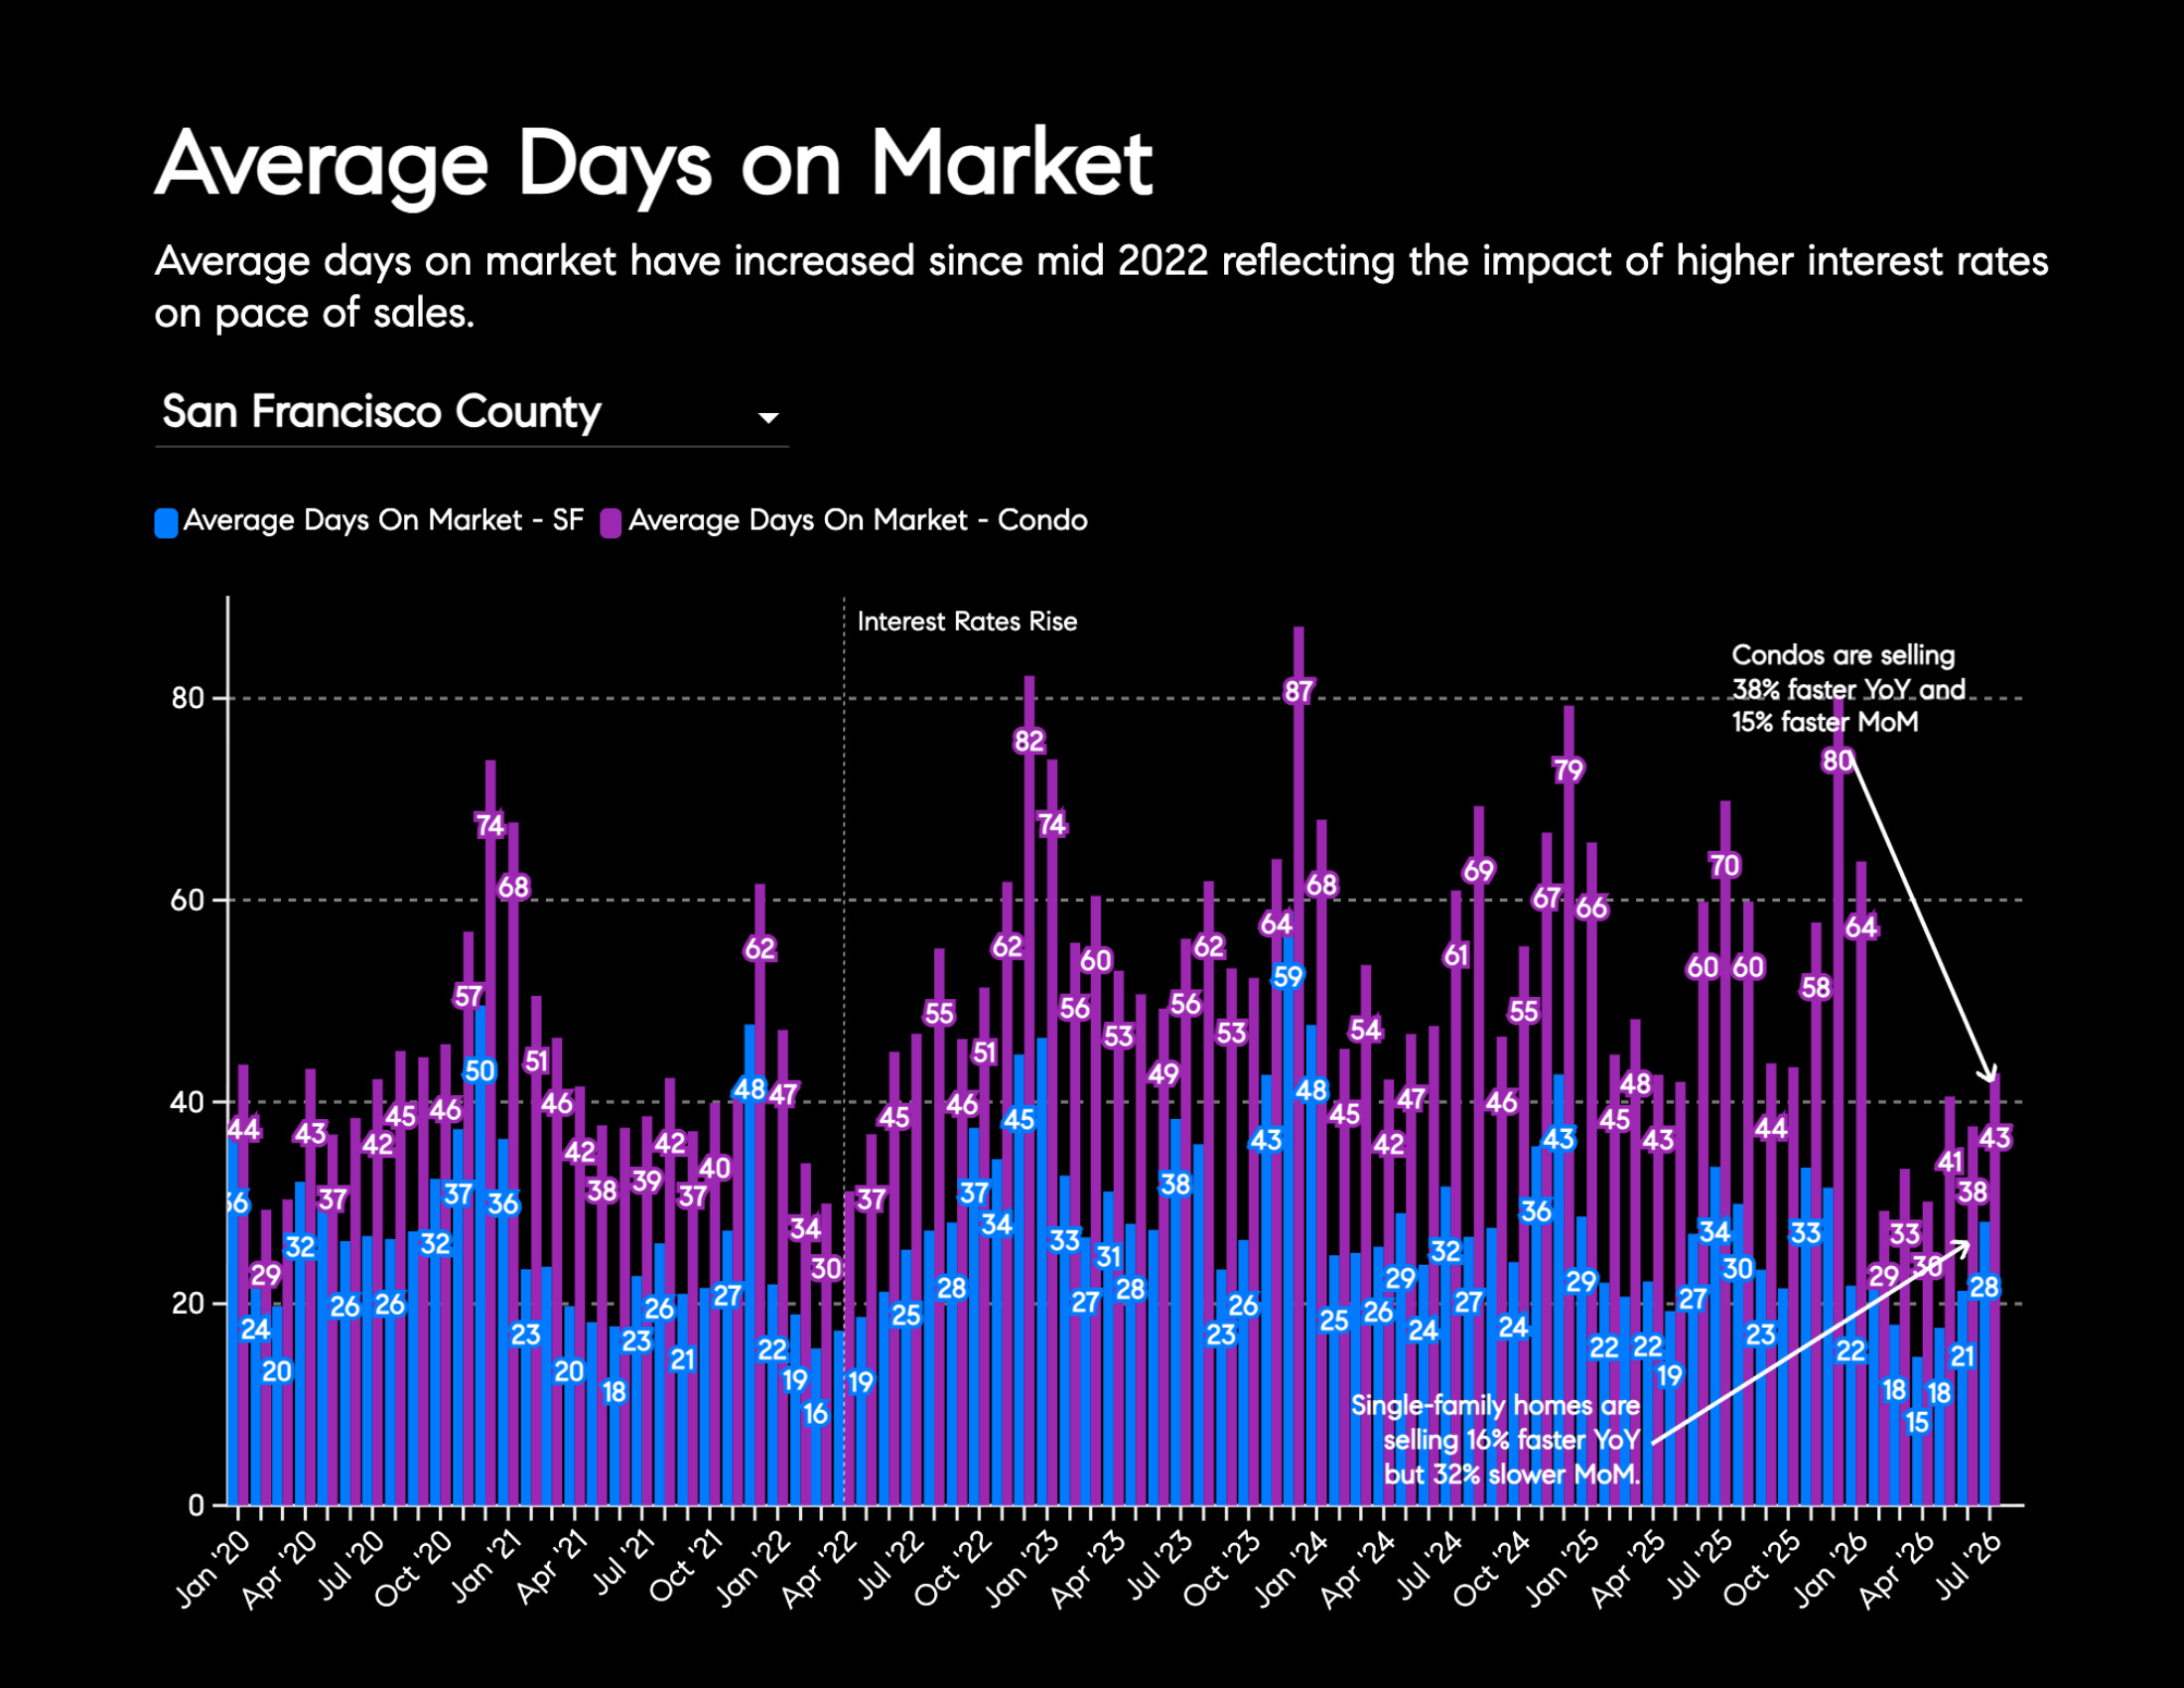
- Average days on market declined 16.2% year over year but increased 32.1% month over month to 28 days.
Condominiums
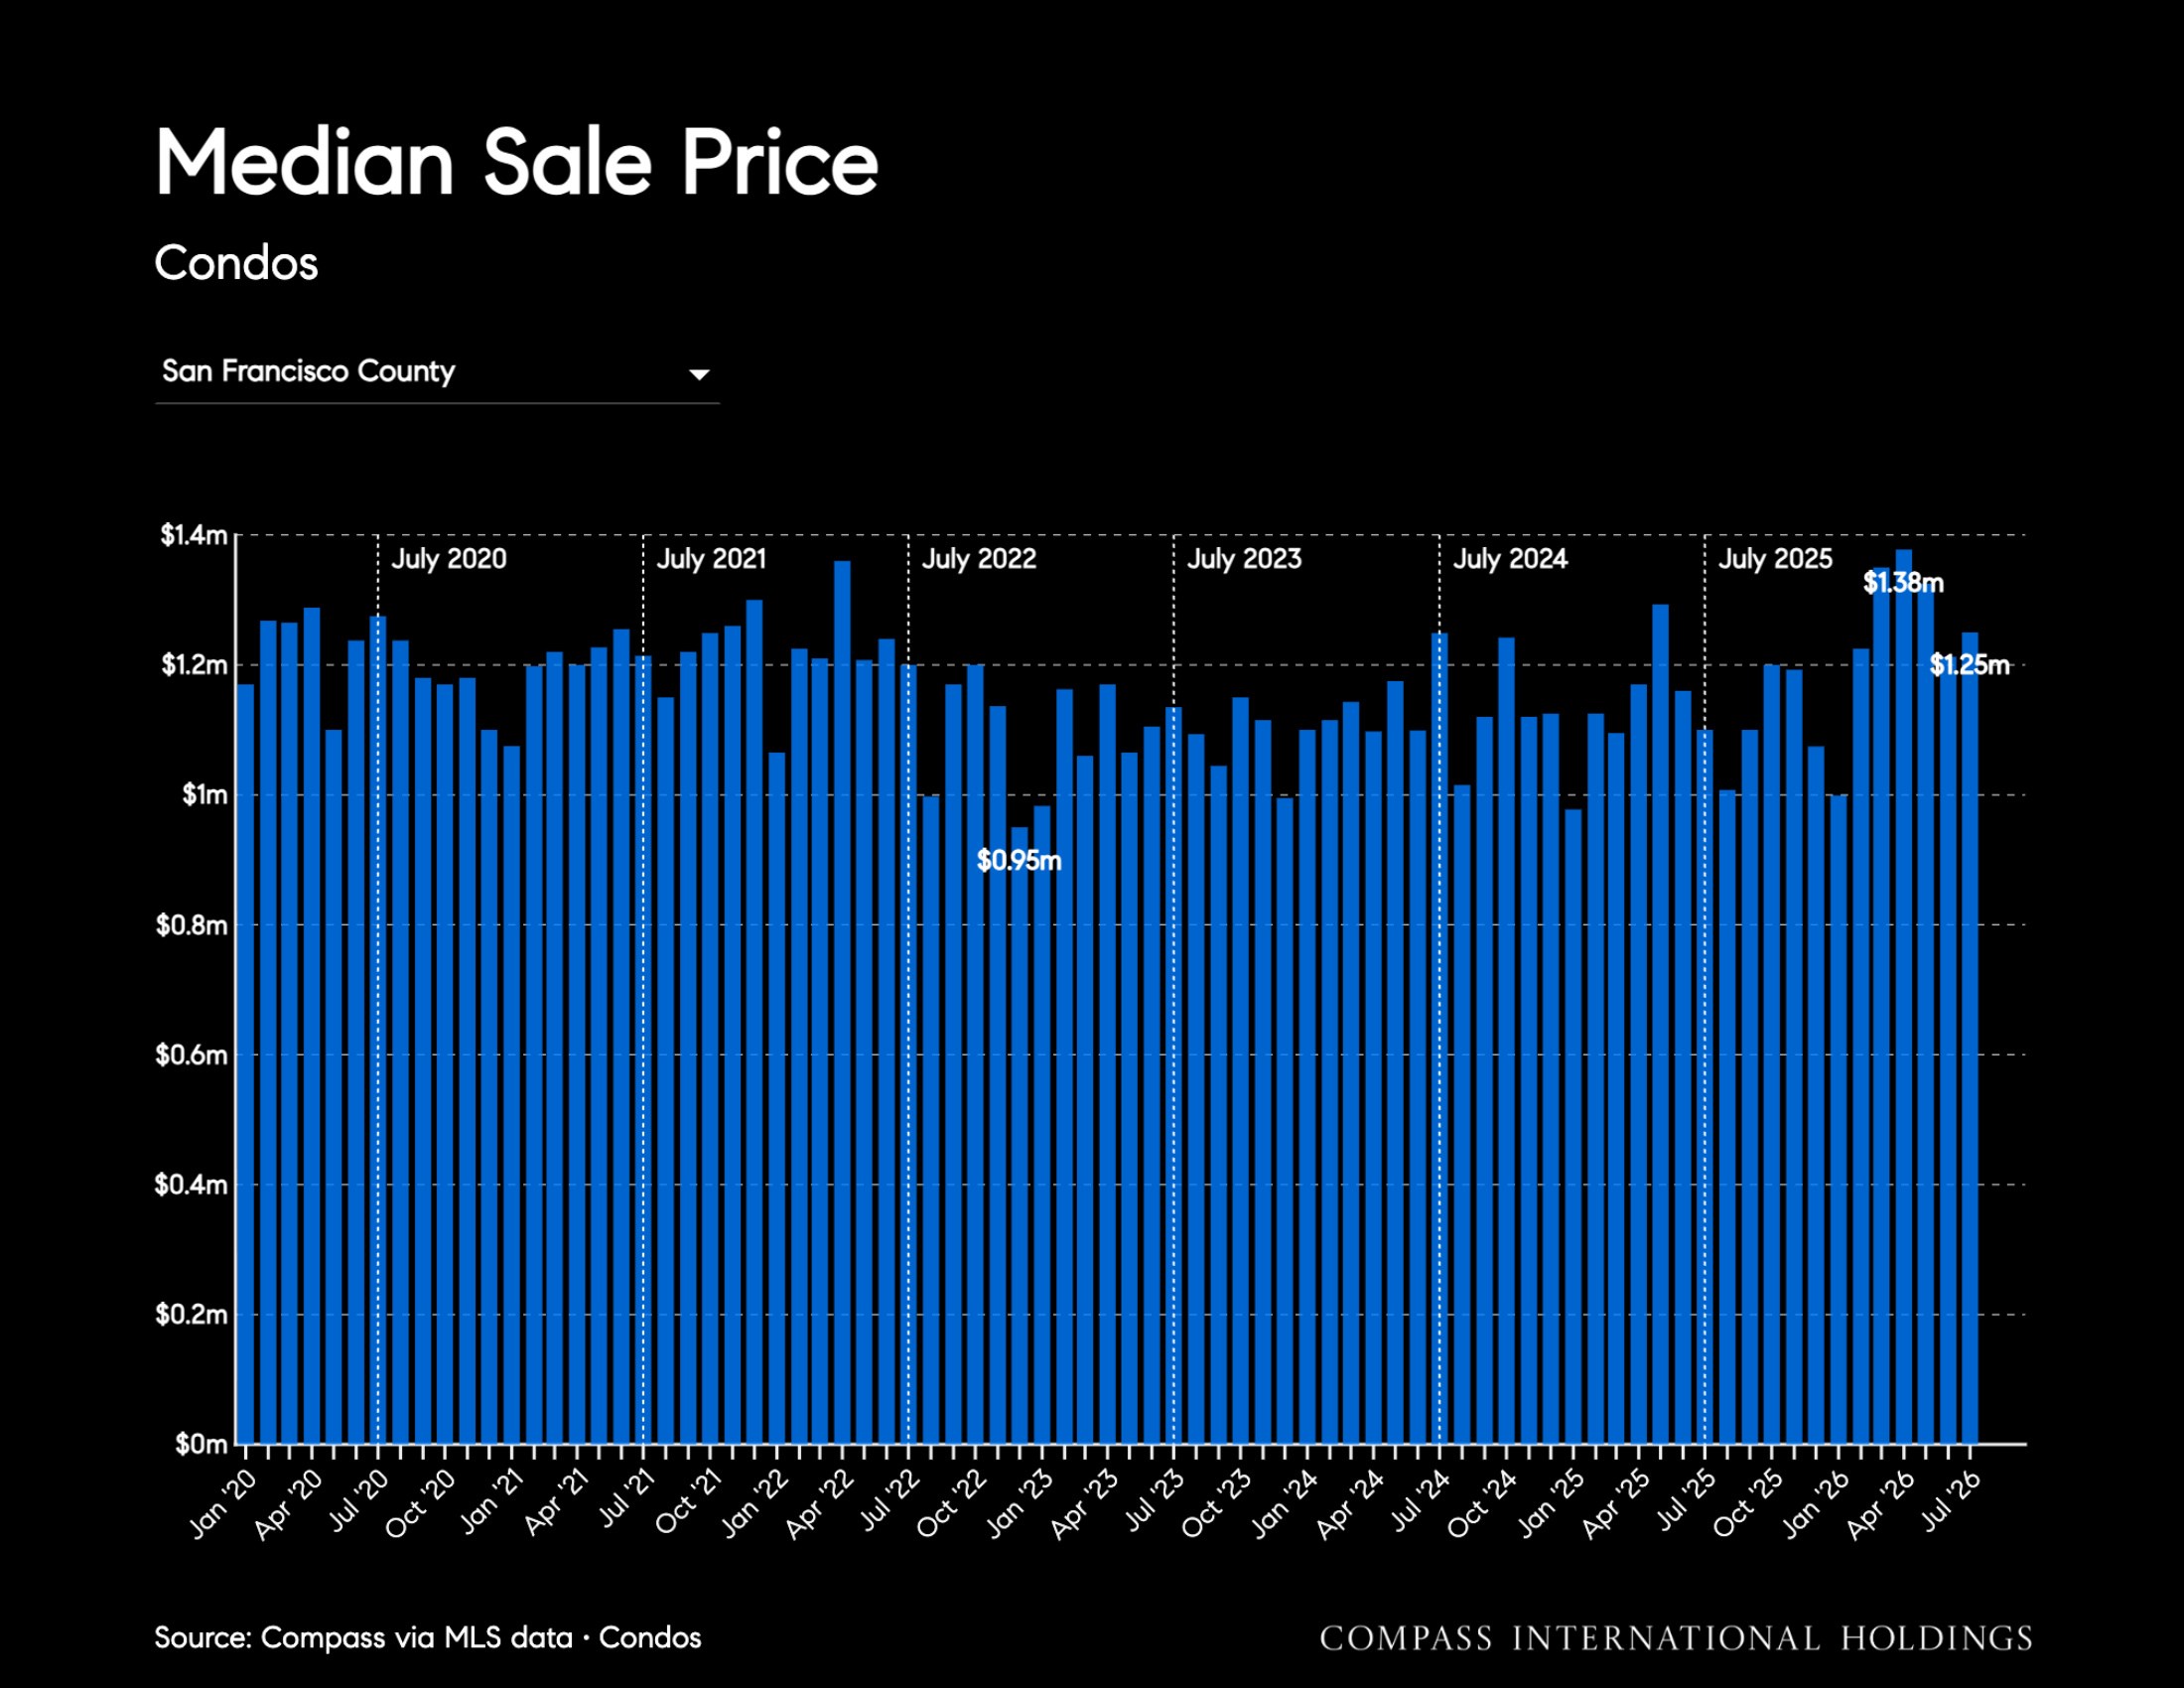
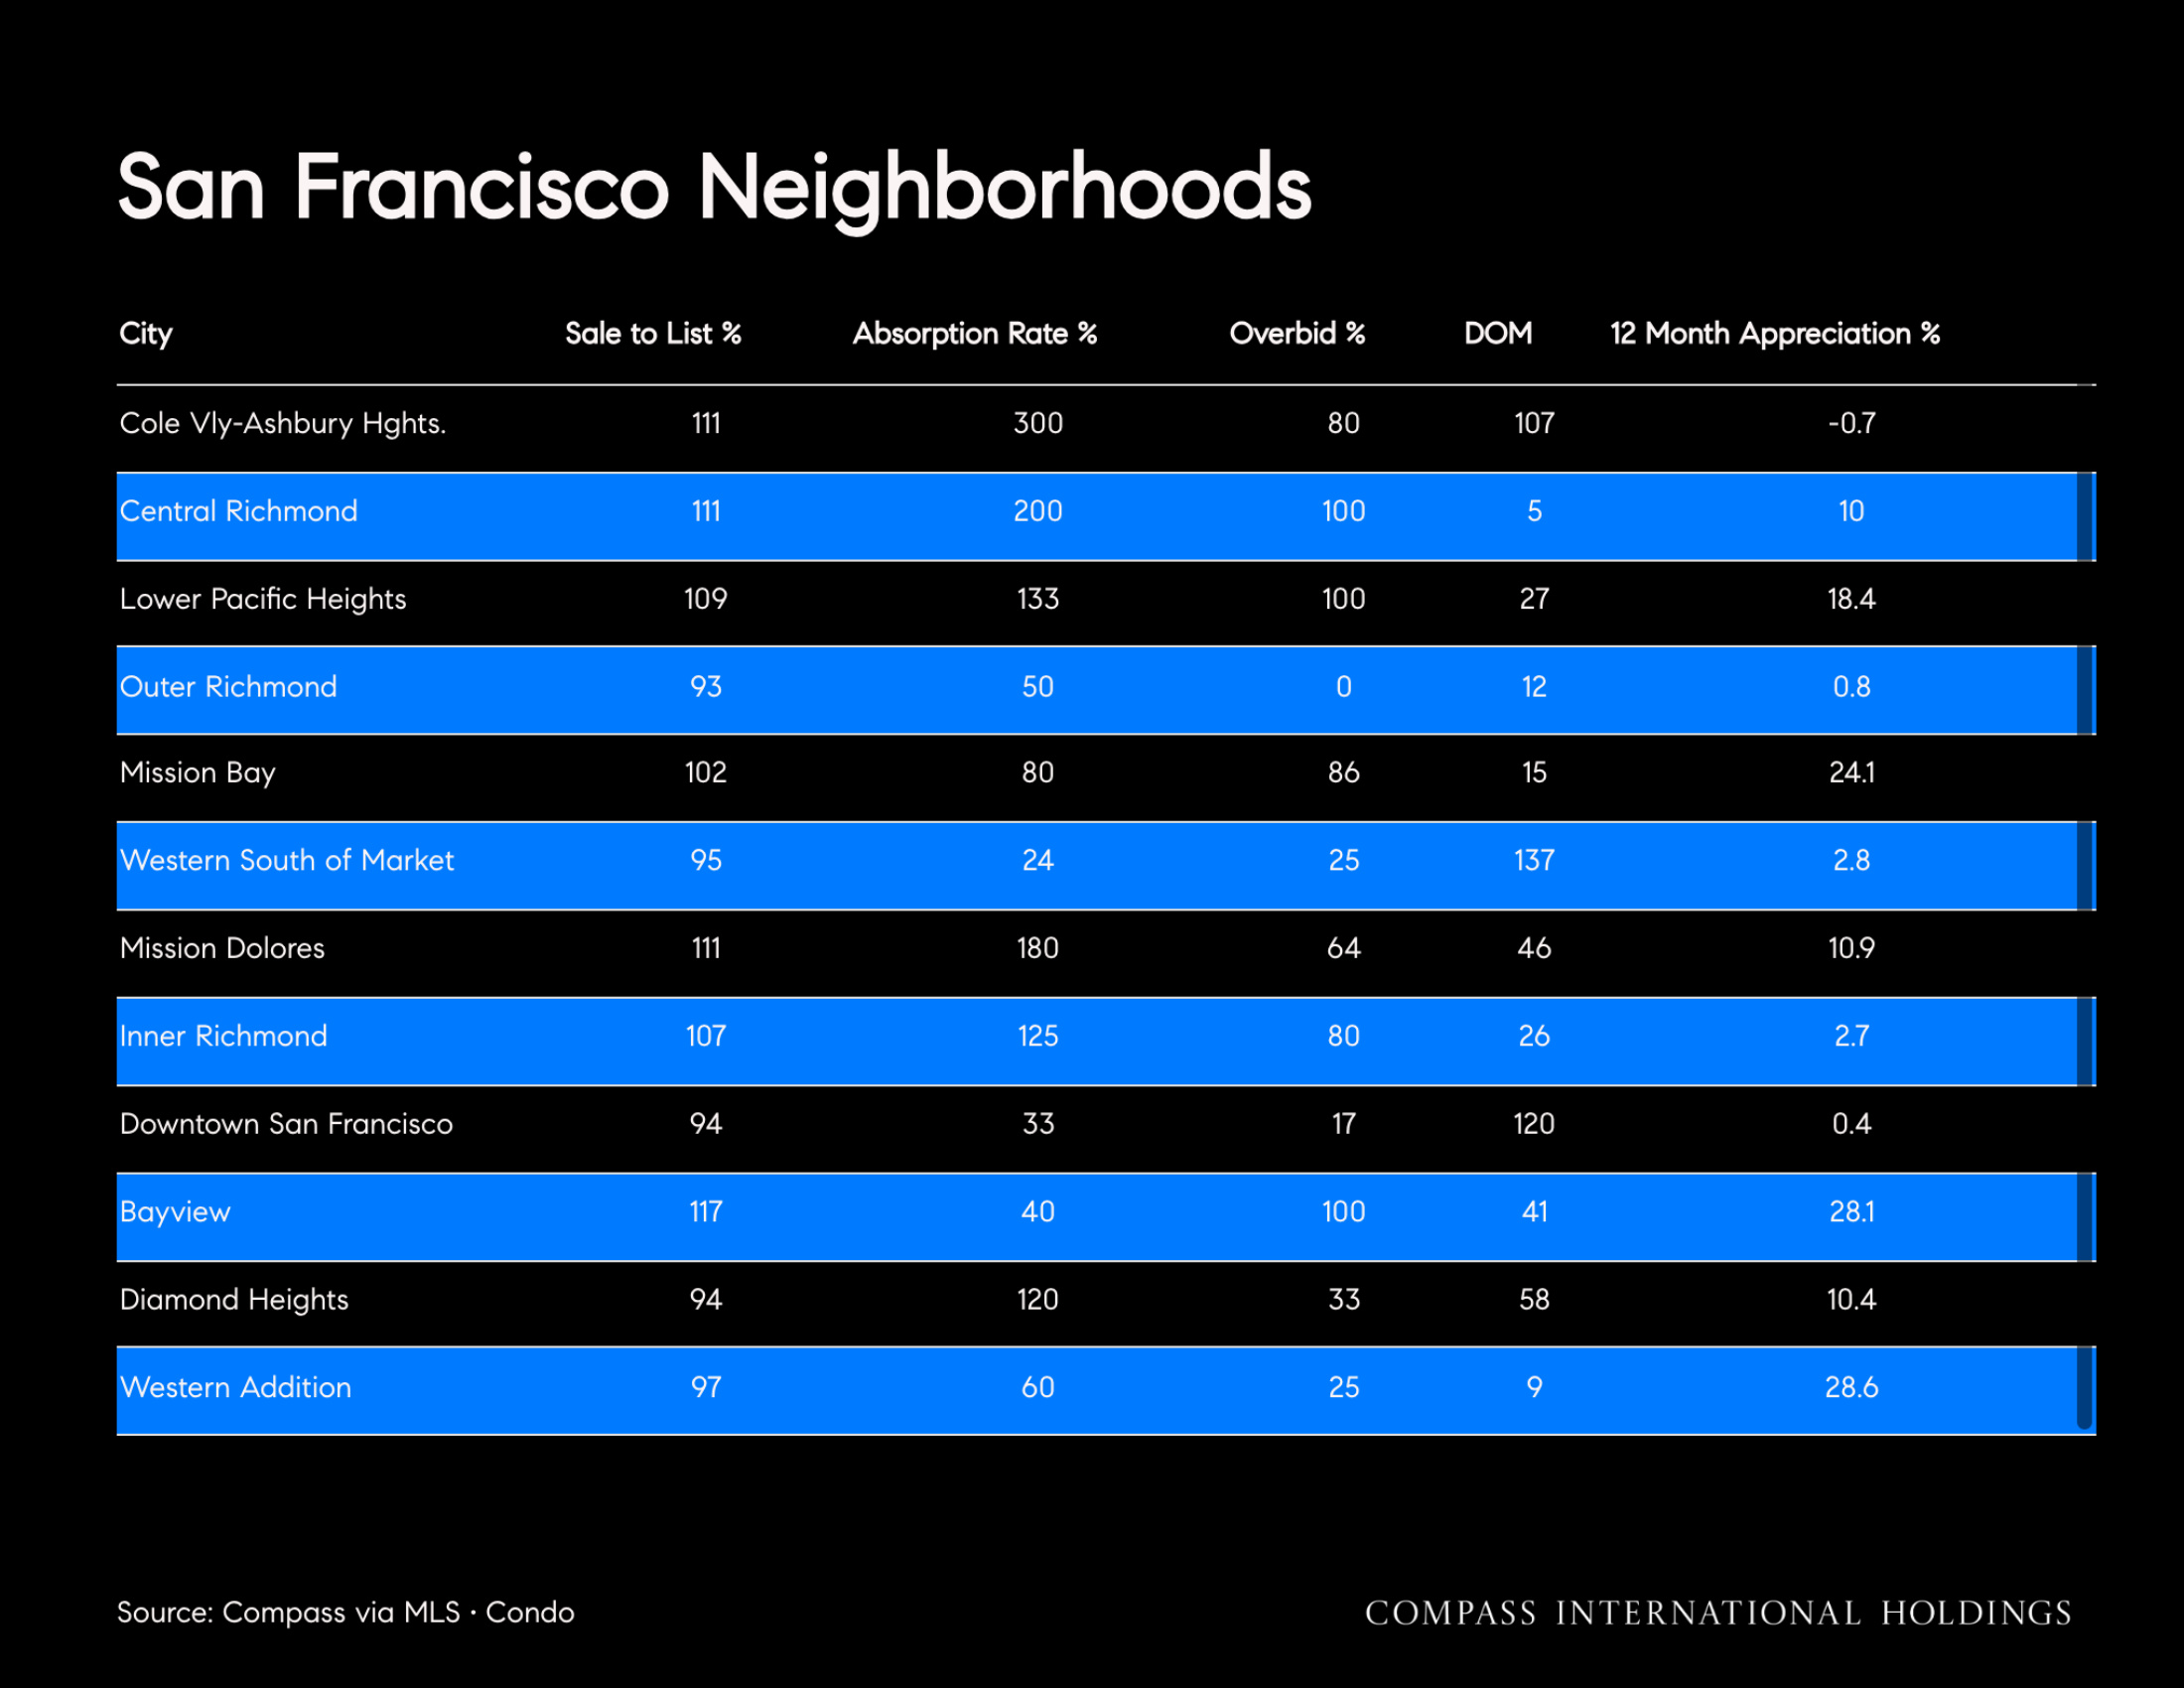
- The median condo sale price increased 13.6% year over year and 3.1% month over month to $1.25 million.
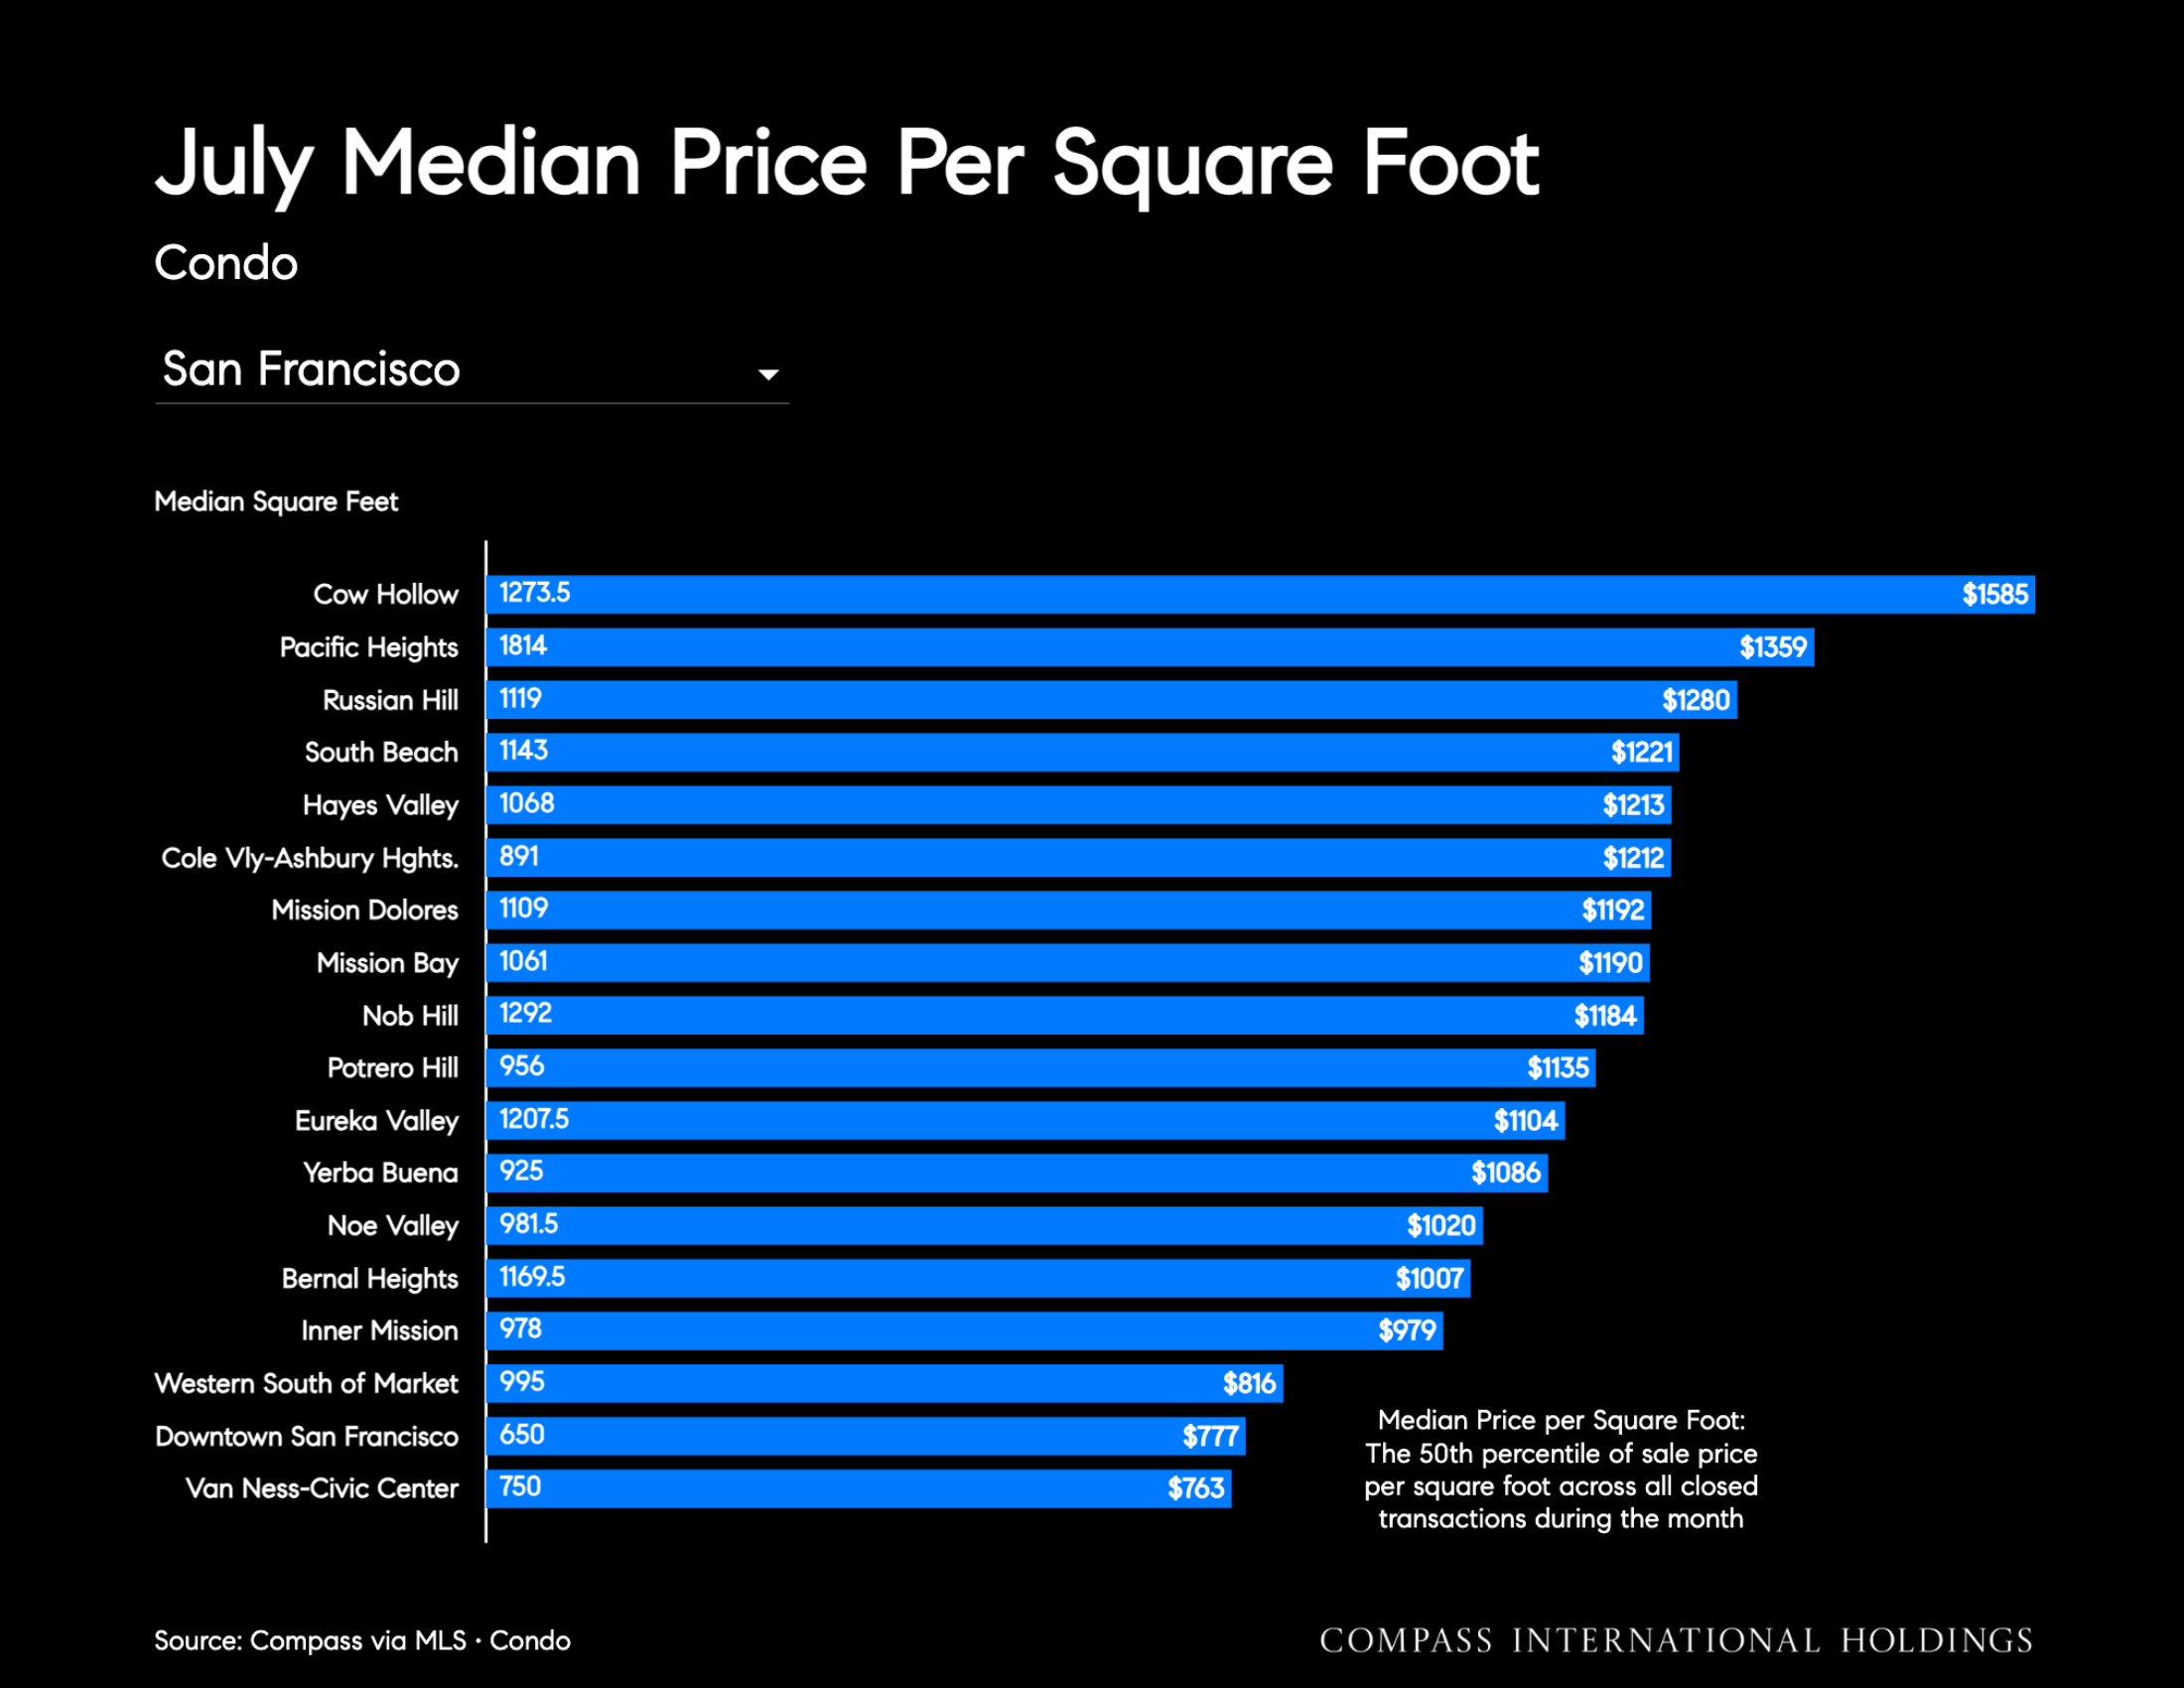
- Median price per square foot rose 13.1% year over year to $1,103 but fell 2.1% month over month.
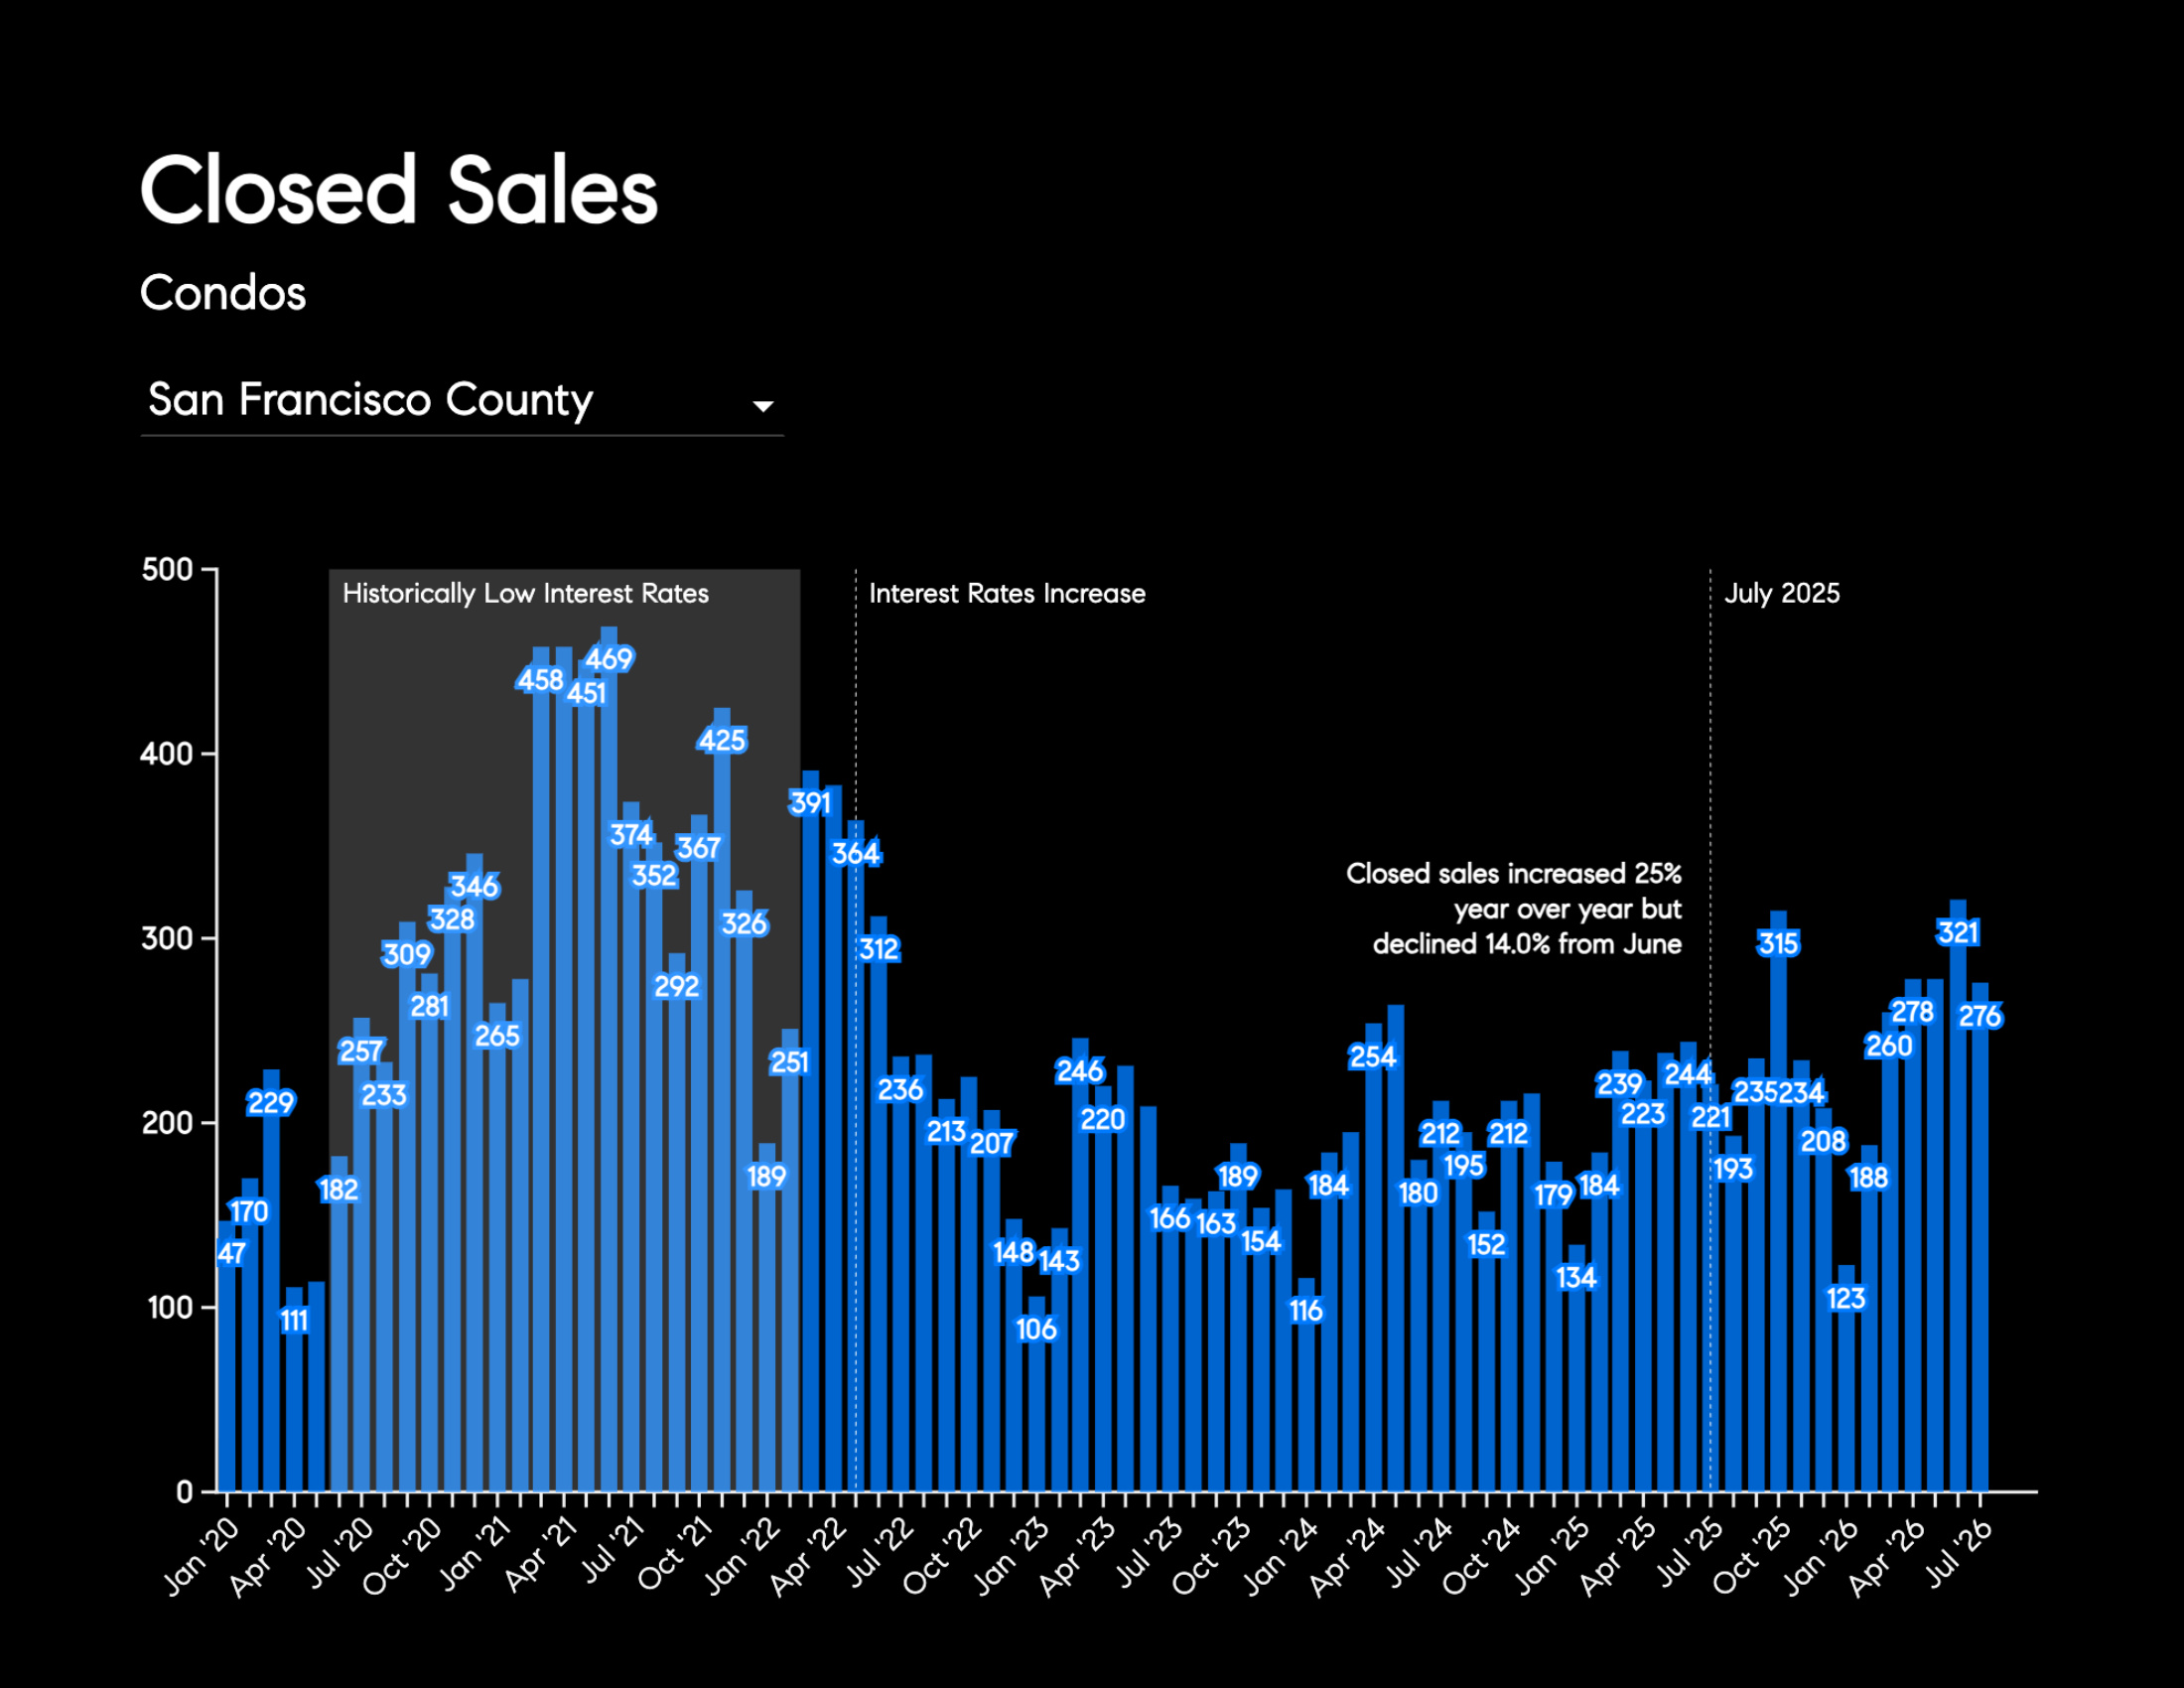
- Closed sales increased 24.9% year over year but declined 14.0% from June to 276 transactions, while pending sales rose 15.7% year over year and fell 32.6% month over month to 221.
- Inventory declined 42.5% year over year and 9.9% month over month to 417 listings.
- Average days on market fell 38.0% year over year but rose 15.3% month over month to 43.3 days.
Want to learn more about Bay Area market trends?
Let’s connect! With relationships and networks across the city, there are a variety of ways I can help you make informed real estate decisions. Call, email, or text – I’m here to help.
Contact