December 13, 2024
SF: December 2024 Market Stats
By Compass
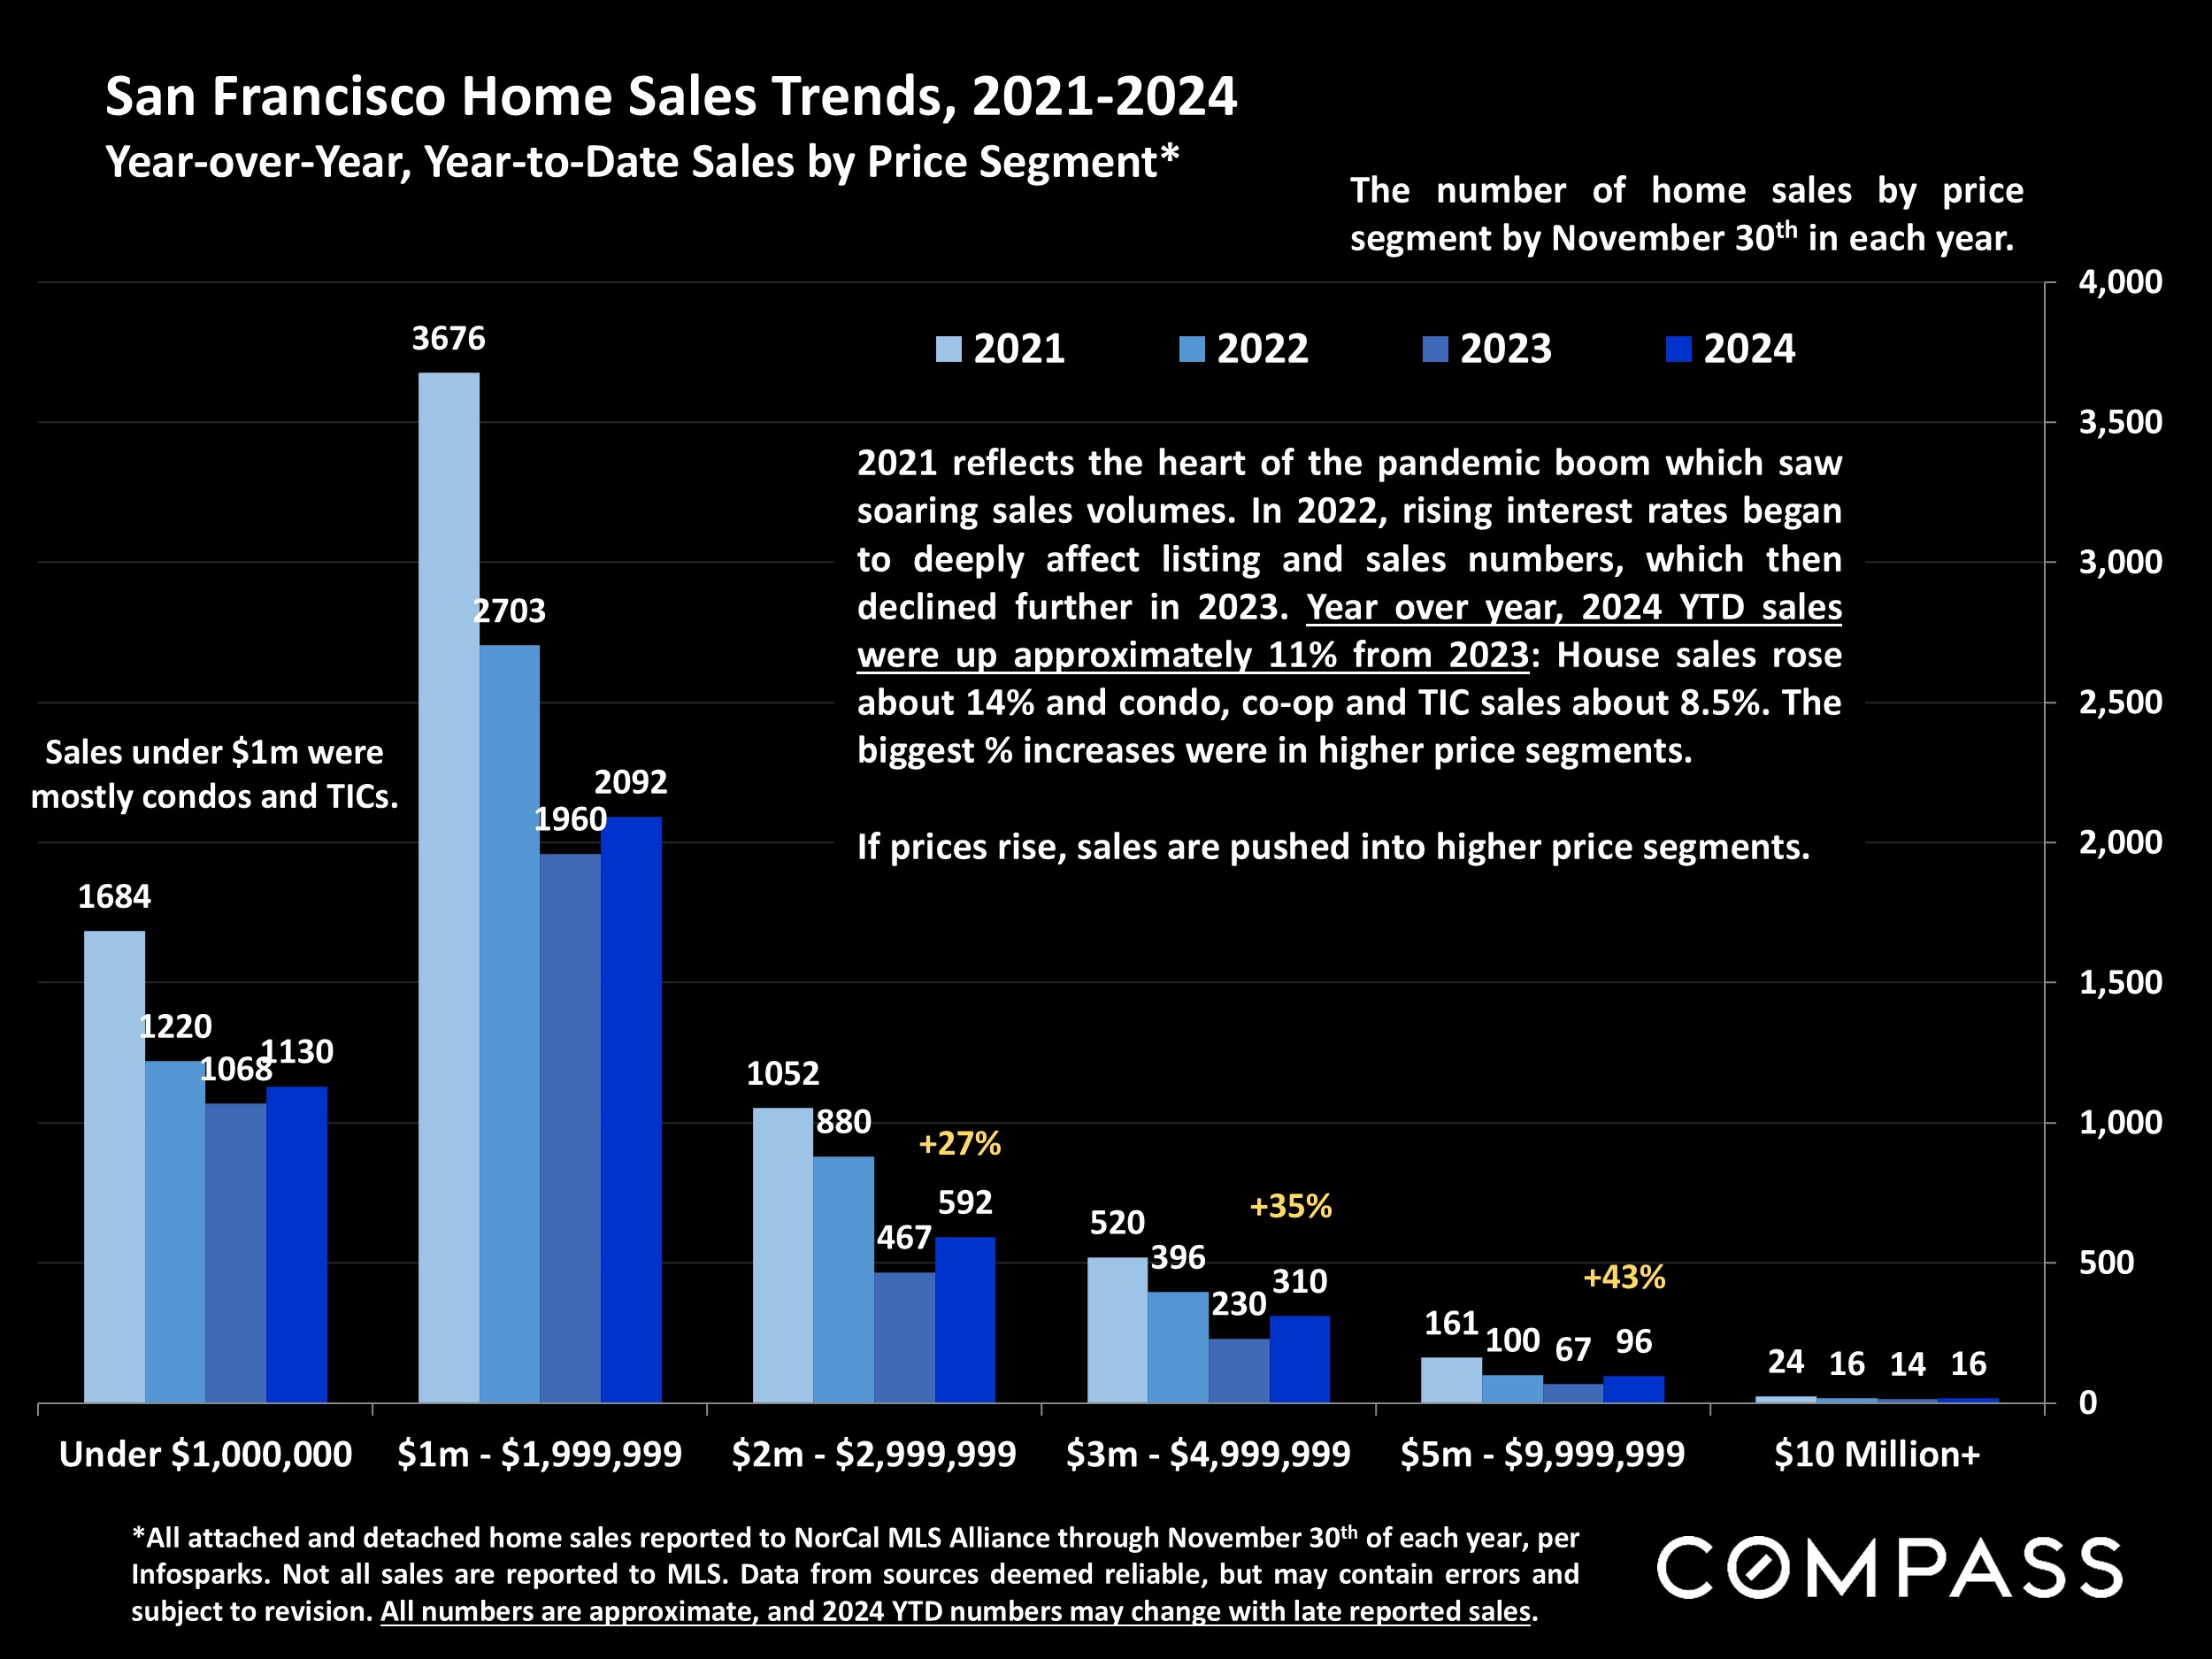
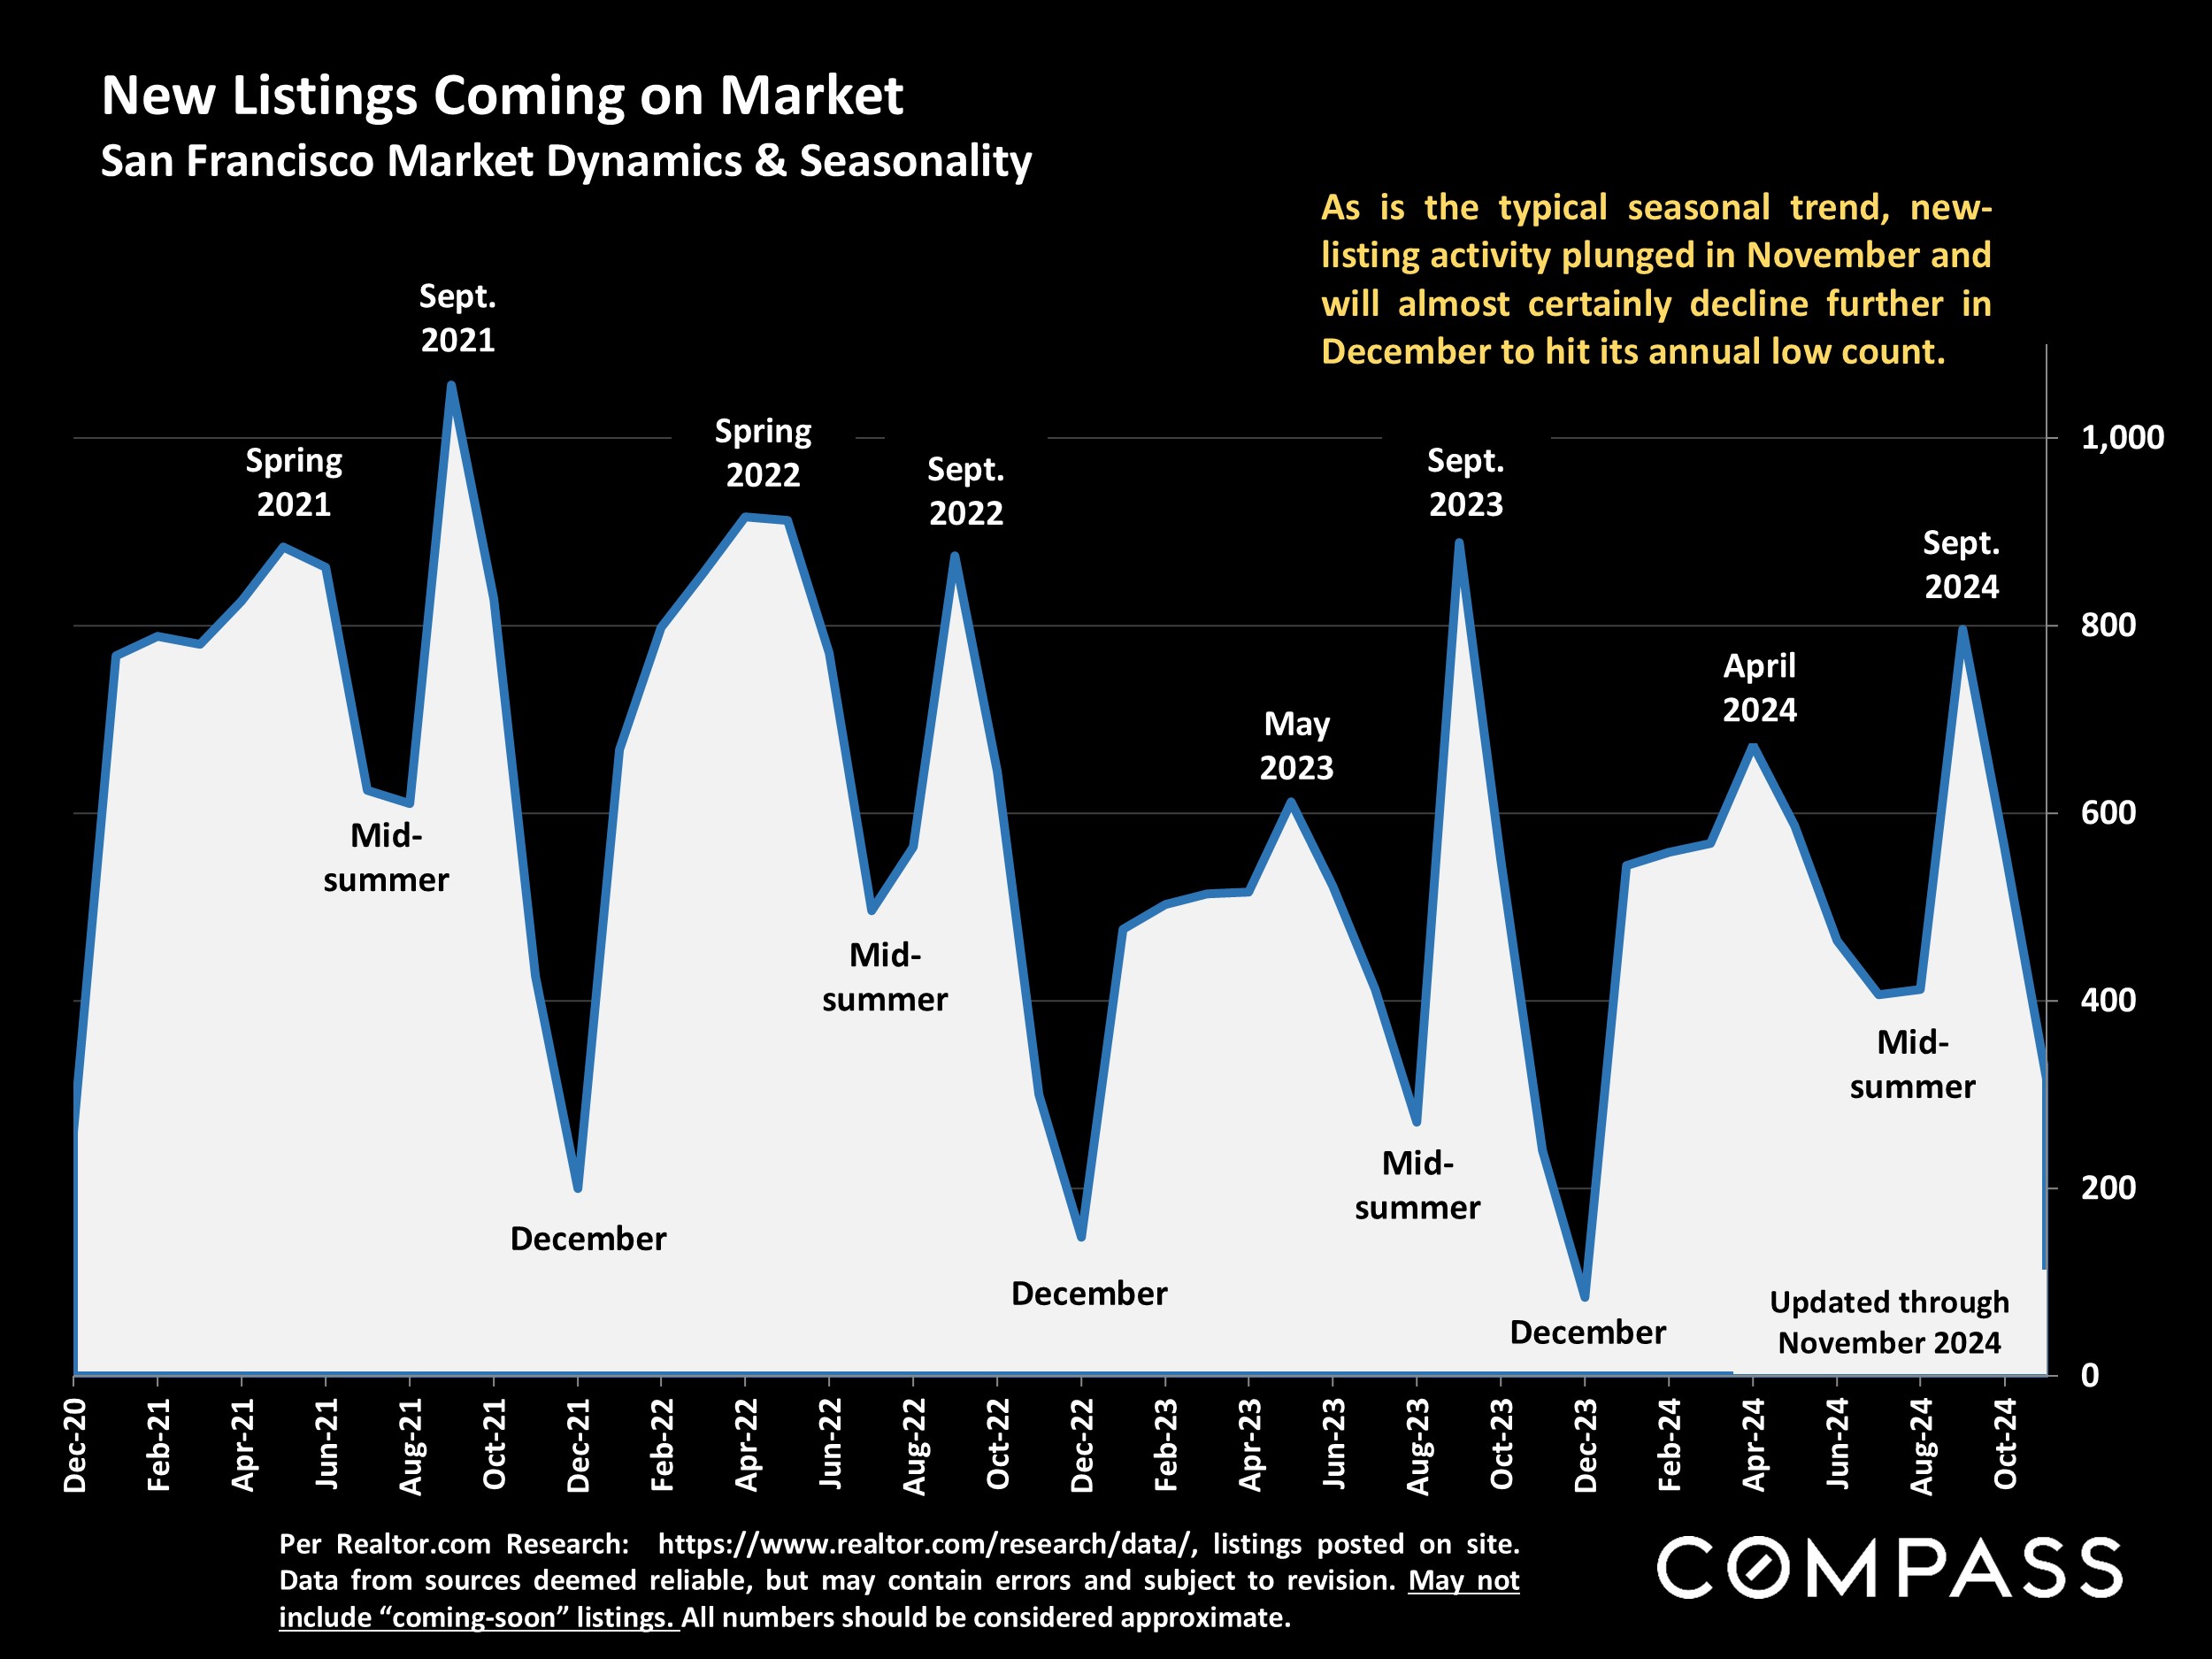
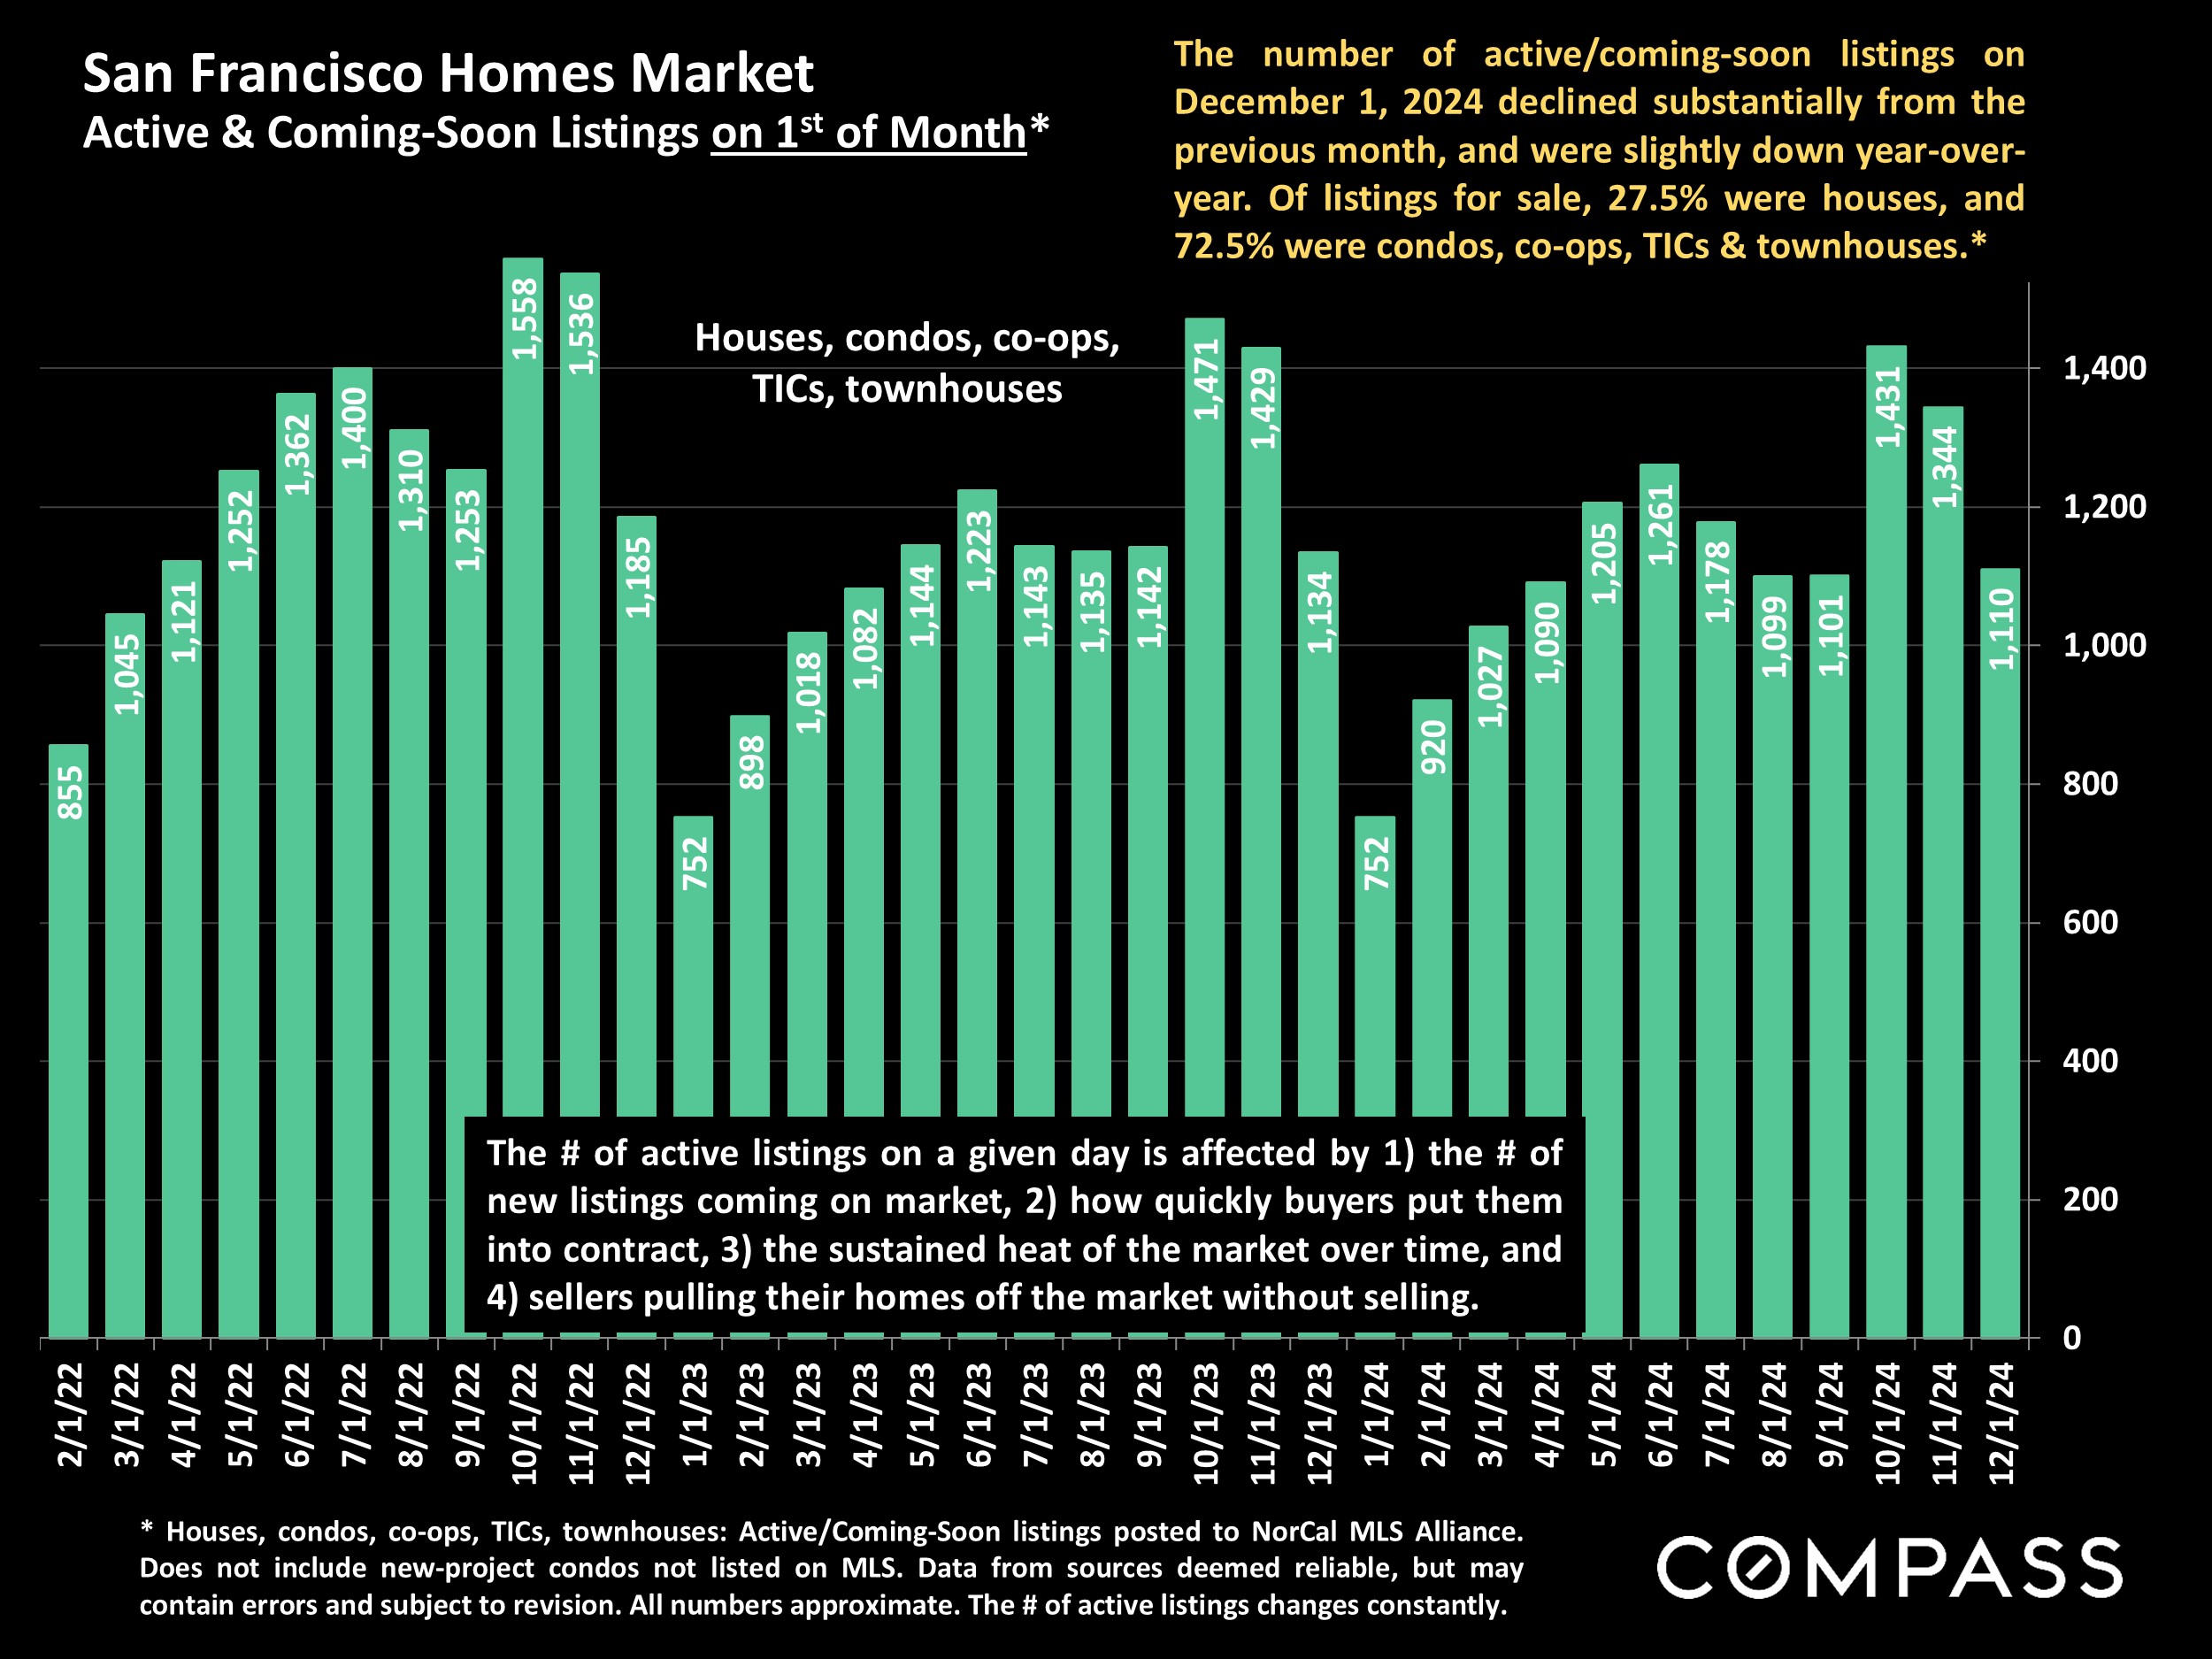
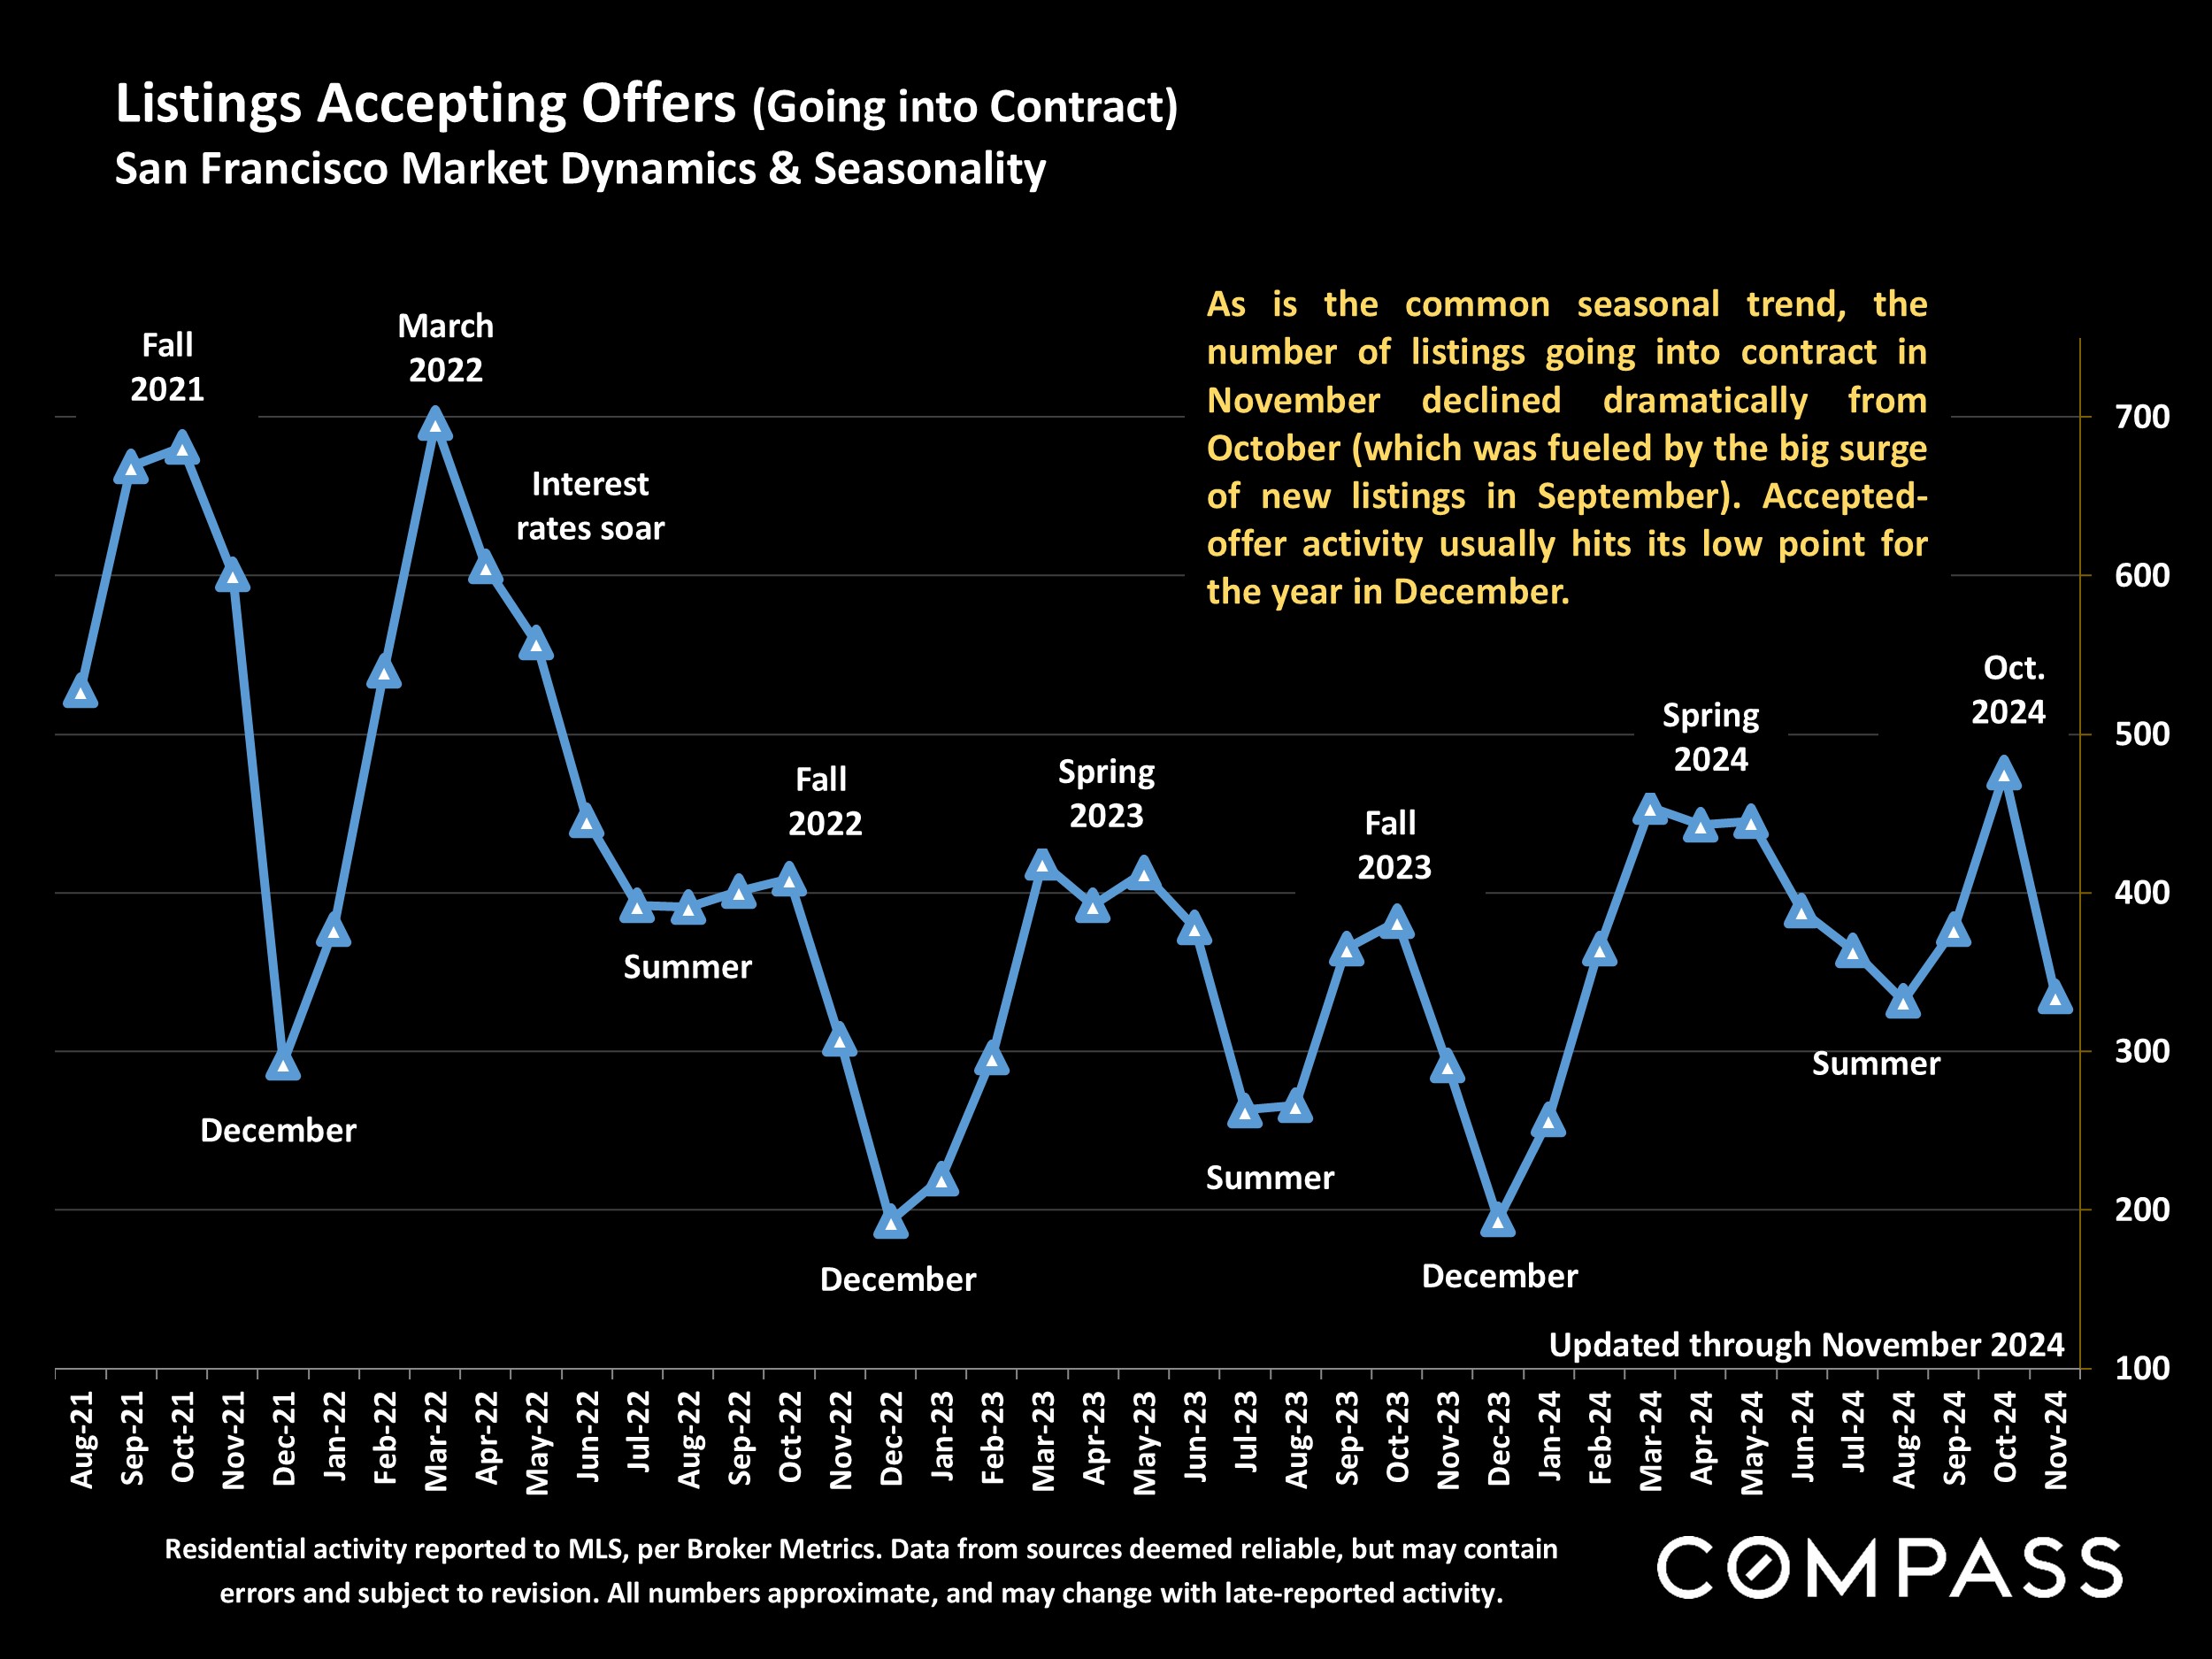
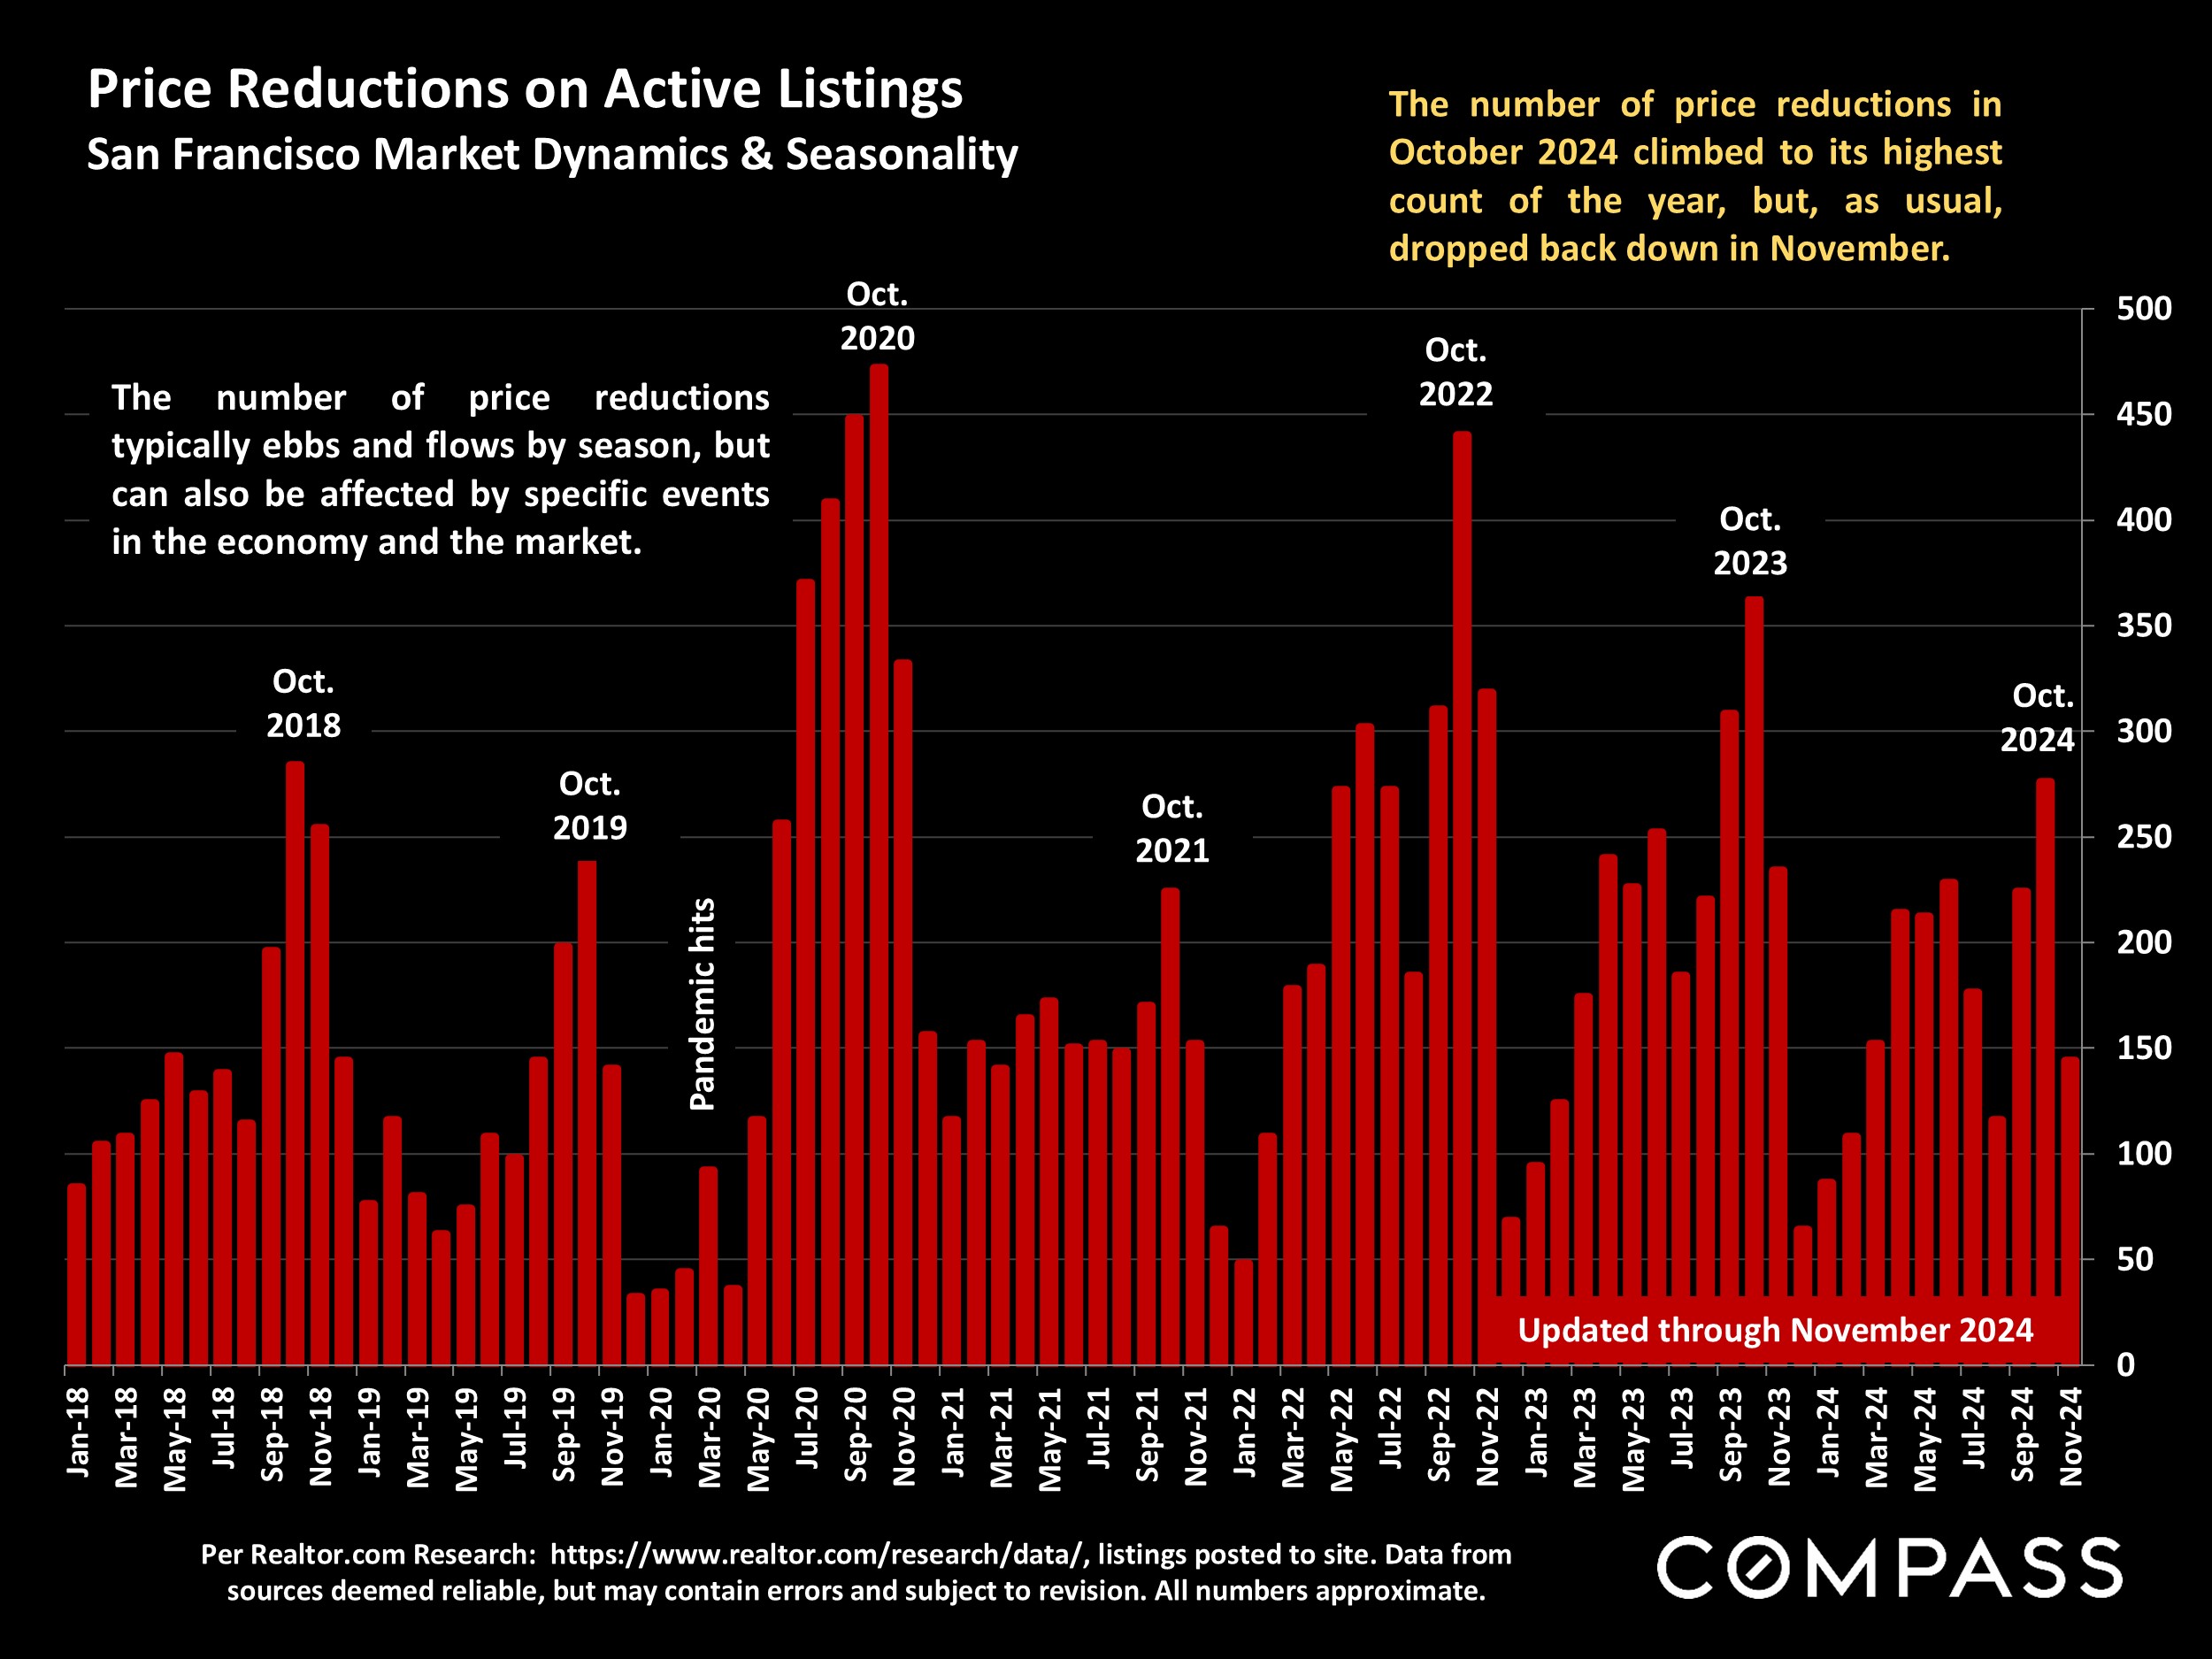
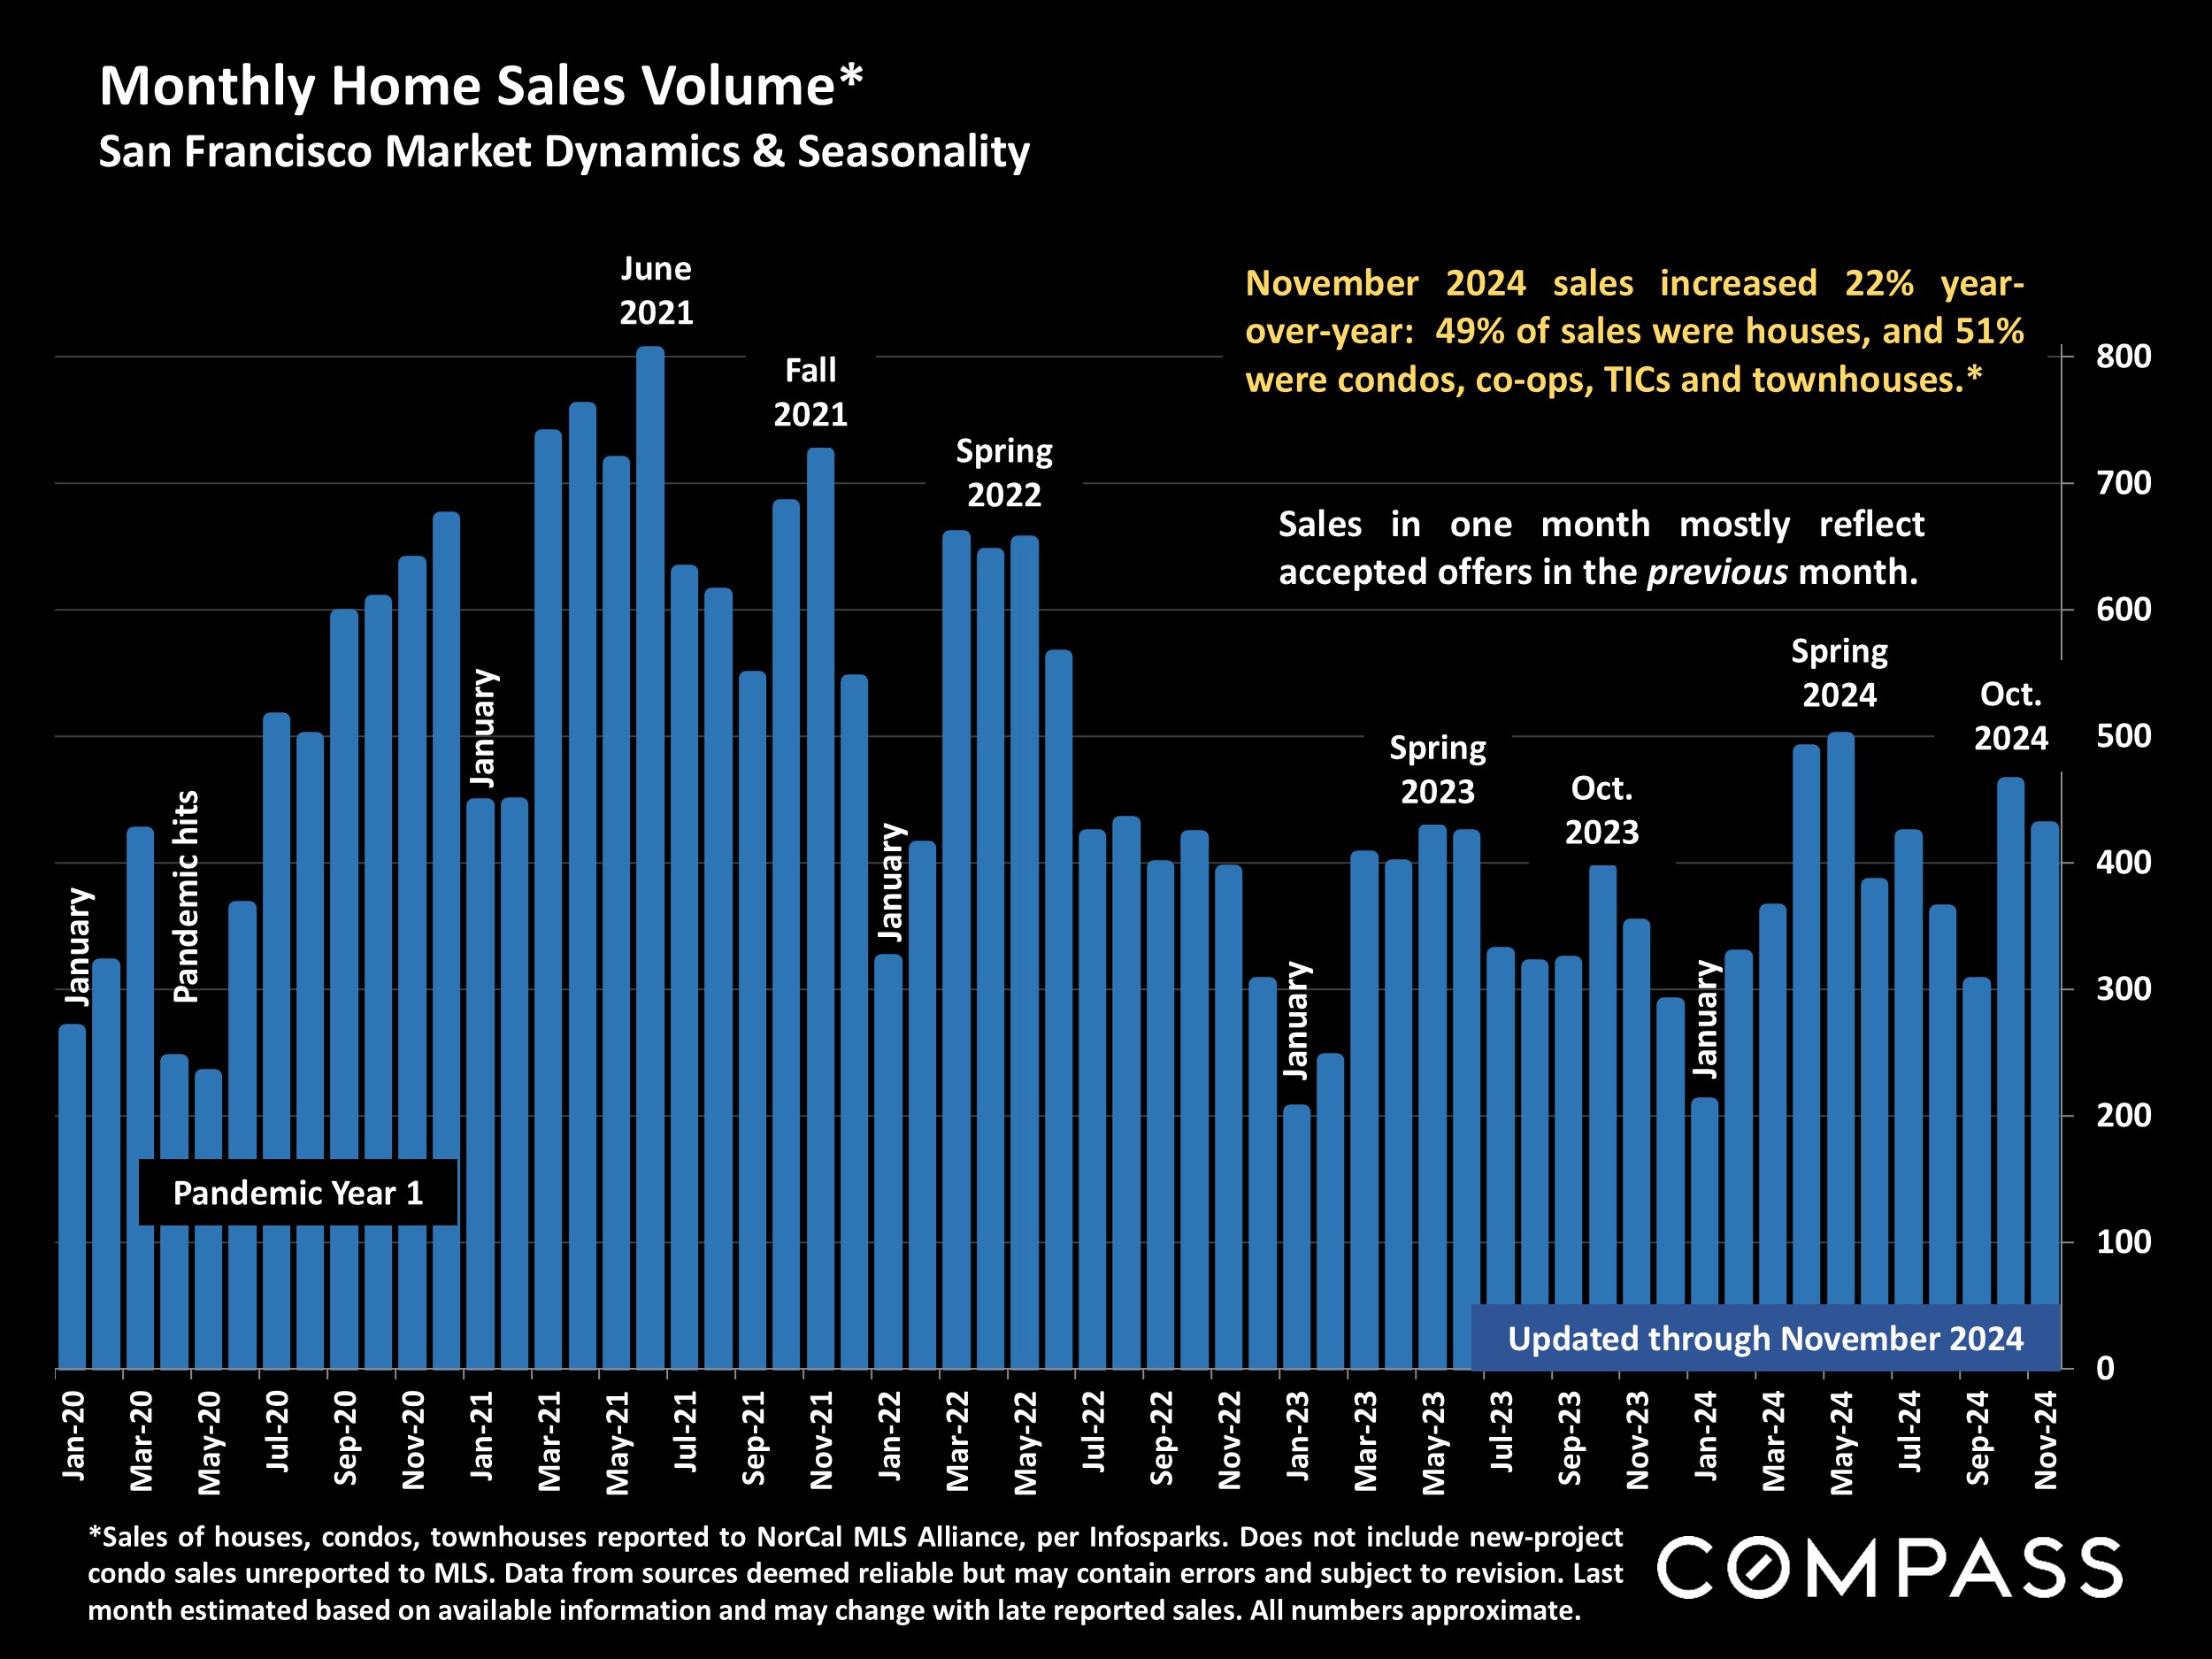
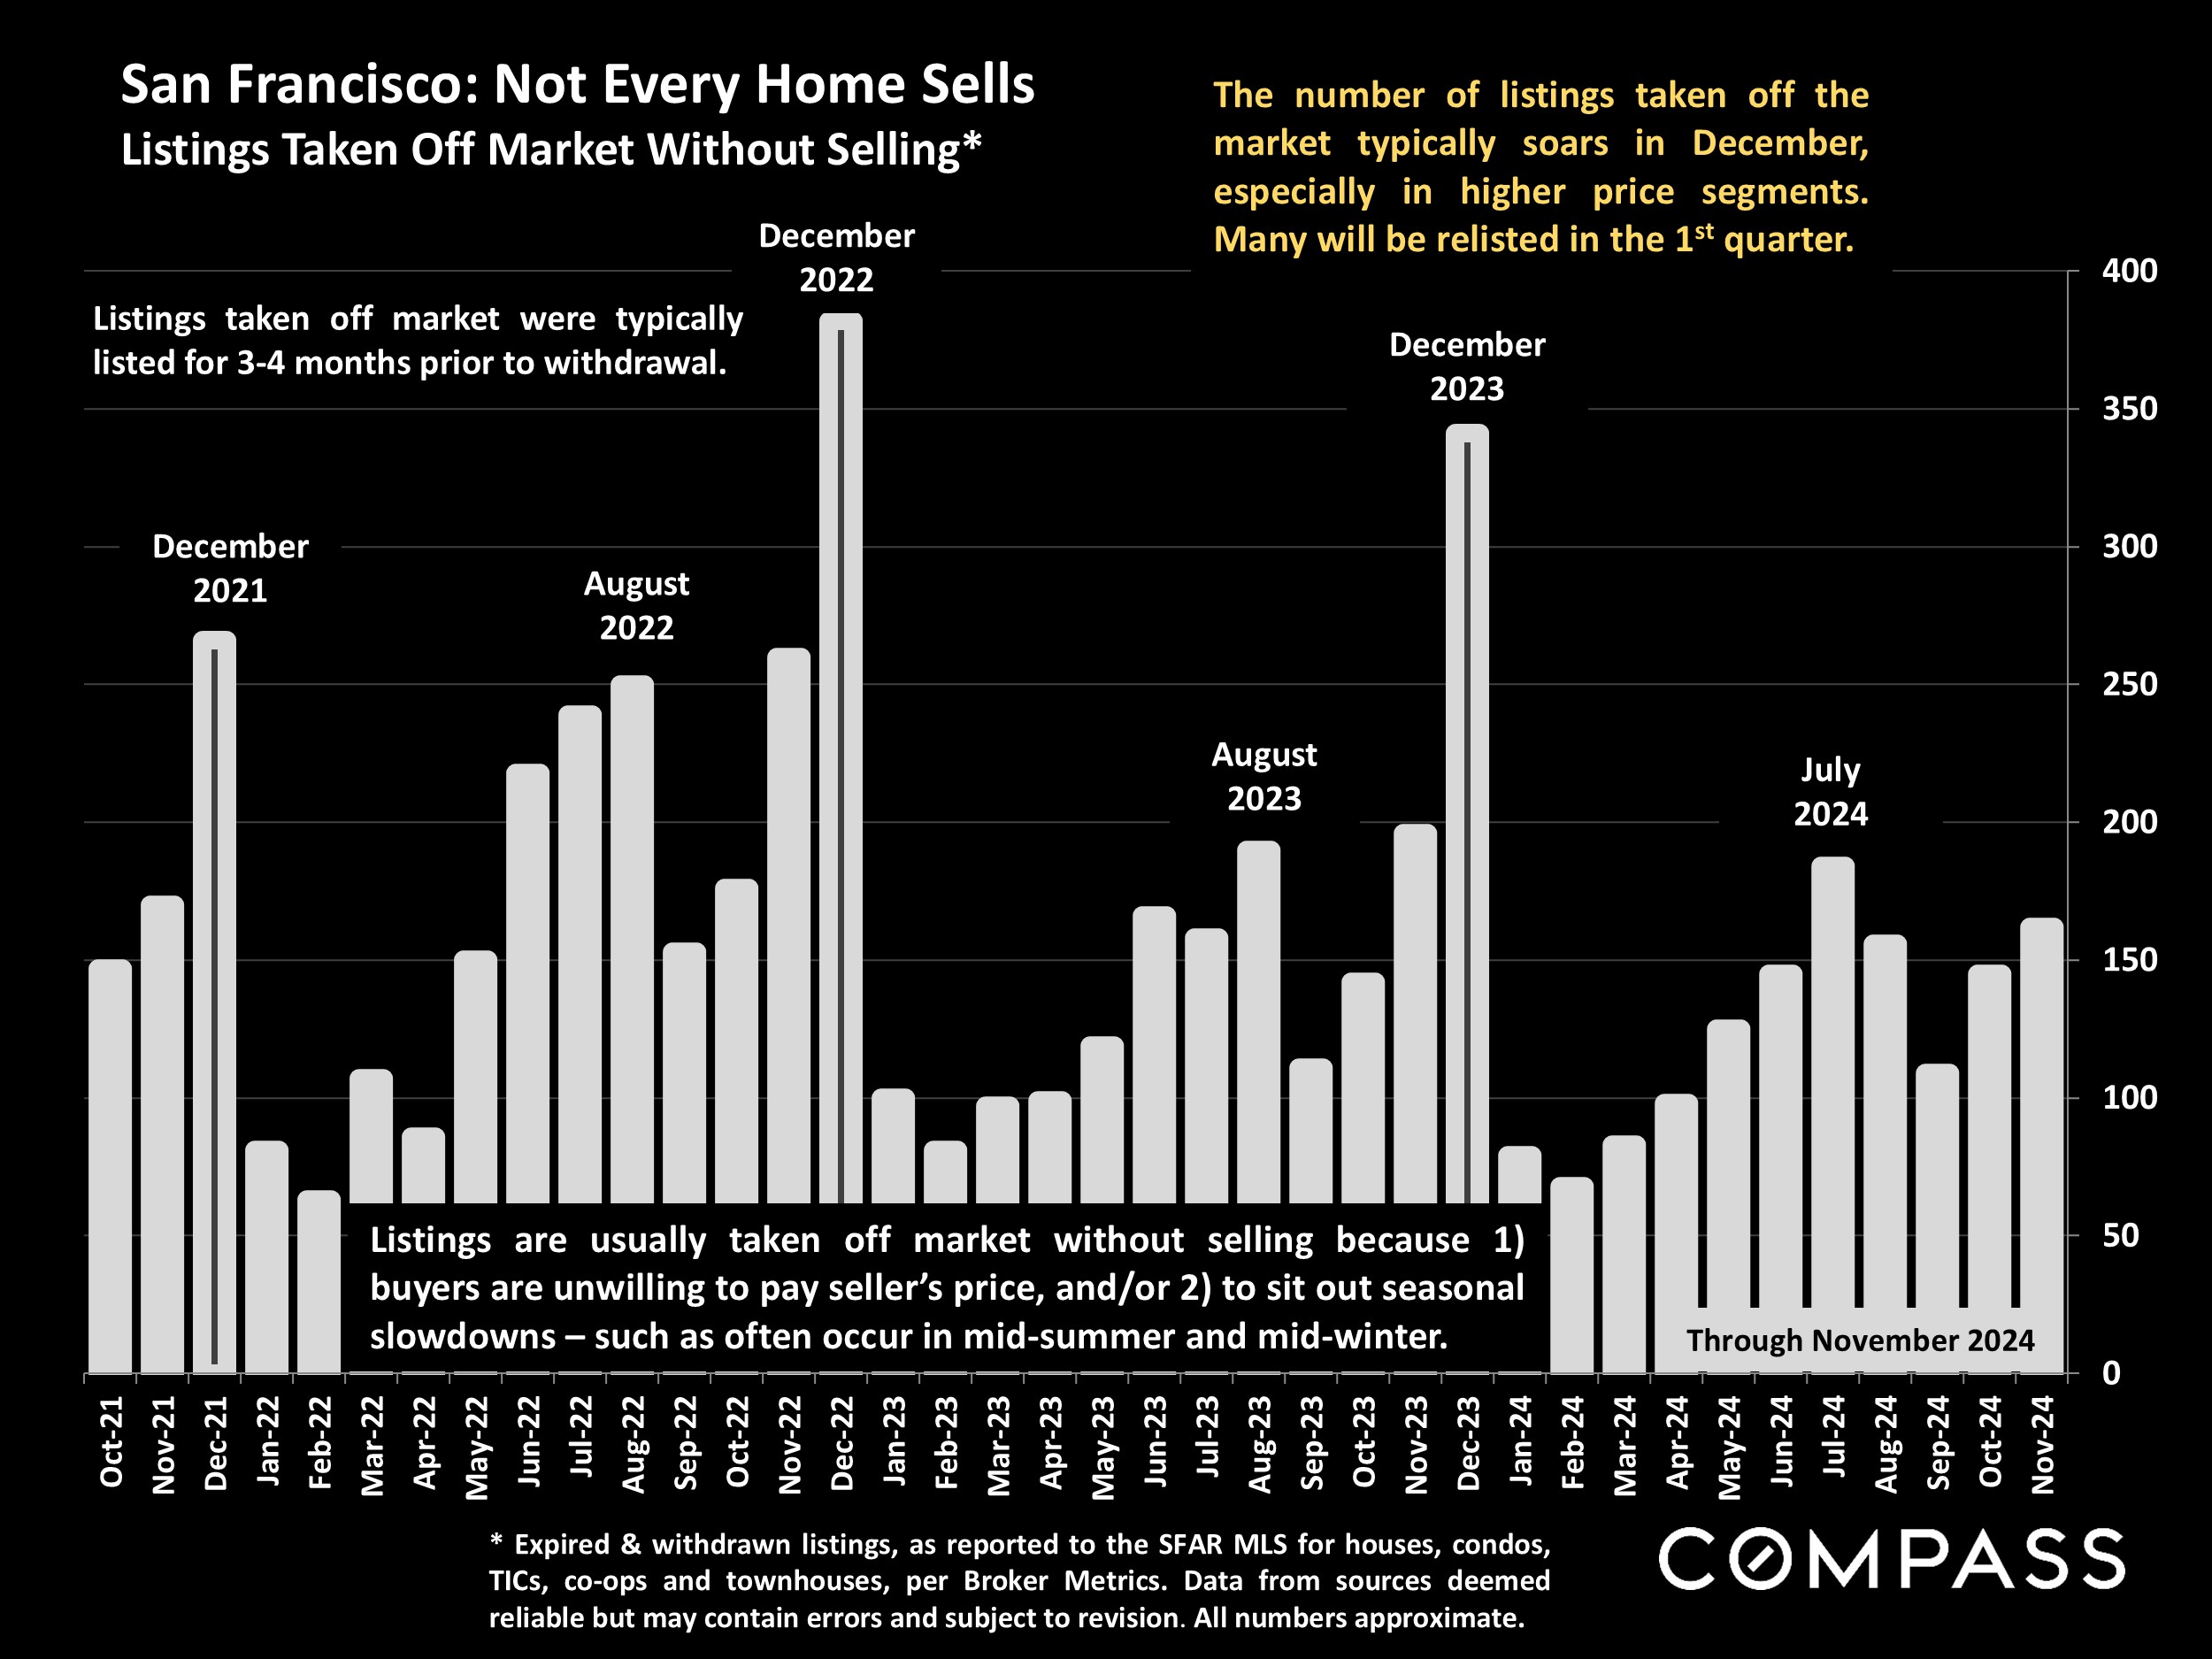
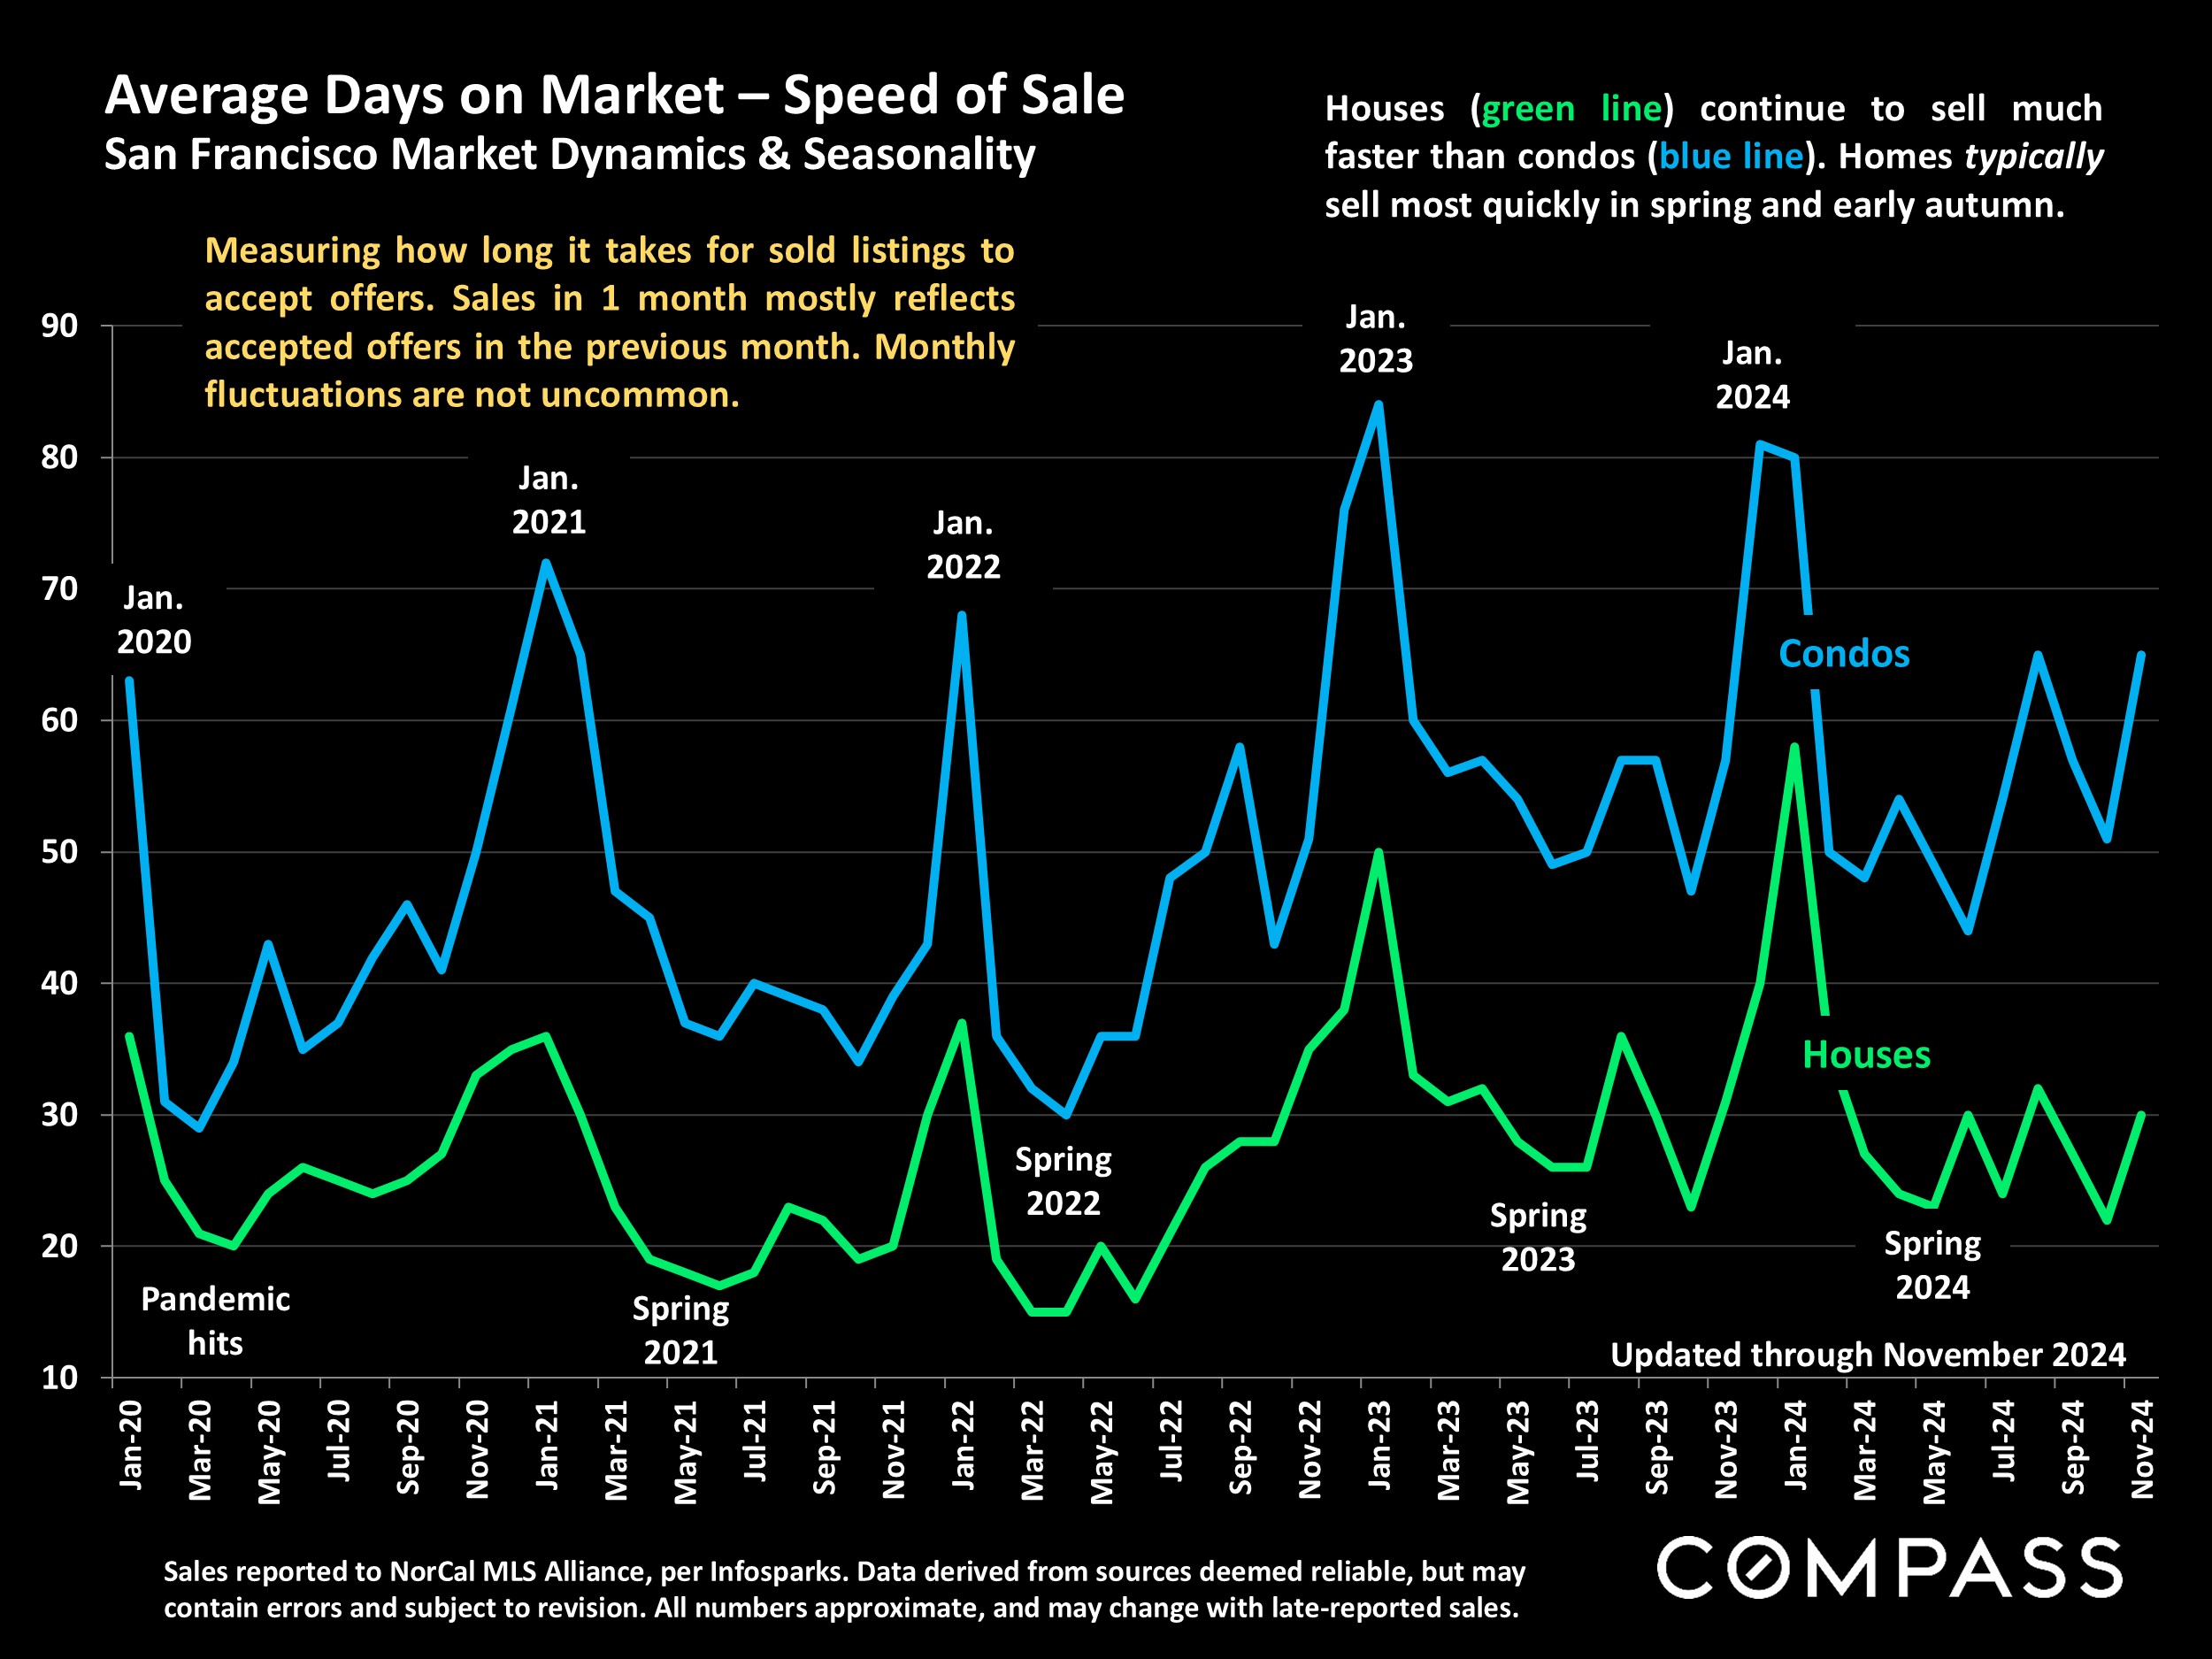
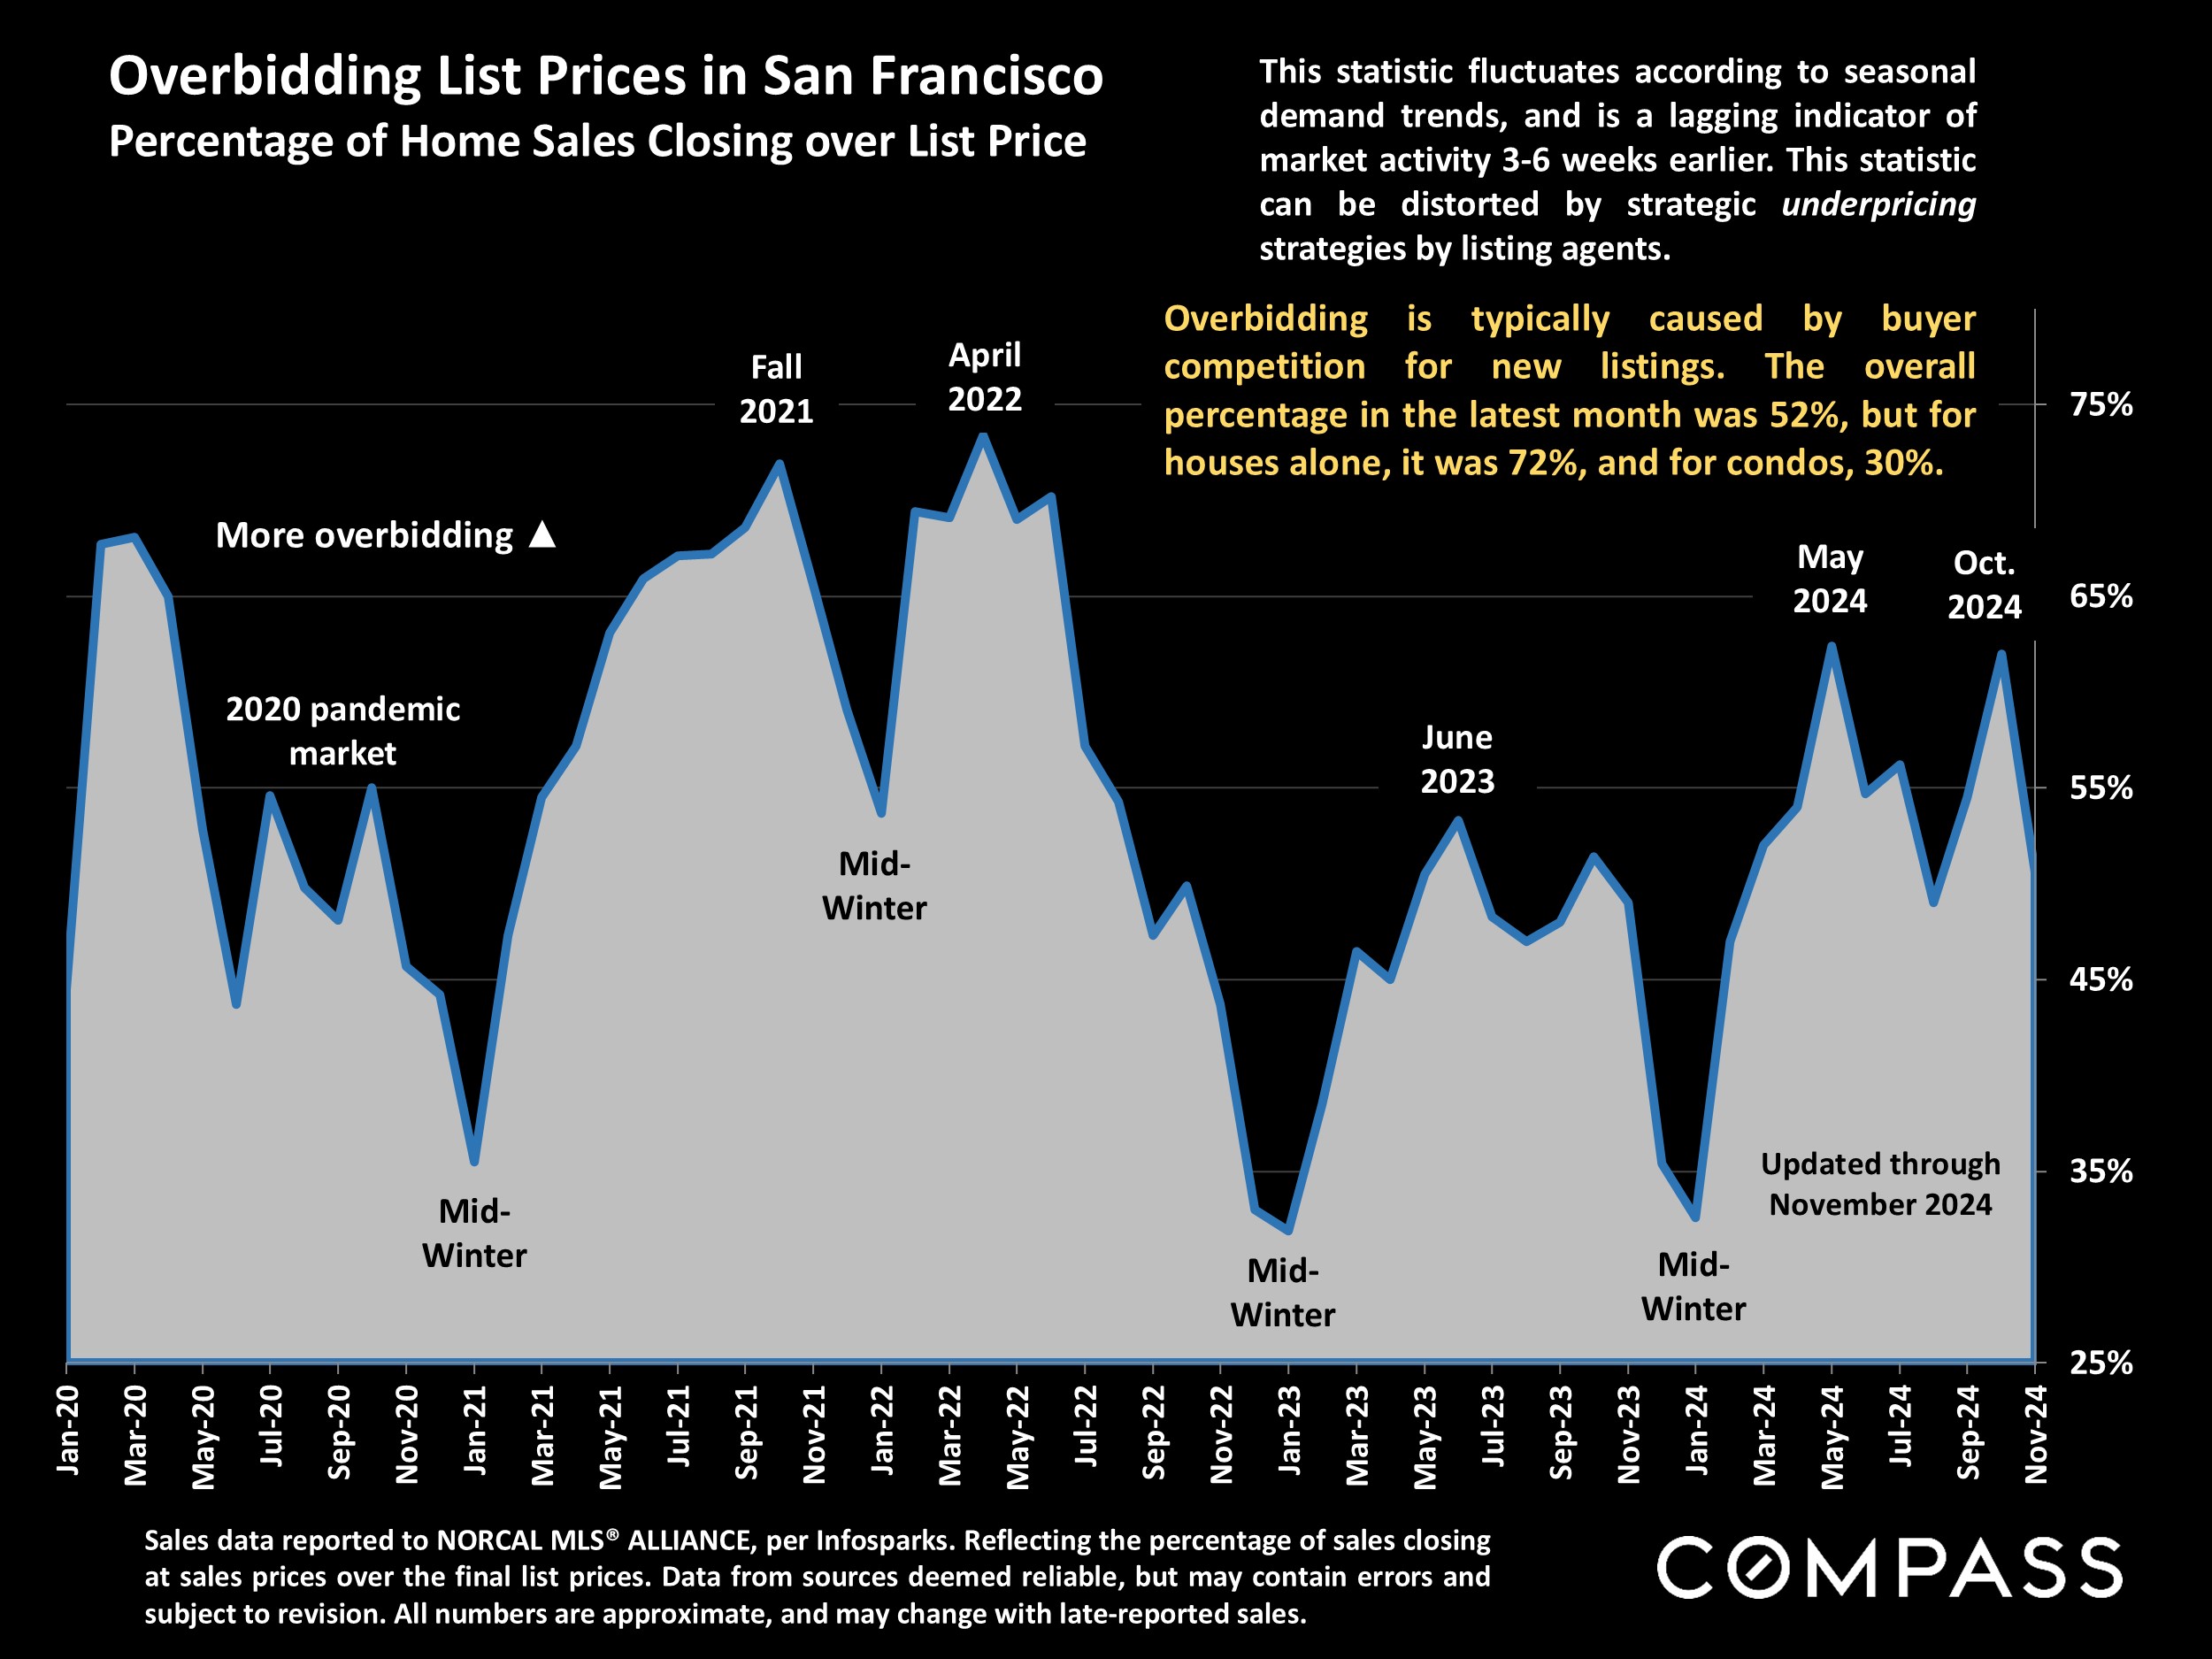
In late November, Bay Area markets began moving into the mid-winter holiday slowdown, which in December typically results in the lowest counts of the year for new listings coming on the market and homes going into contract. Homes are still listed and deals continue to be made, just at a much slower pace, and this is usually the period where buyers can negotiate most aggressively on unsold properties with longer days-on-market.
It is difficult to make definitive determinations about where the market is heading in 2025 from Q4 statistics, but in the last several years, demand rebounded substantially early in the new year and then accelerated into spring. And some agents have reported a significant increase in clients wanting to list their homes next year. As always, much depends on political and macroeconomic factors that can be challenging to predict.
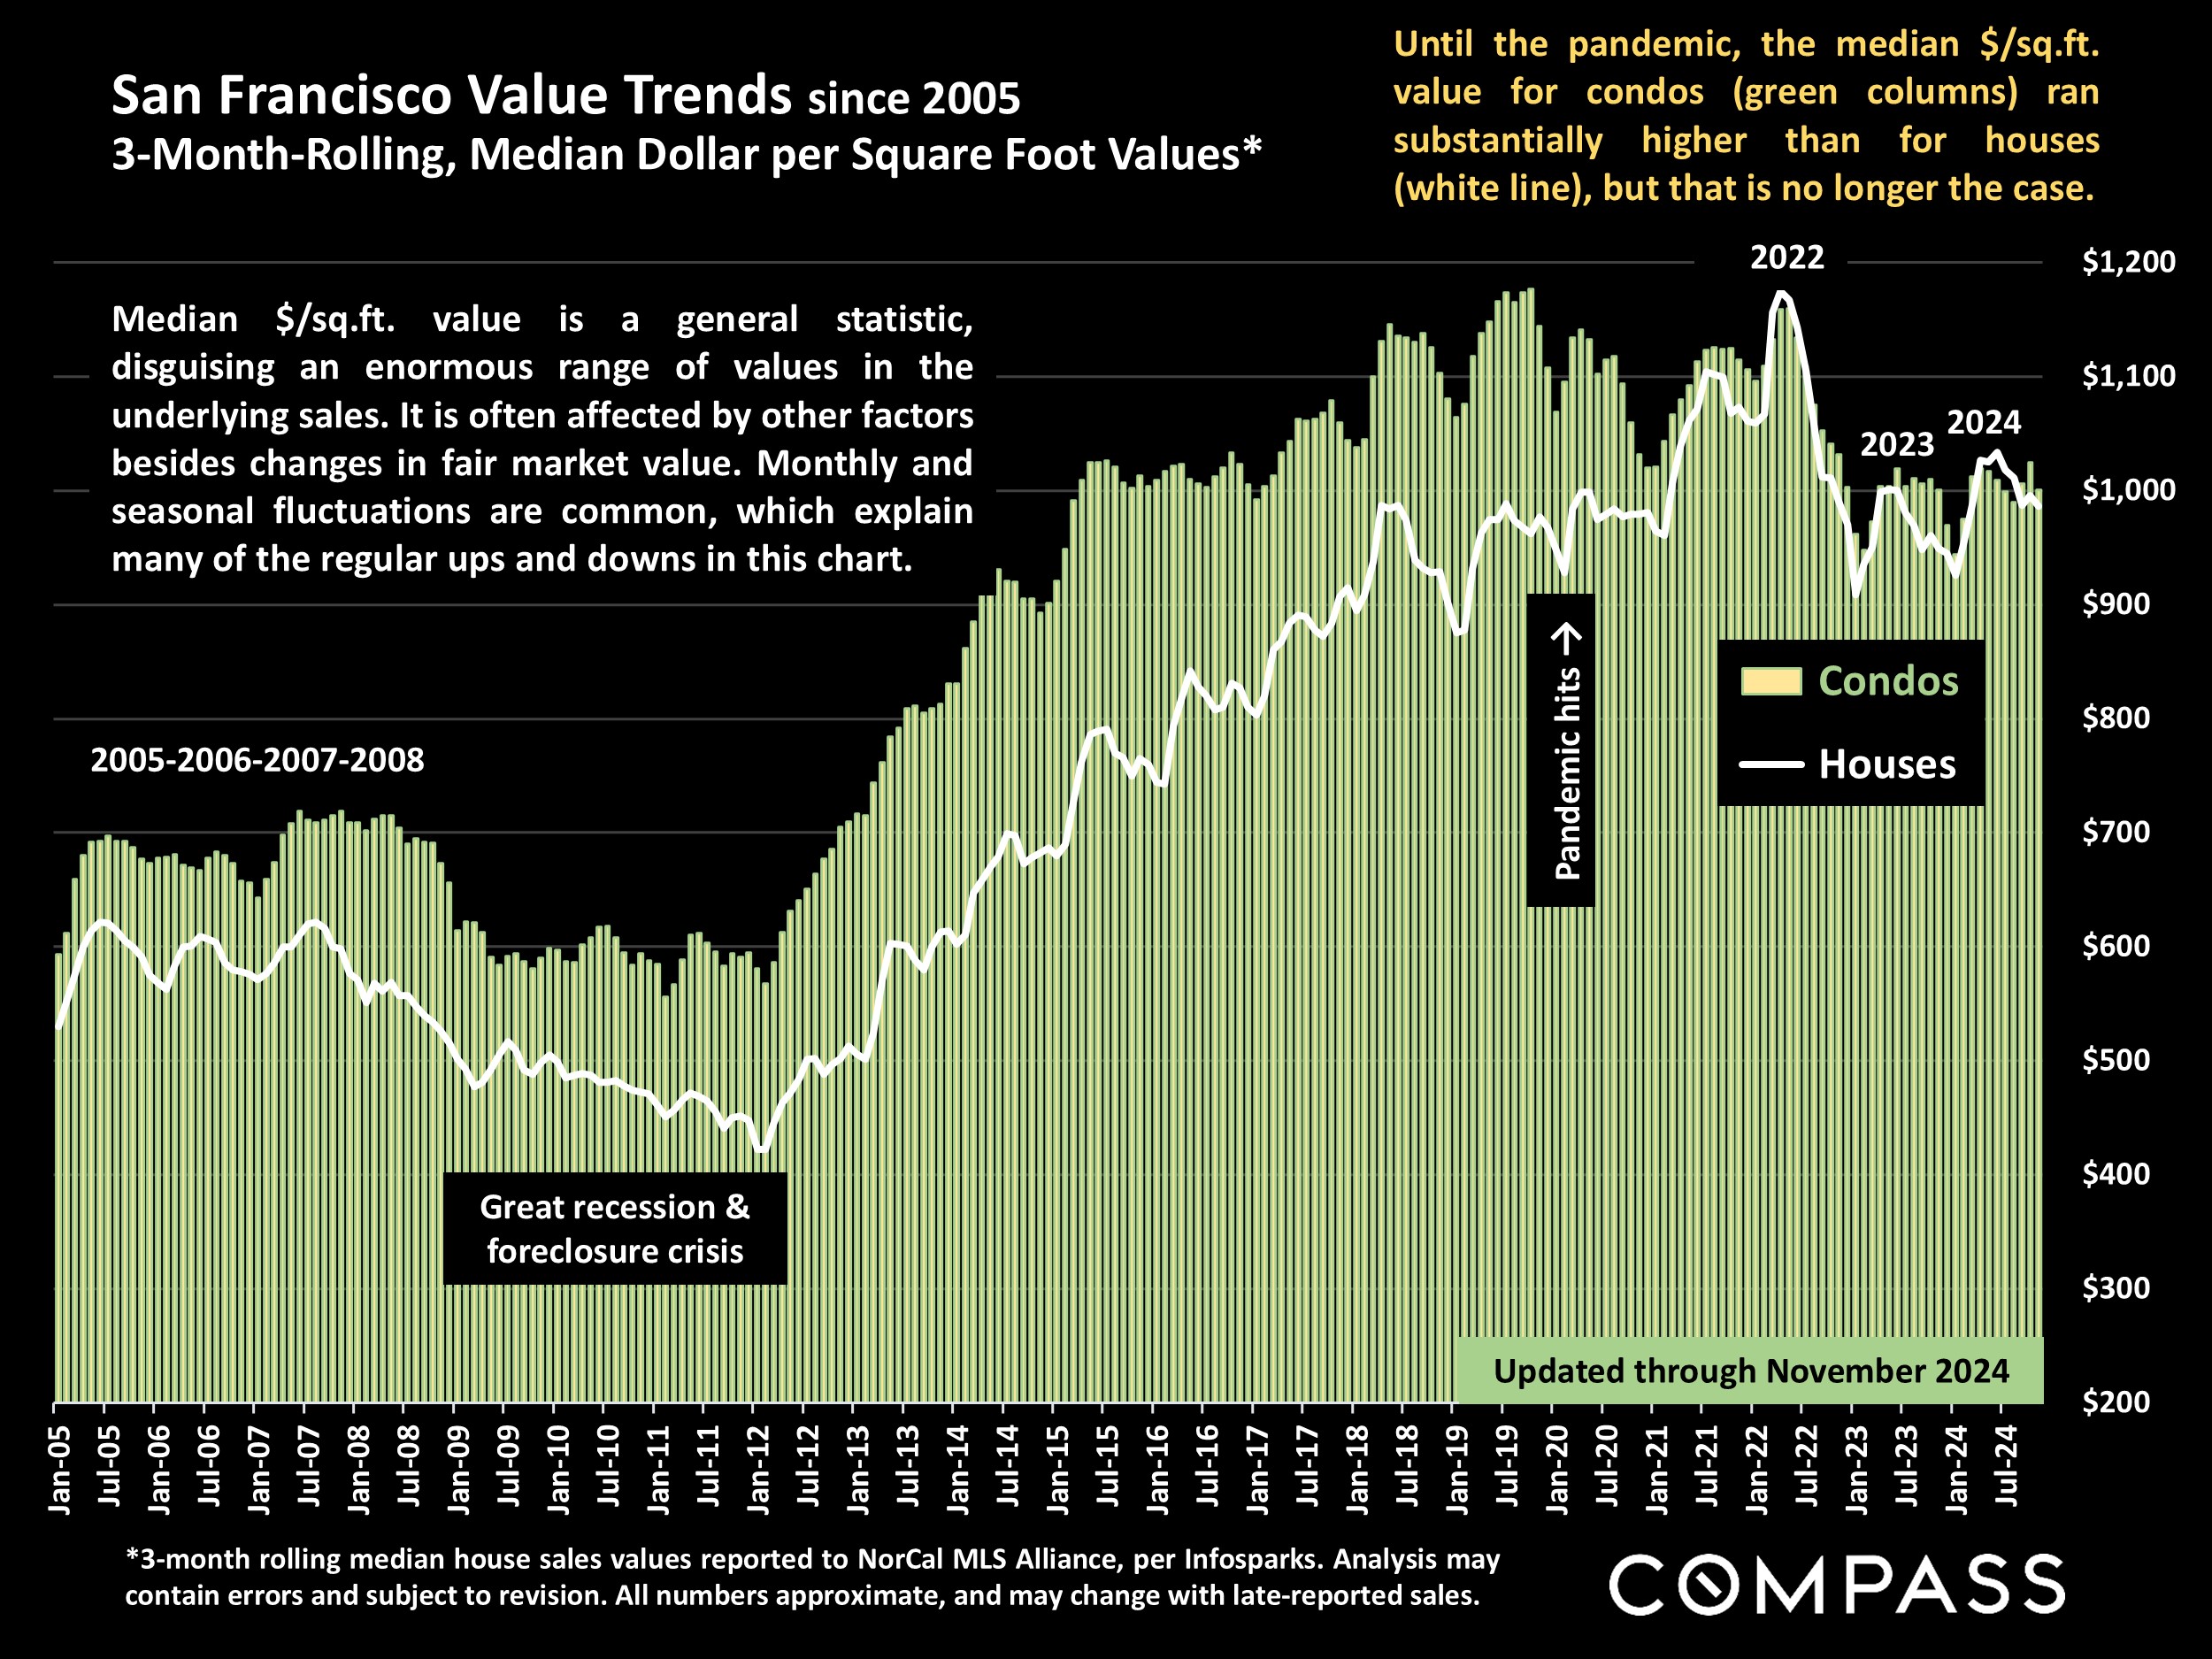
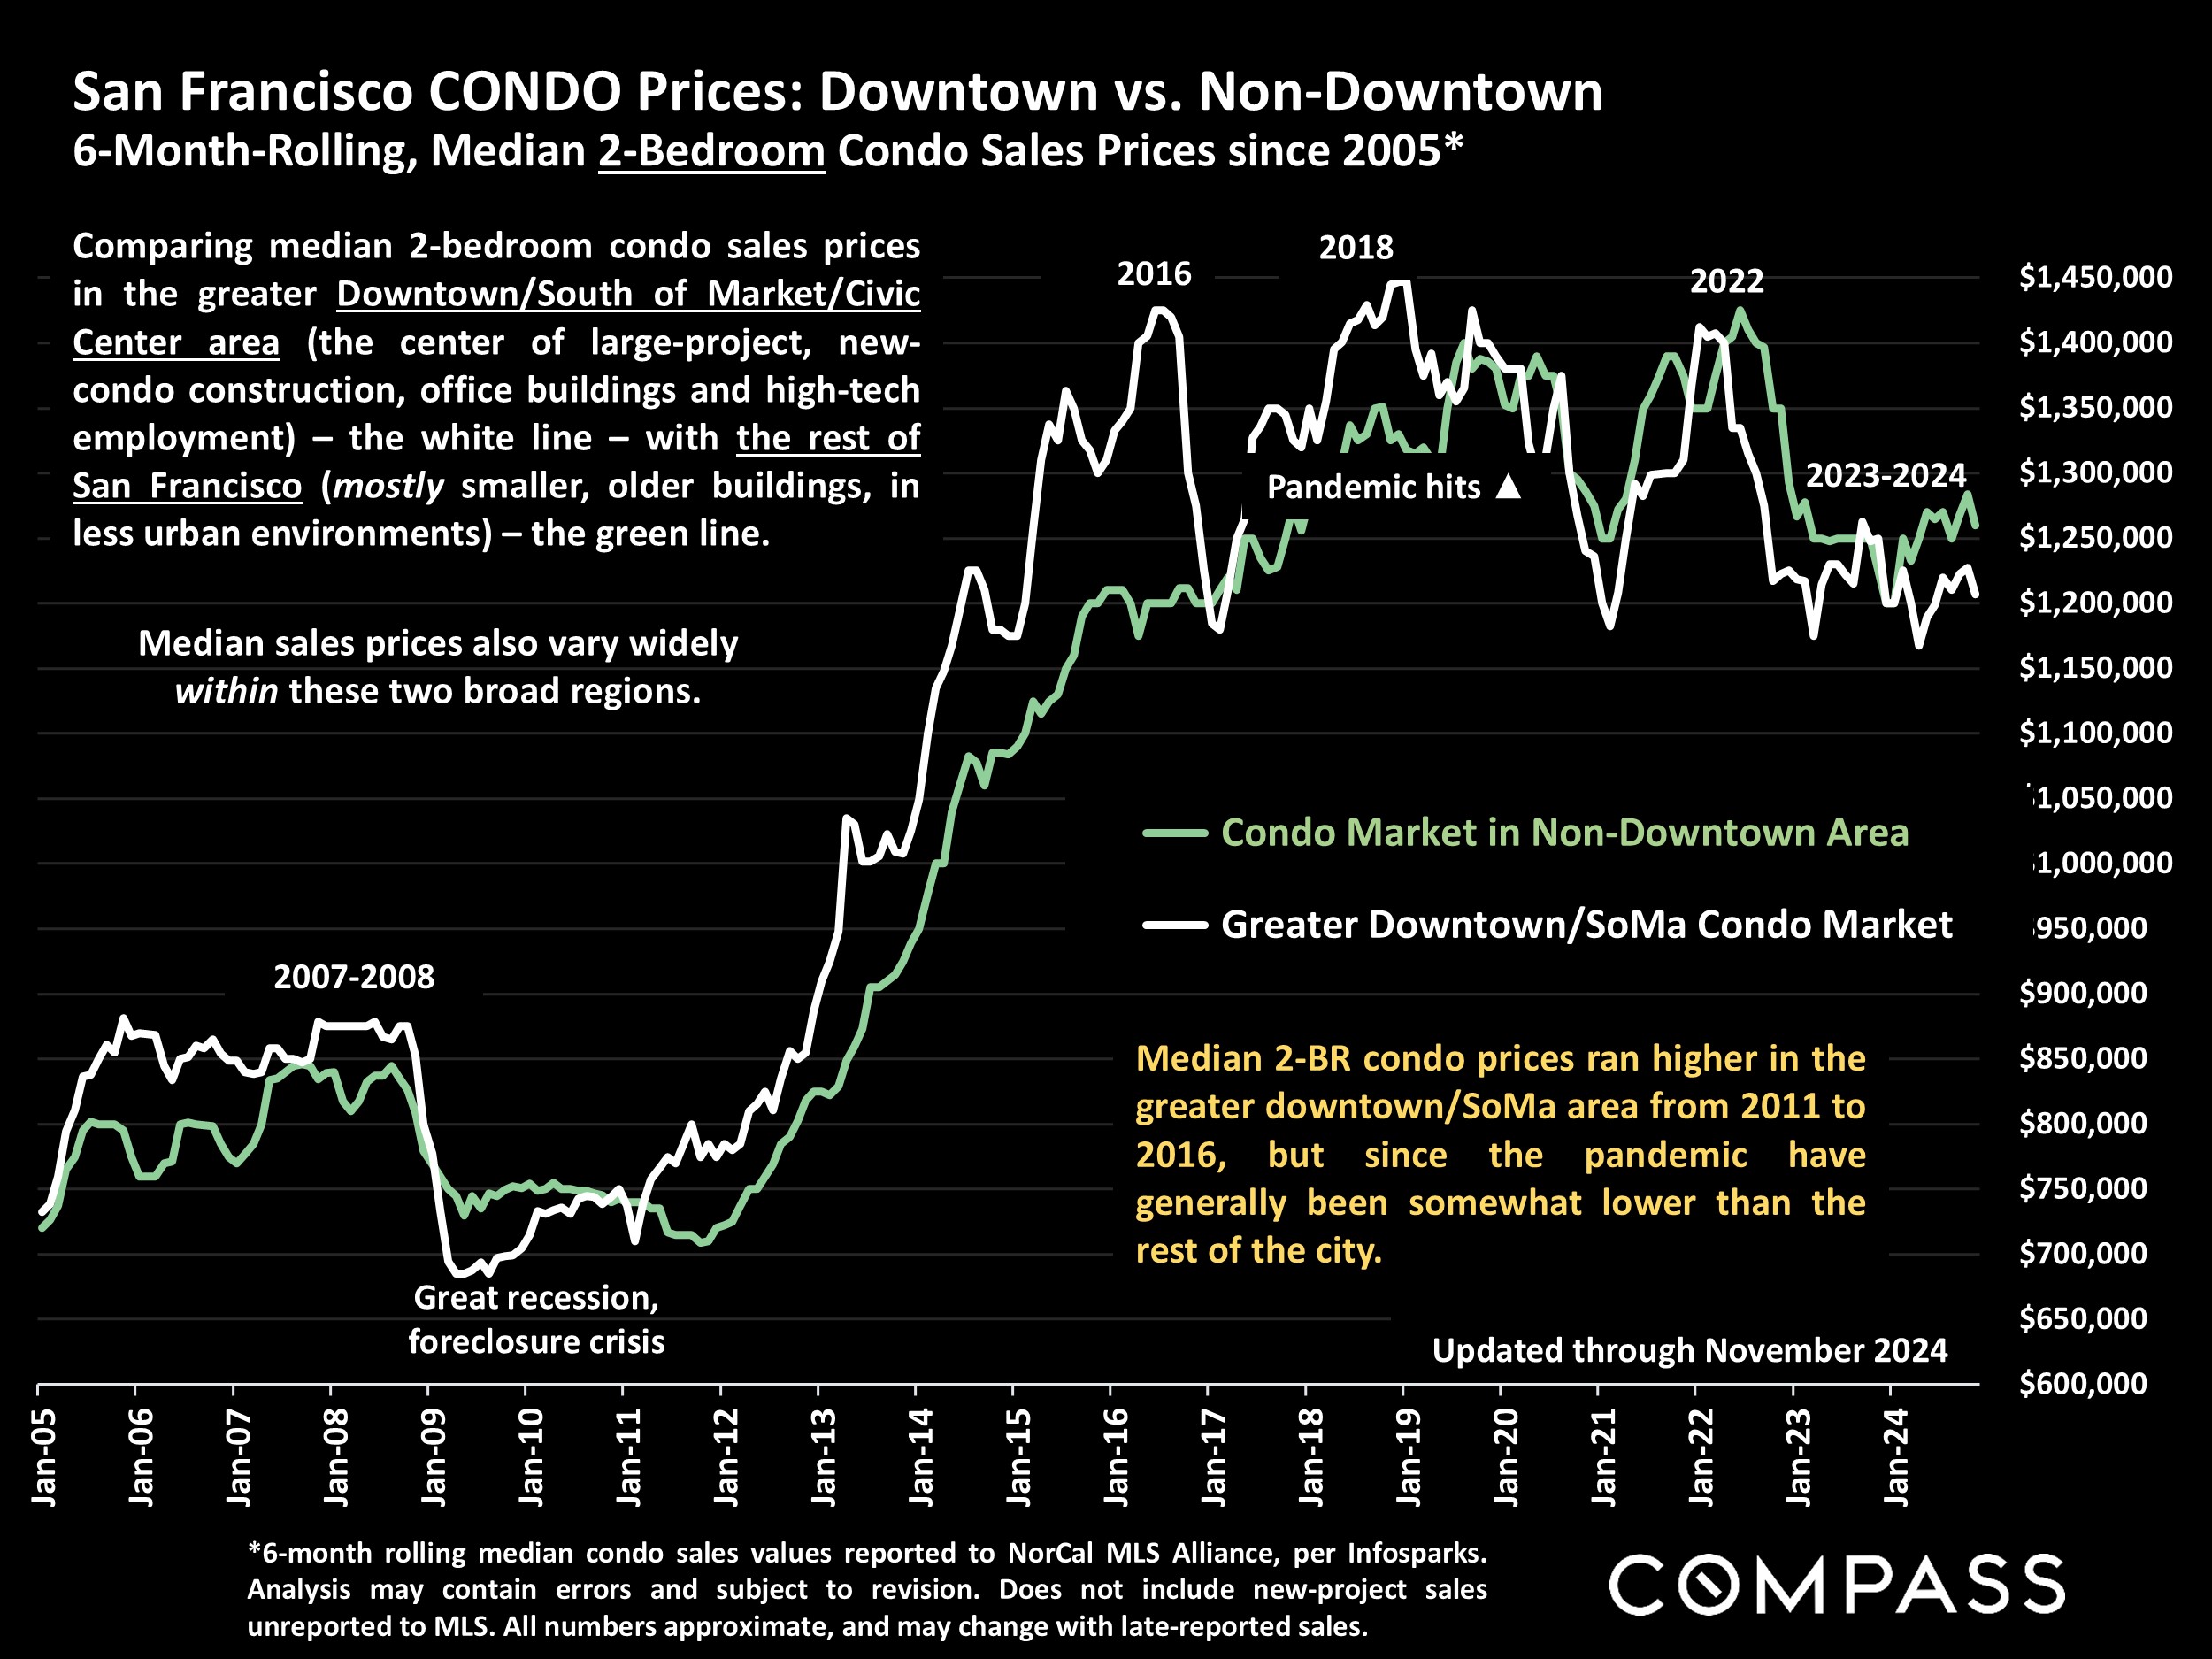
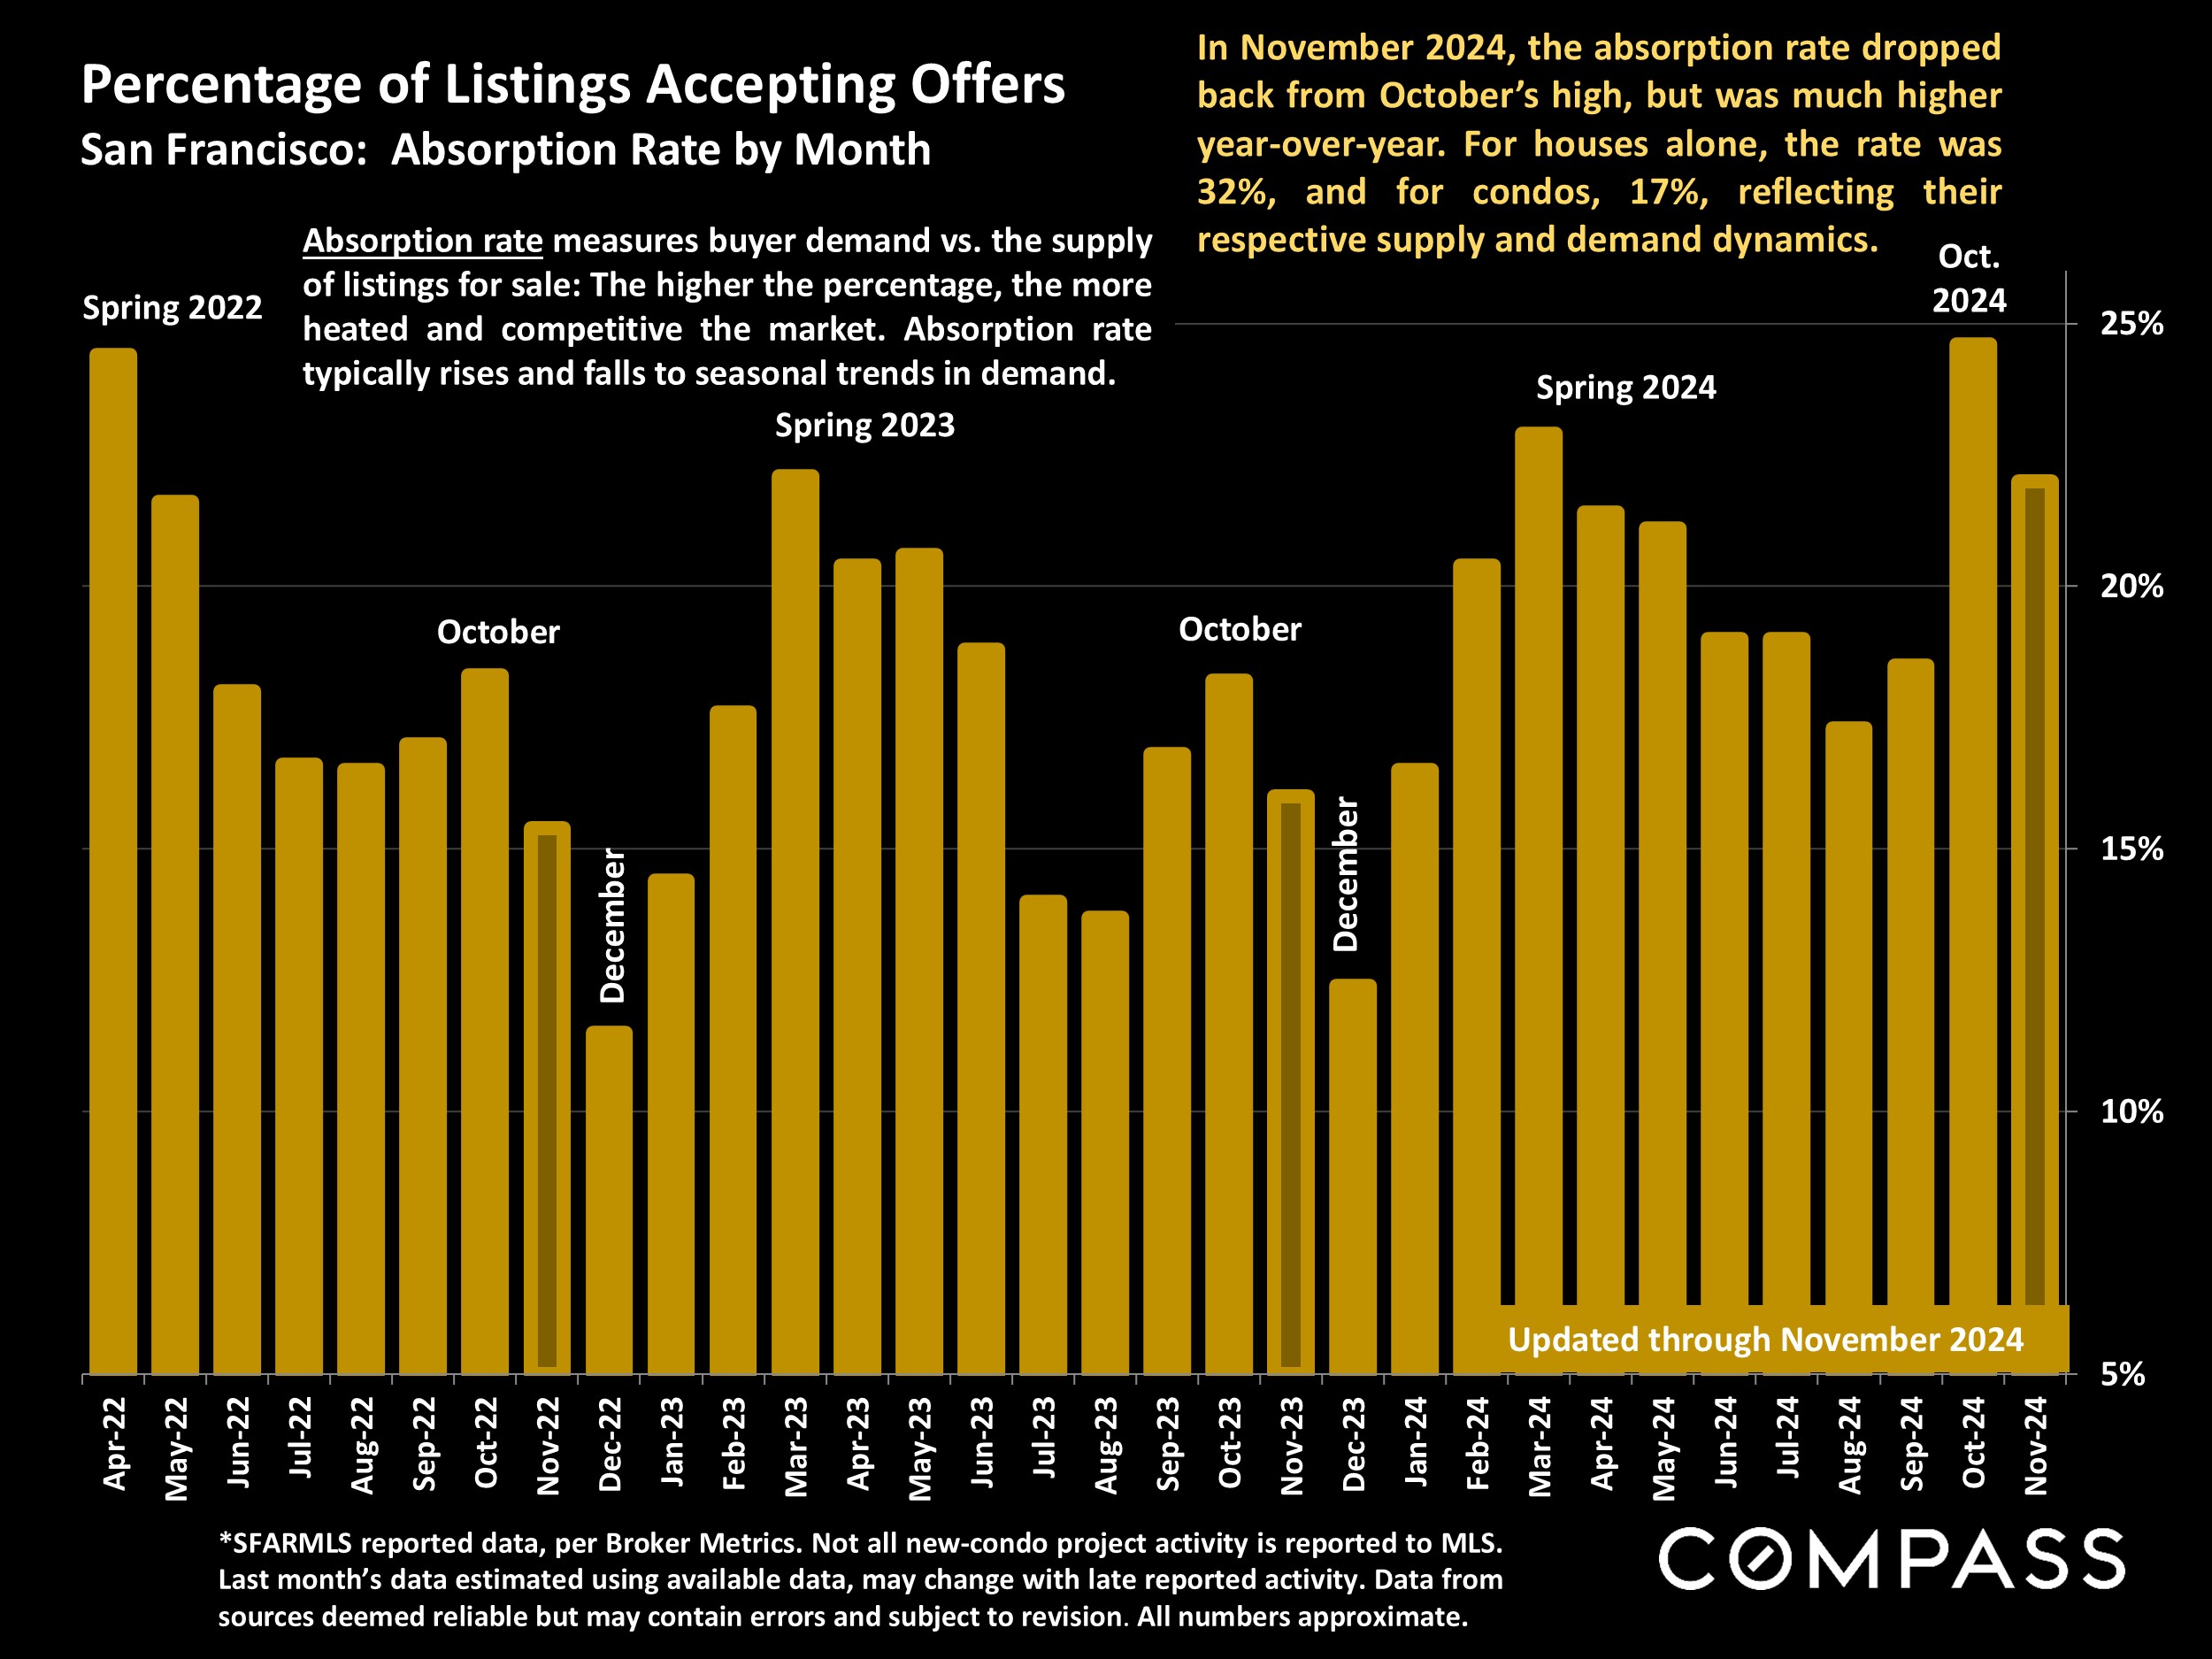
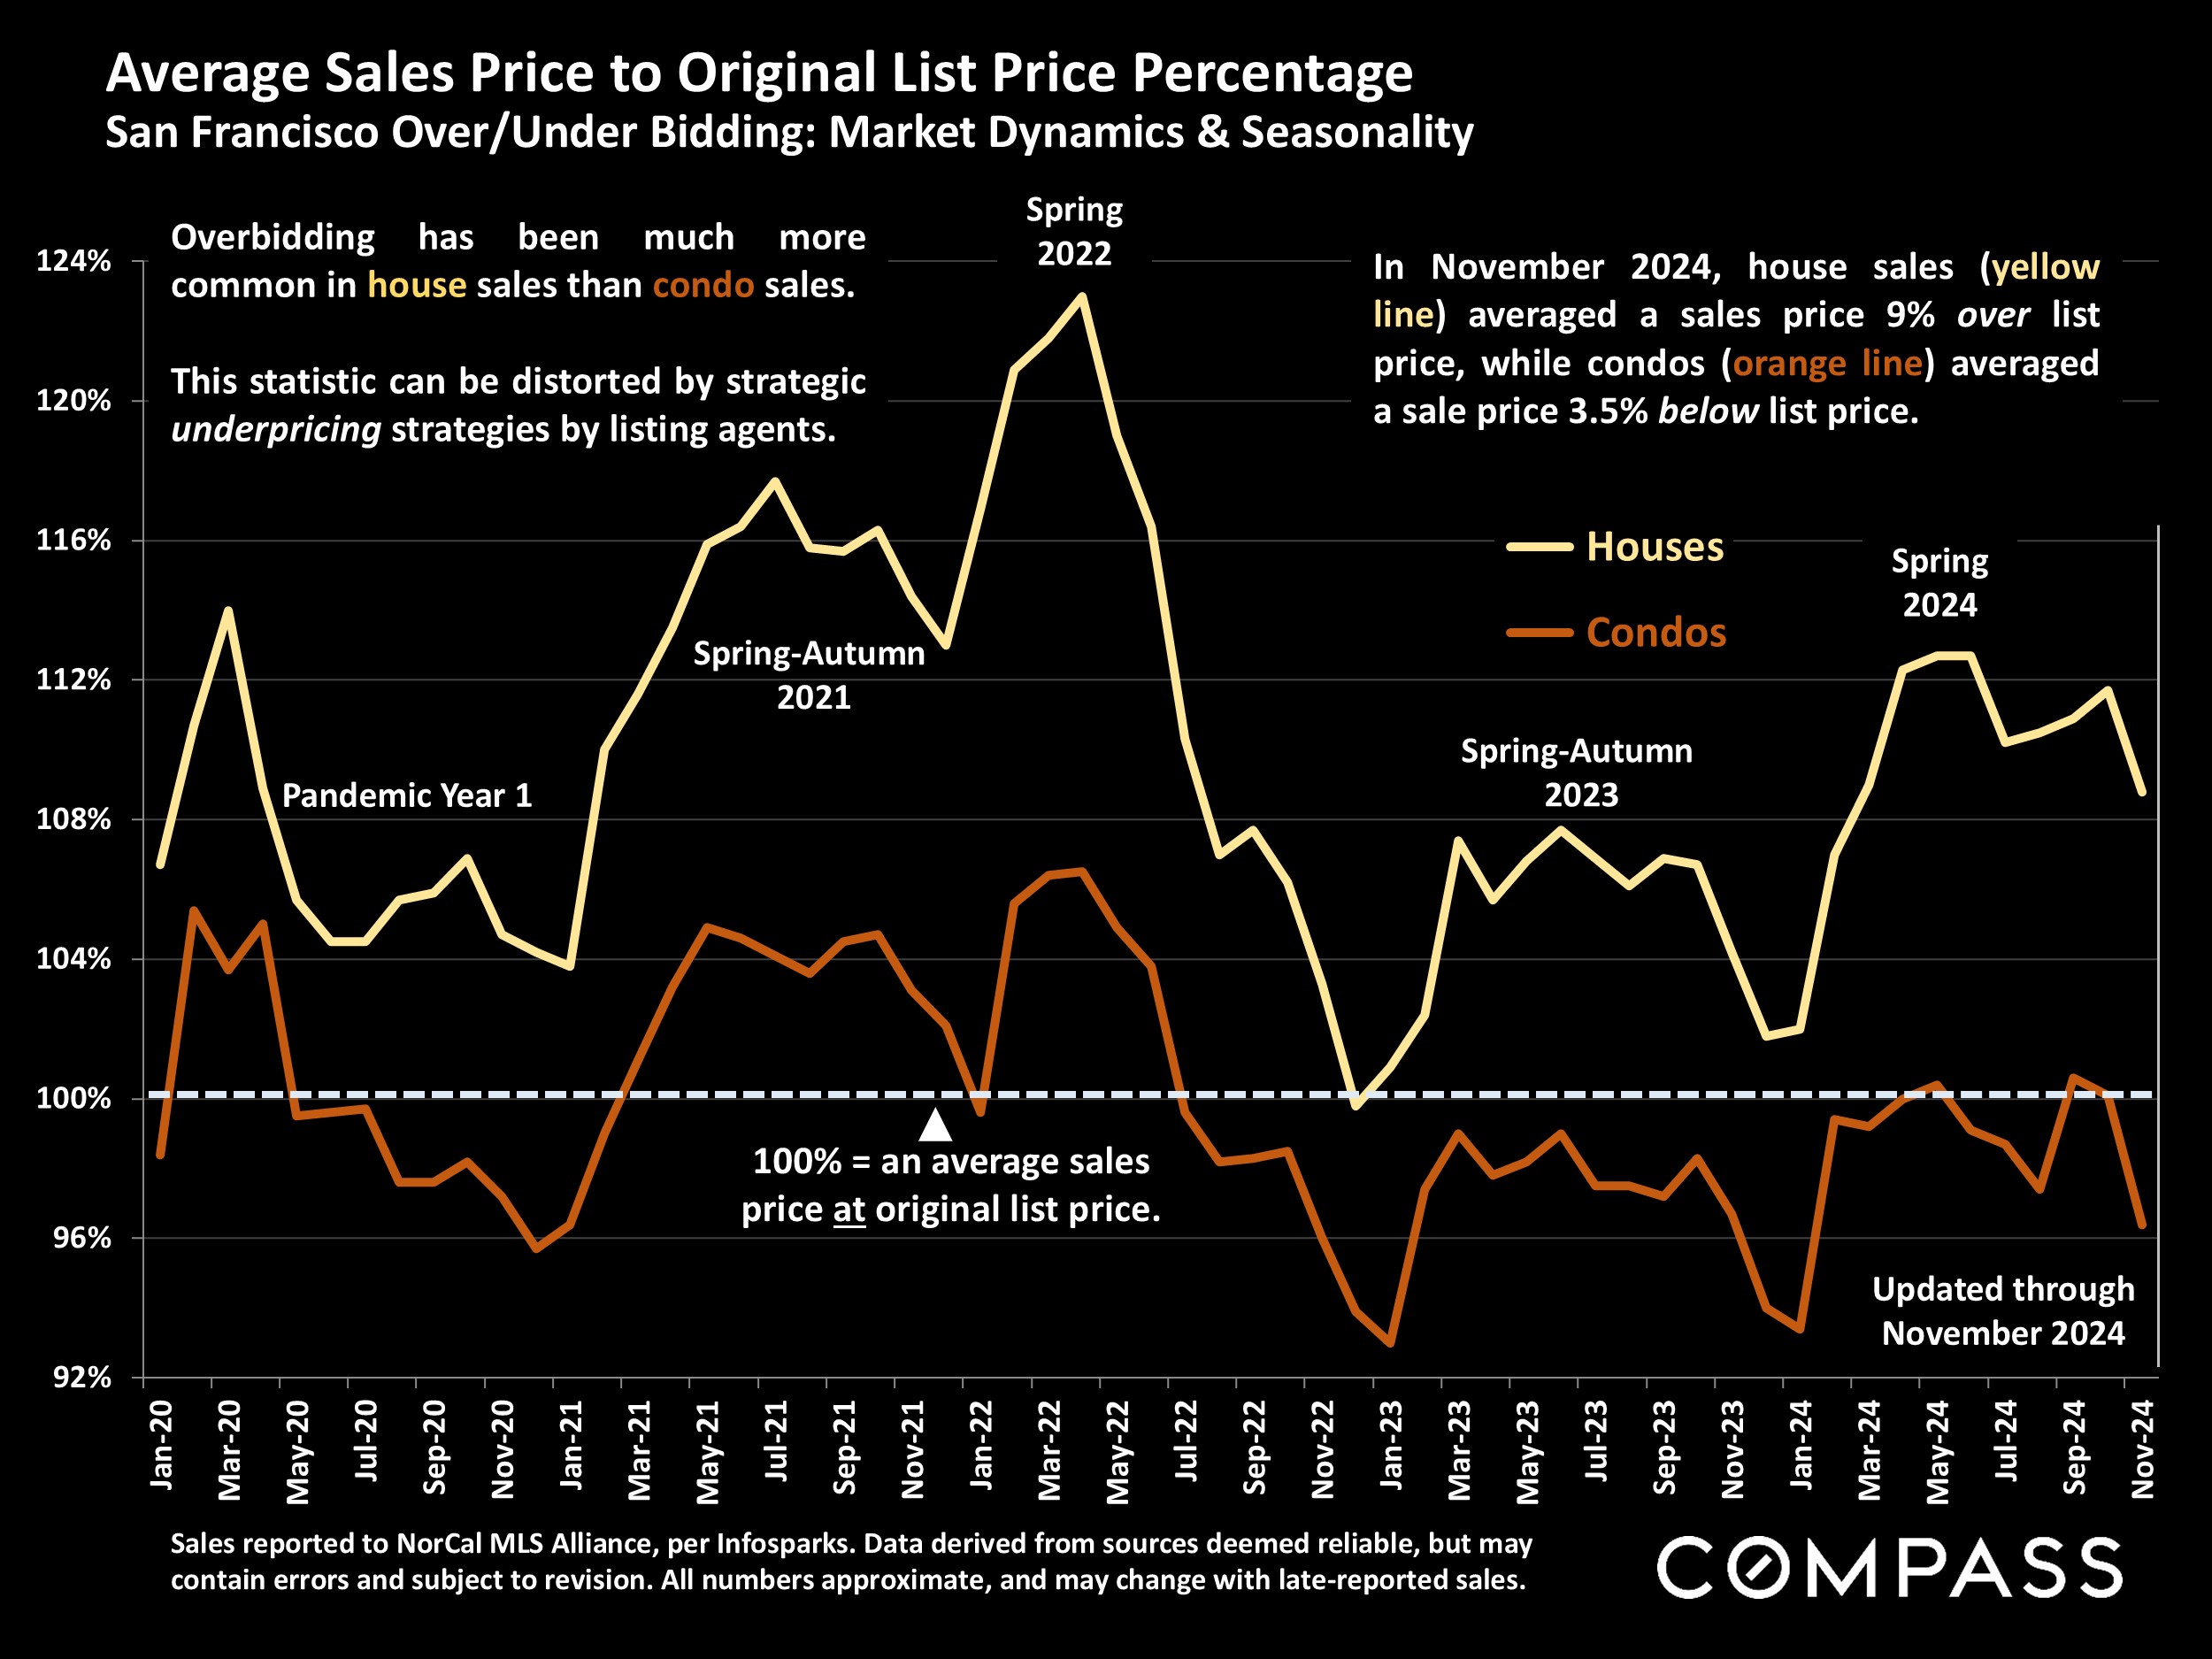
This report will look at supply and demand dynamics in November - but note that many of November's sales statistics reflect listings that went into contract in October - and our January report will review longer-term, annual numbers that will provide greater context to 2024 market conditions and trends.
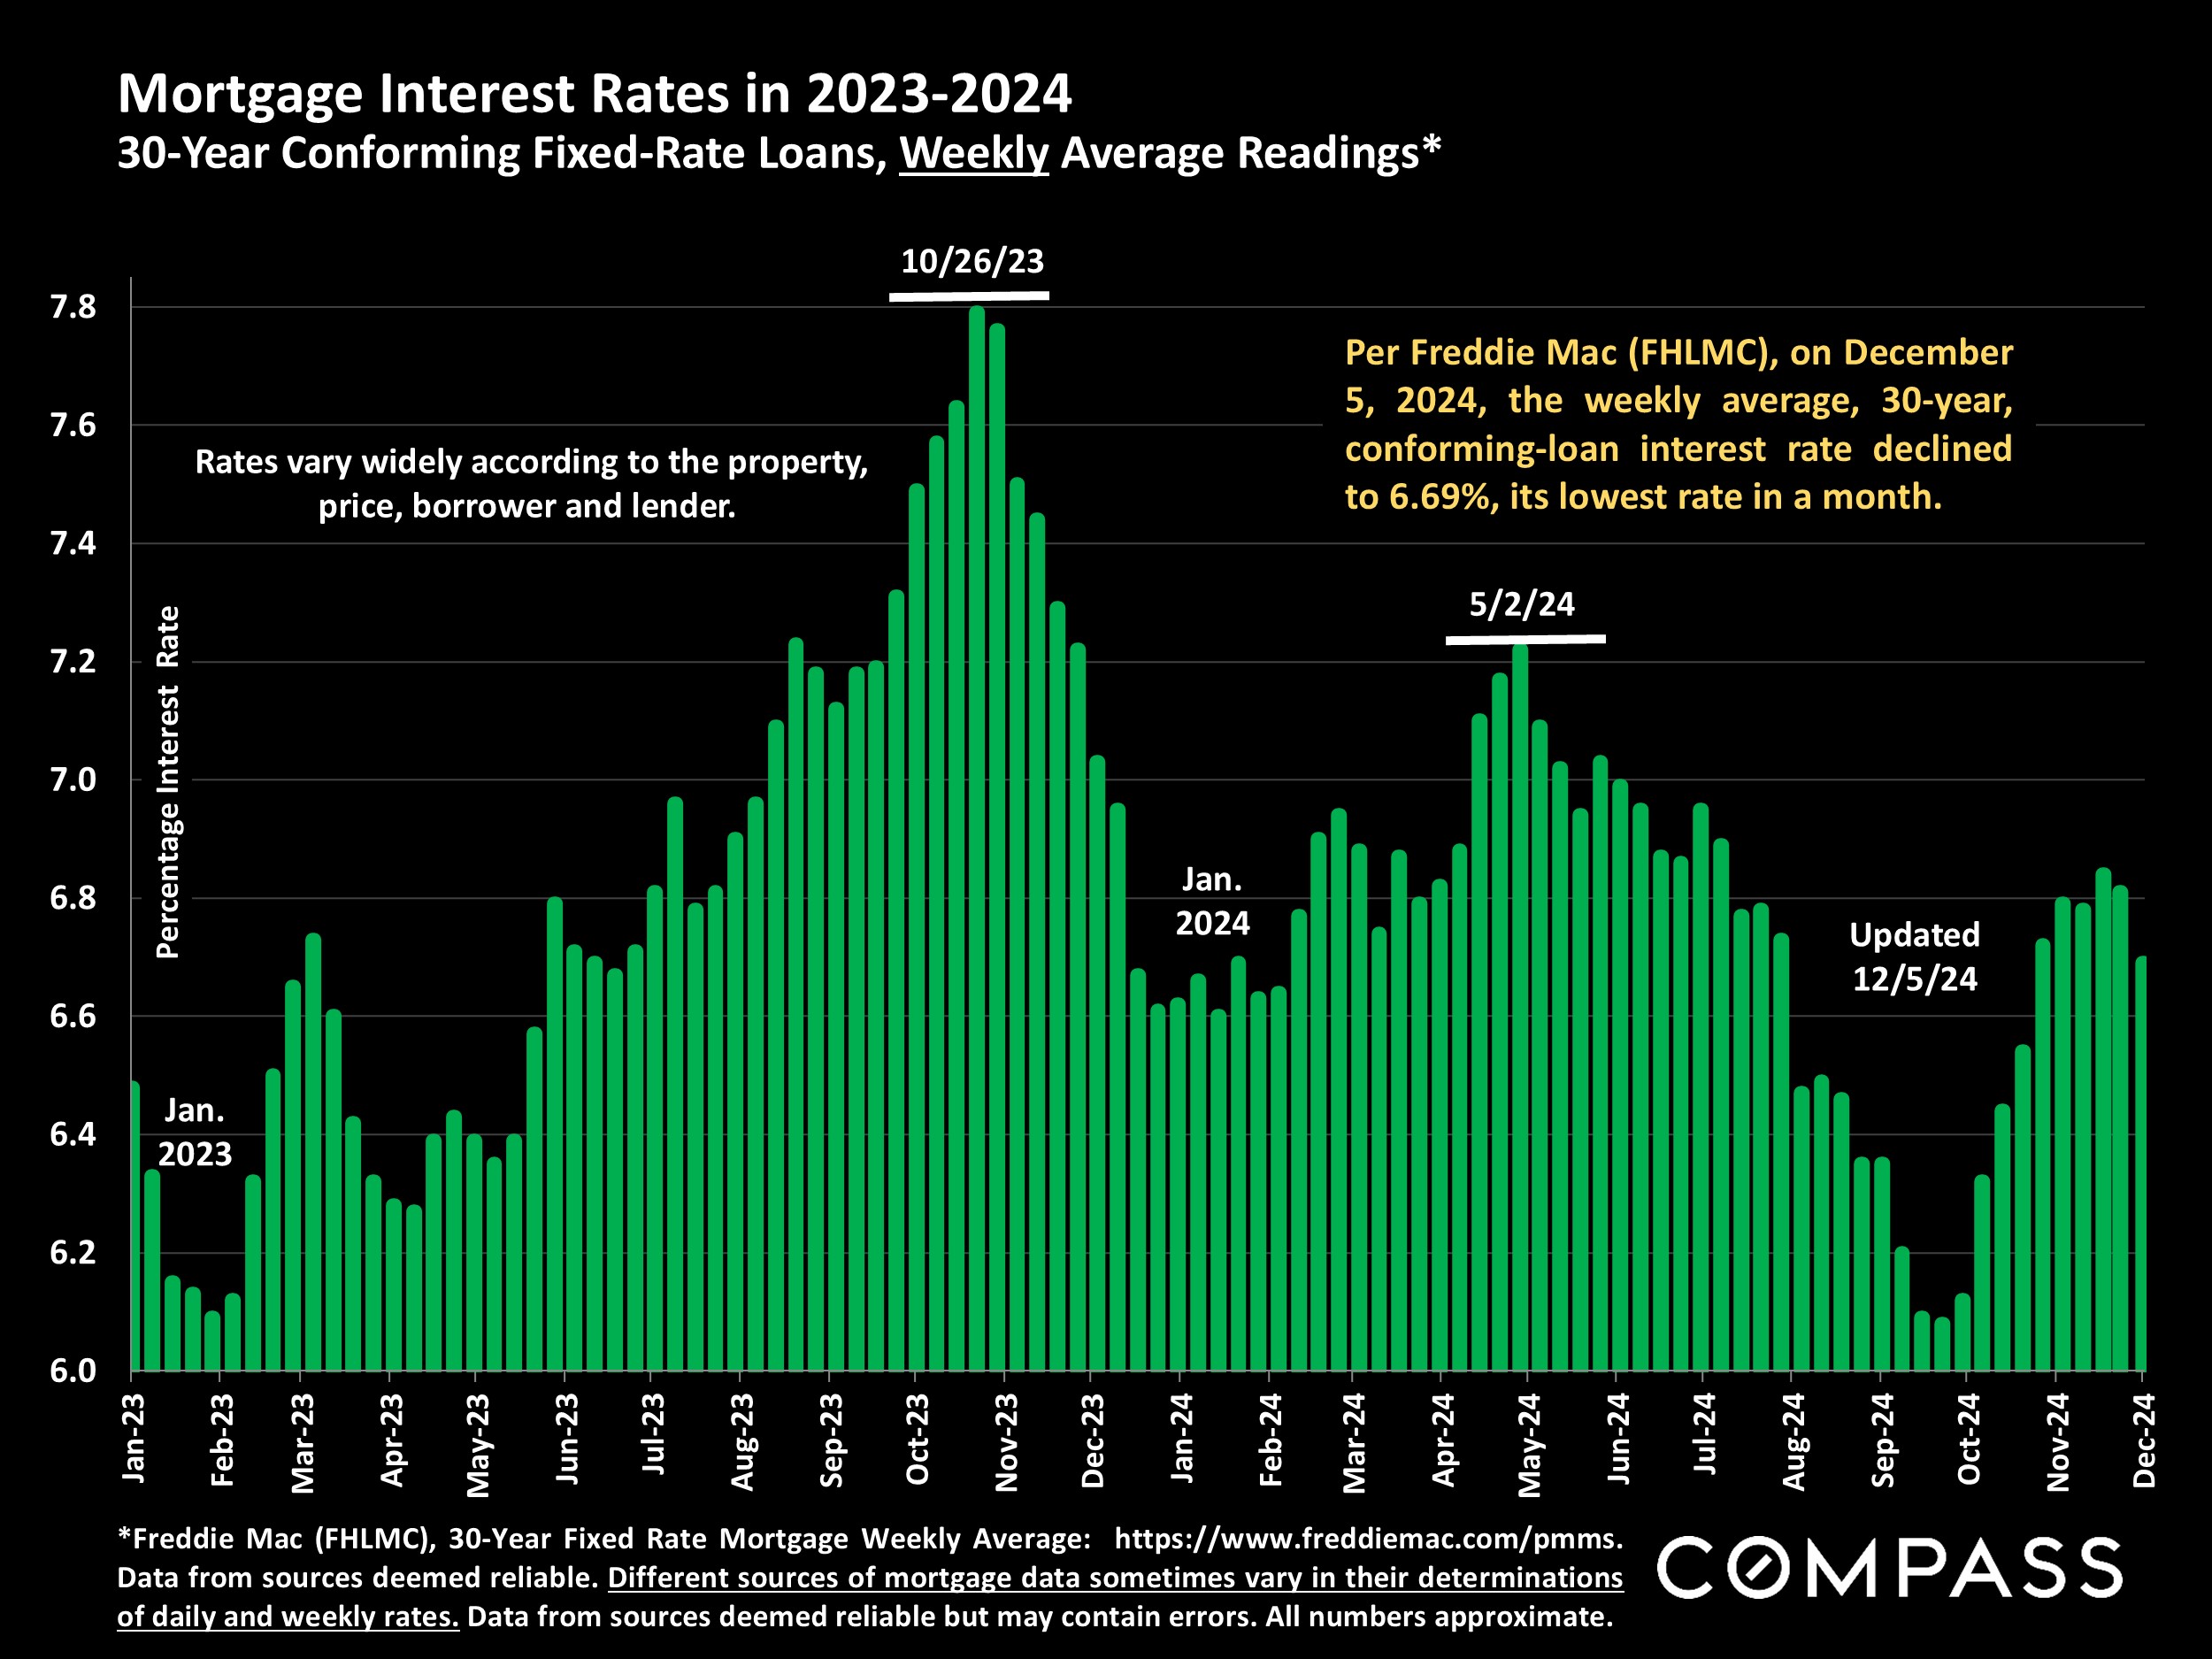
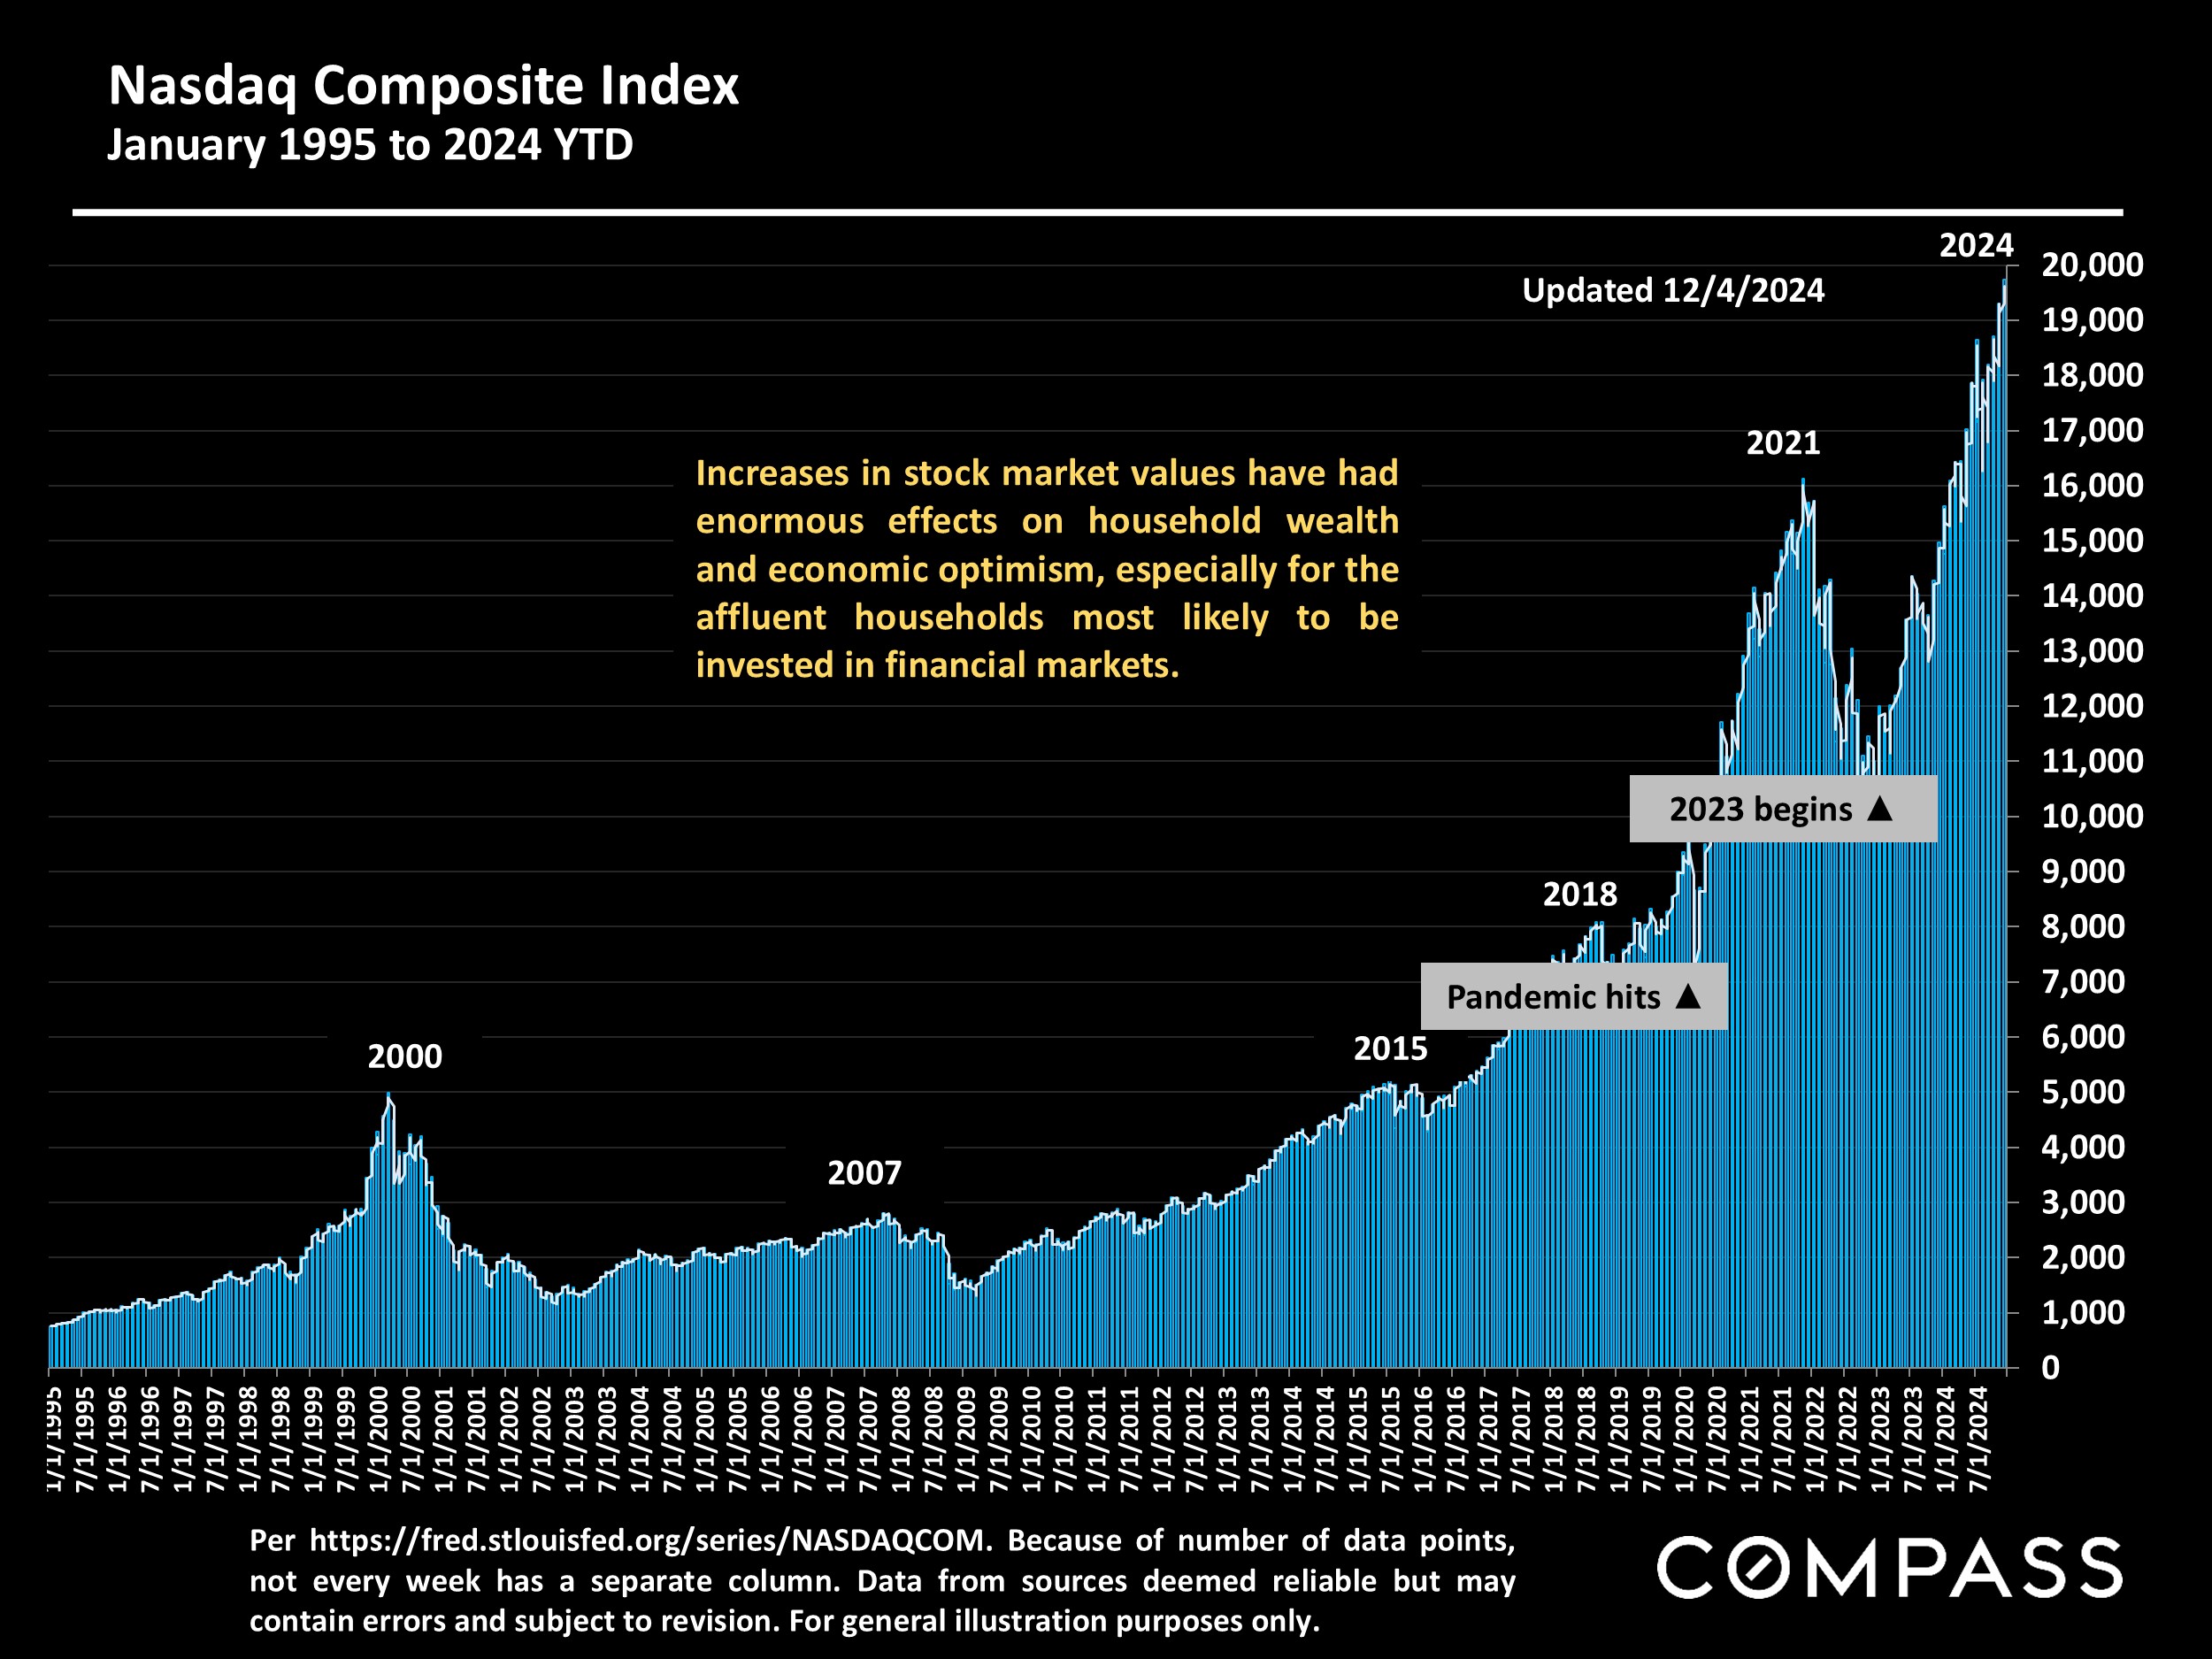
As of the first week of December, 30-year conforming mortgage interest rates were ticking down again, but still about a half point above early October. Stock markets have continued to hit new highs on almost a daily basis; inflation ticked up slightly (11/13/24 reading); the Fed dropped their benchmark rate another quarter percent (11/7/24); the jobs report rebounded (12/6/24); and consumer confidence hit its highest reading in 7 months (12/6/24). These economic indicators may impact different market segments differently depending on whether interest rates or stock values most affect their buyers.
Want to learn more about Bay Area market trends?
Let’s connect! With relationships and networks across the city, there are a variety of ways I can help you make informed real estate decisions. Call, email, or text – I’m here to help.
Contact
