Feature image for SF: July 2024 Market Stats

July 15, 2024

SF: July 2024 Market Stats

By Compass

Report Highlights

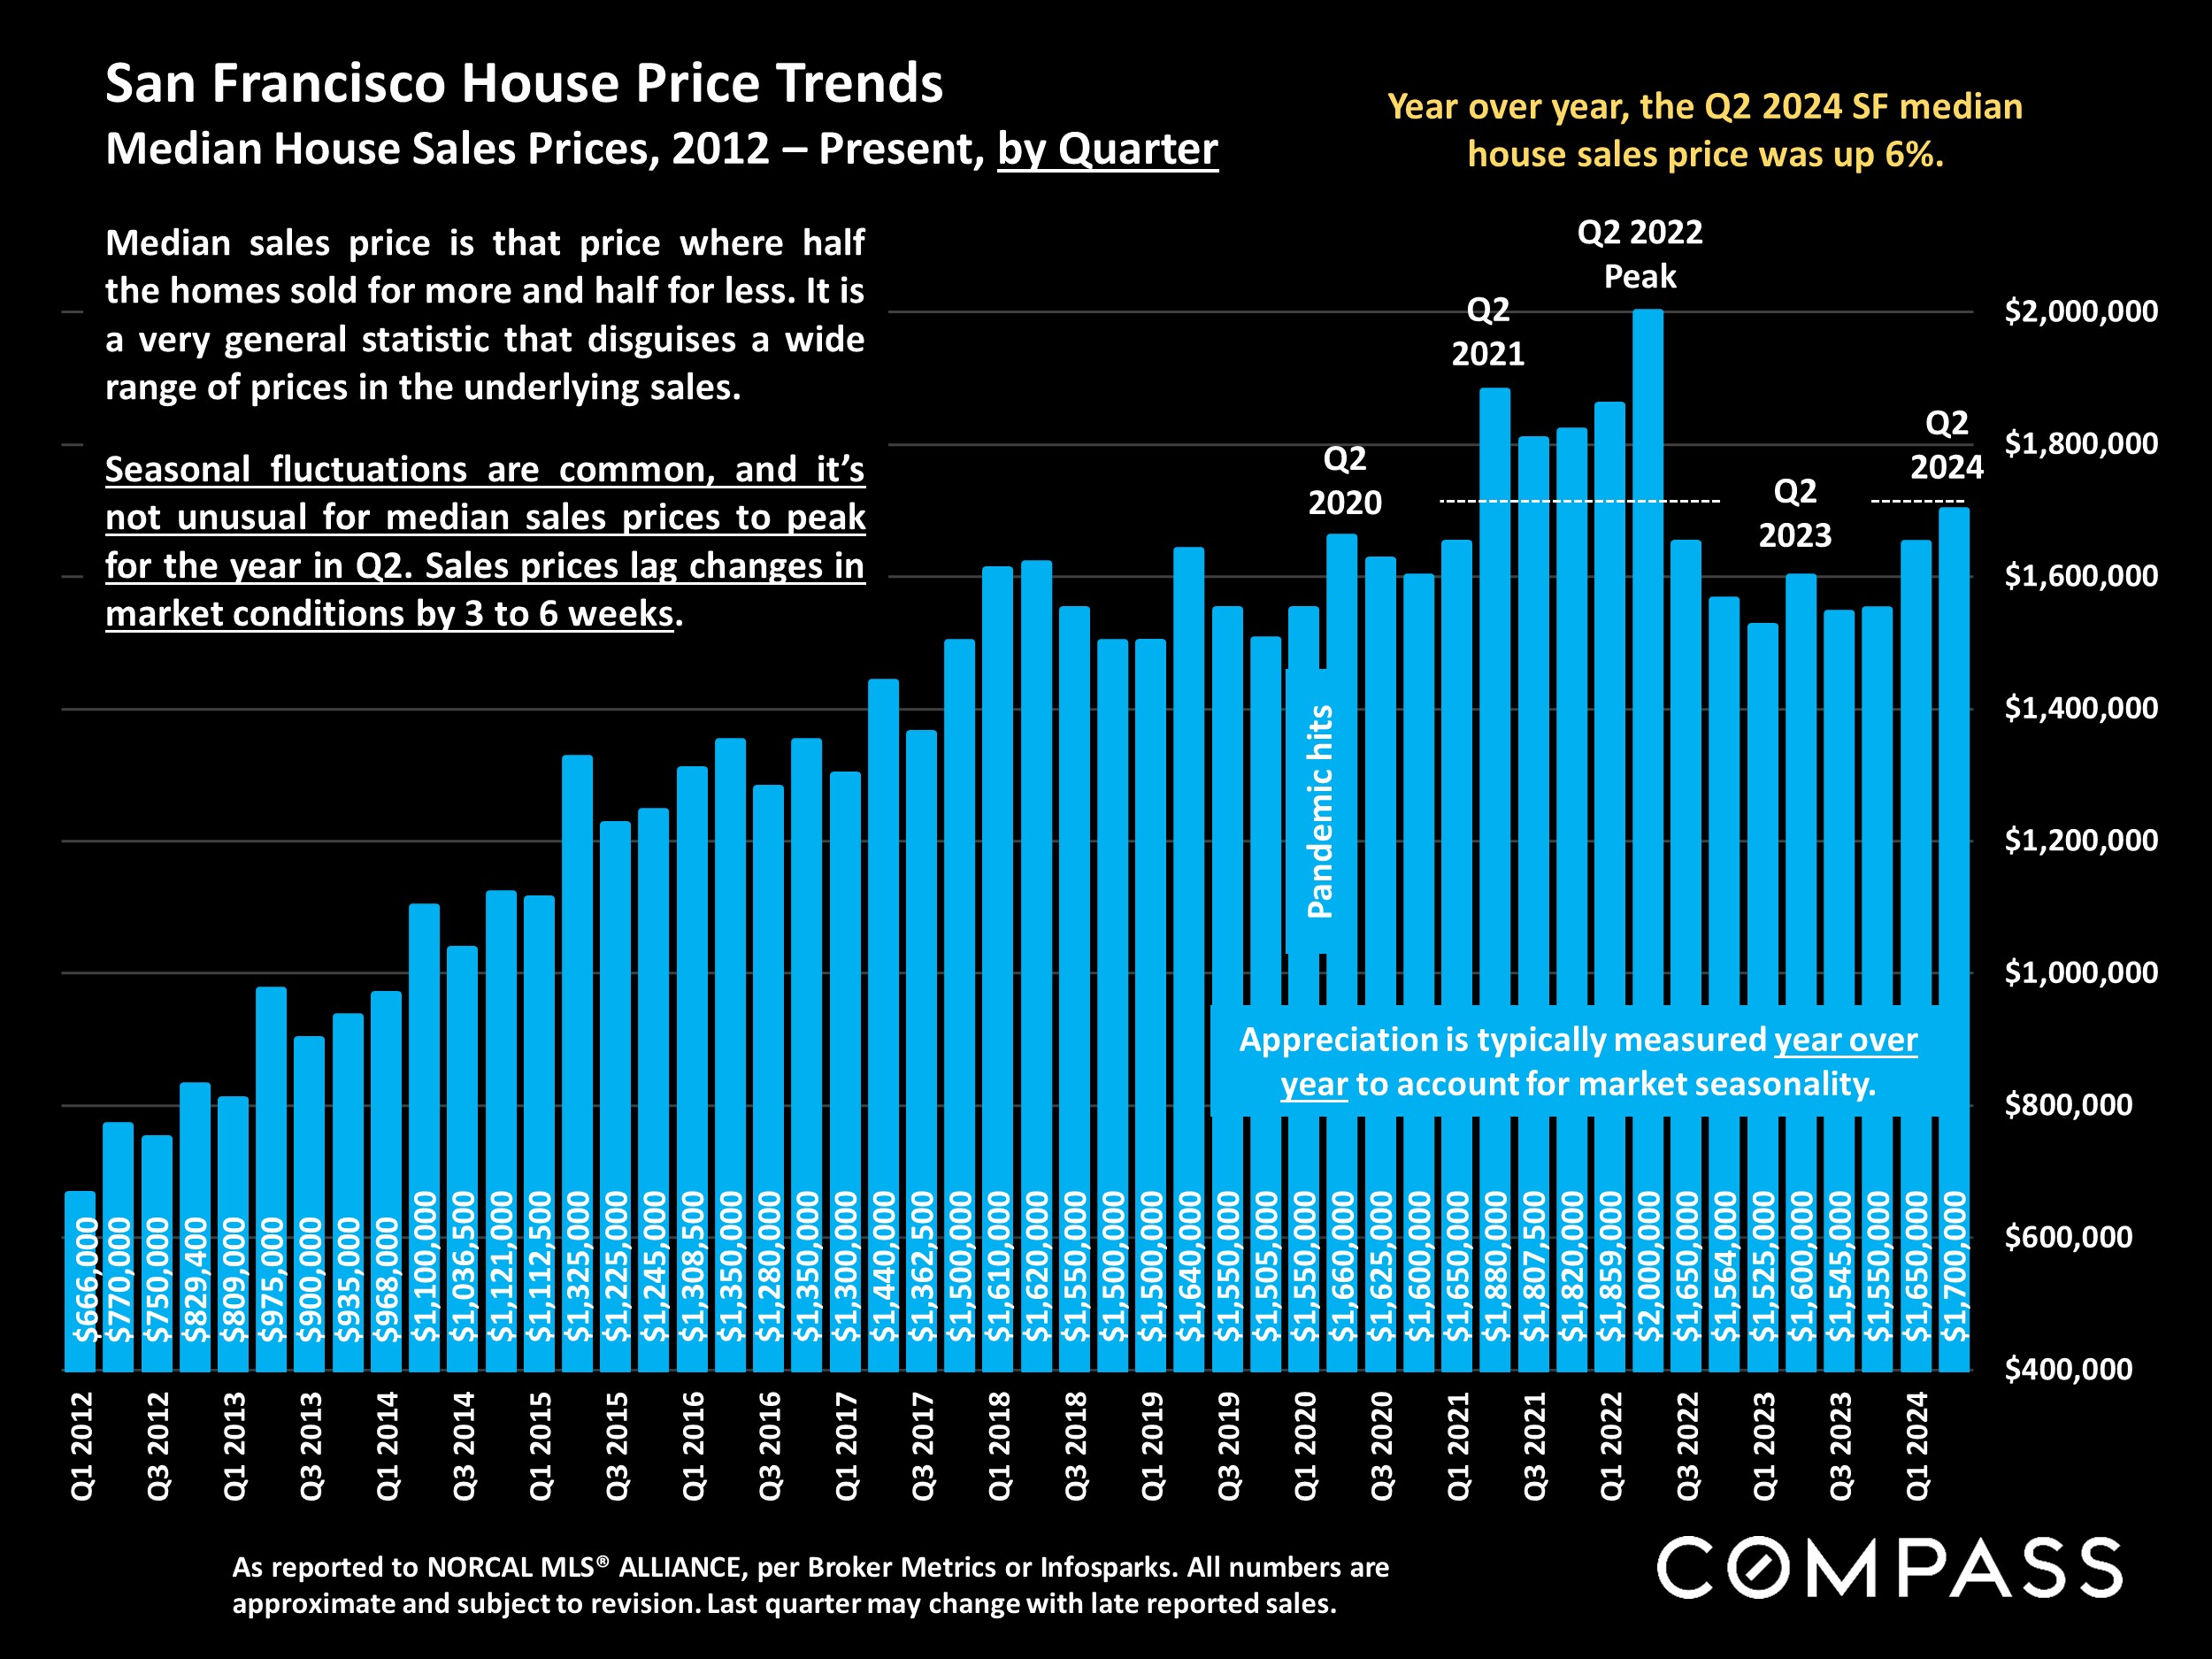
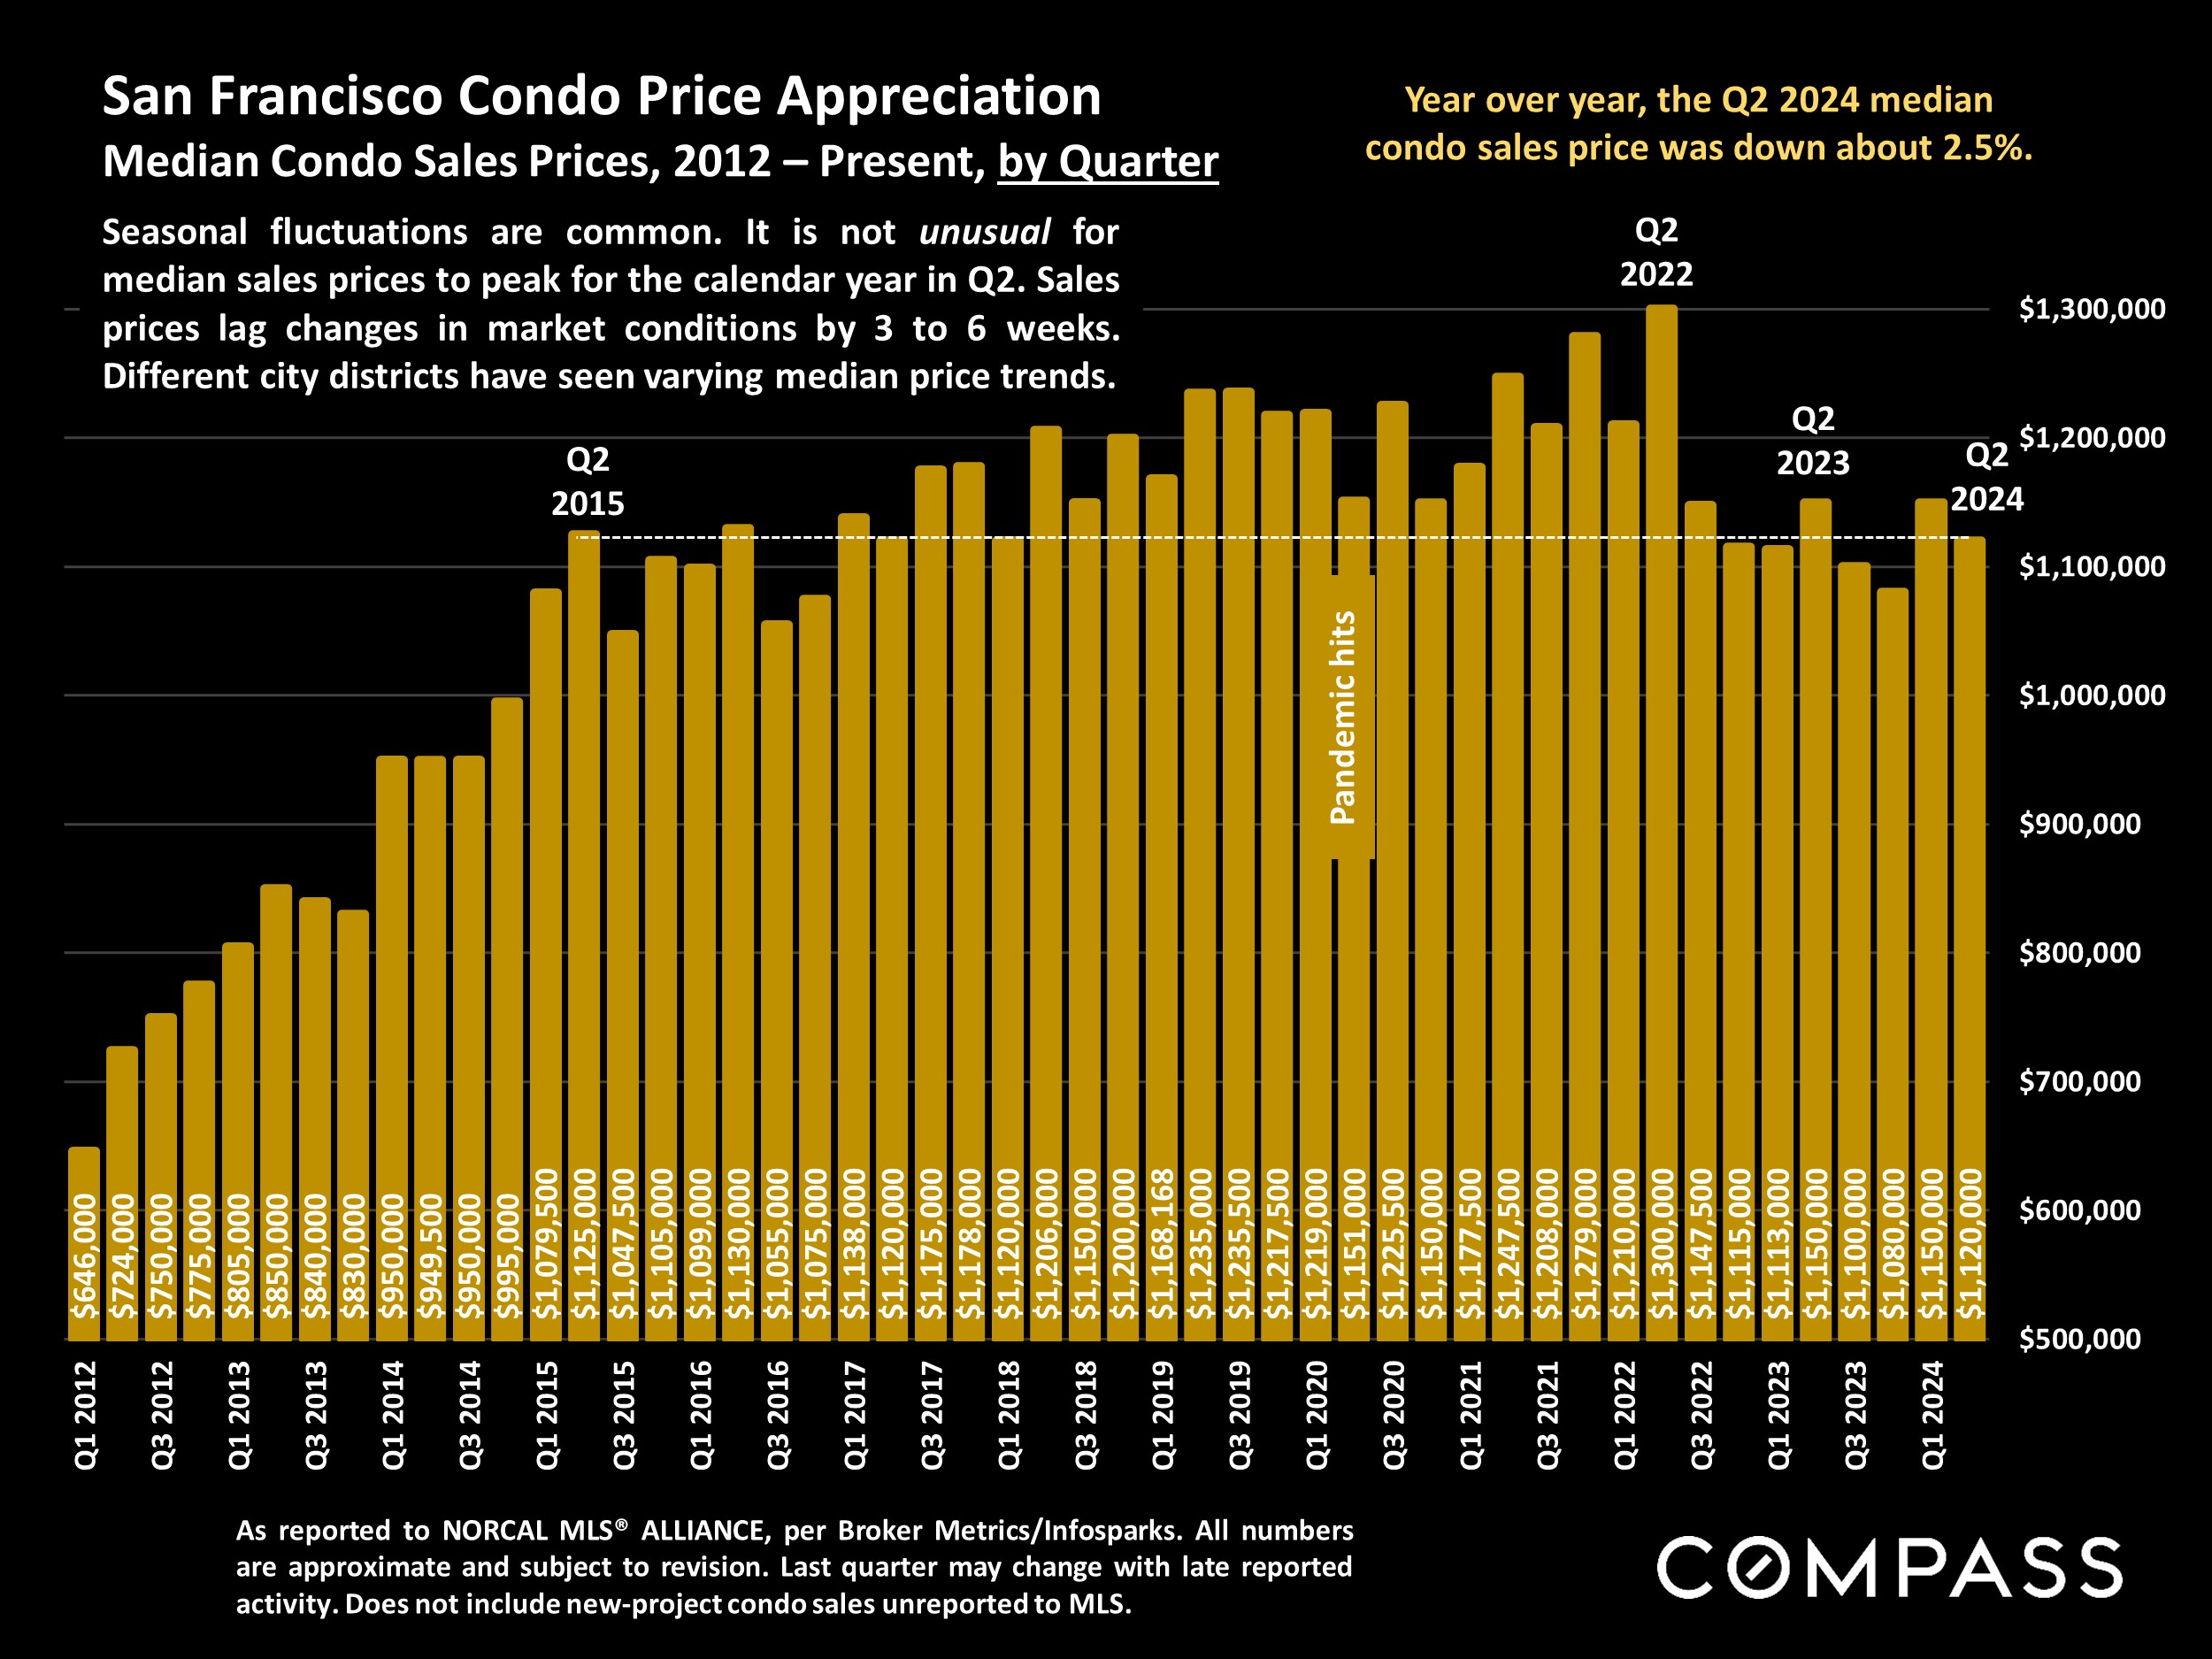
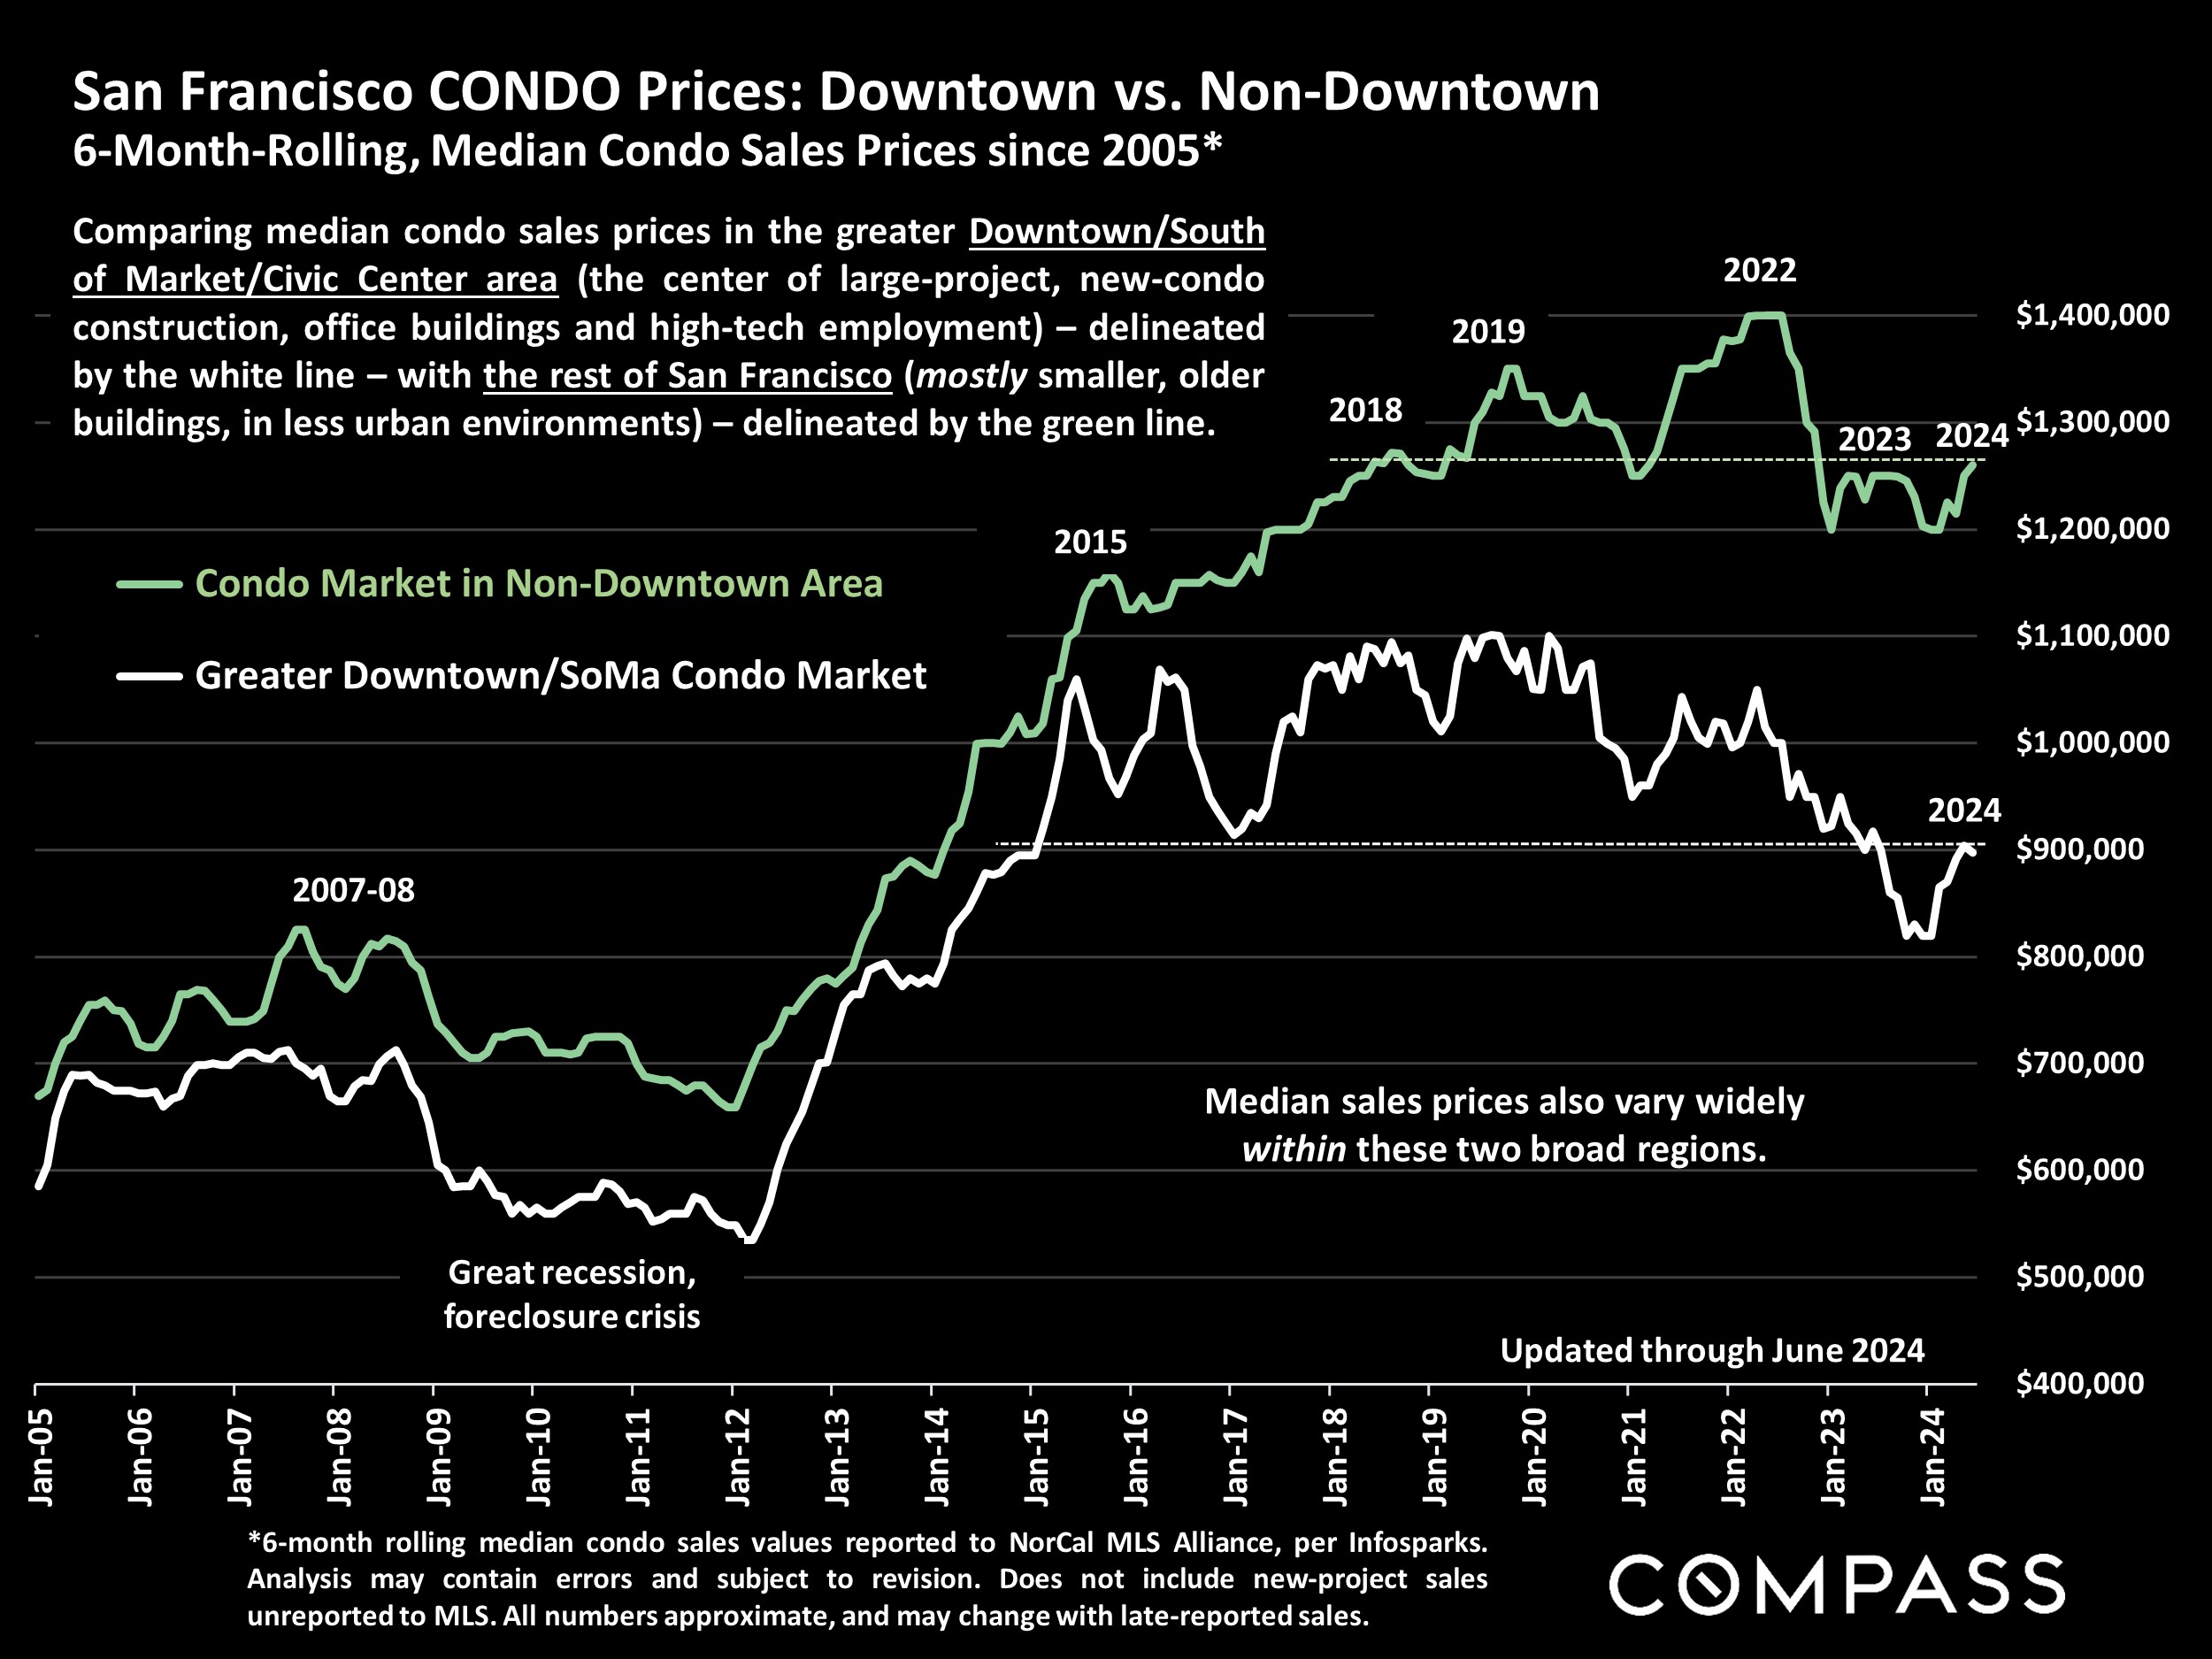
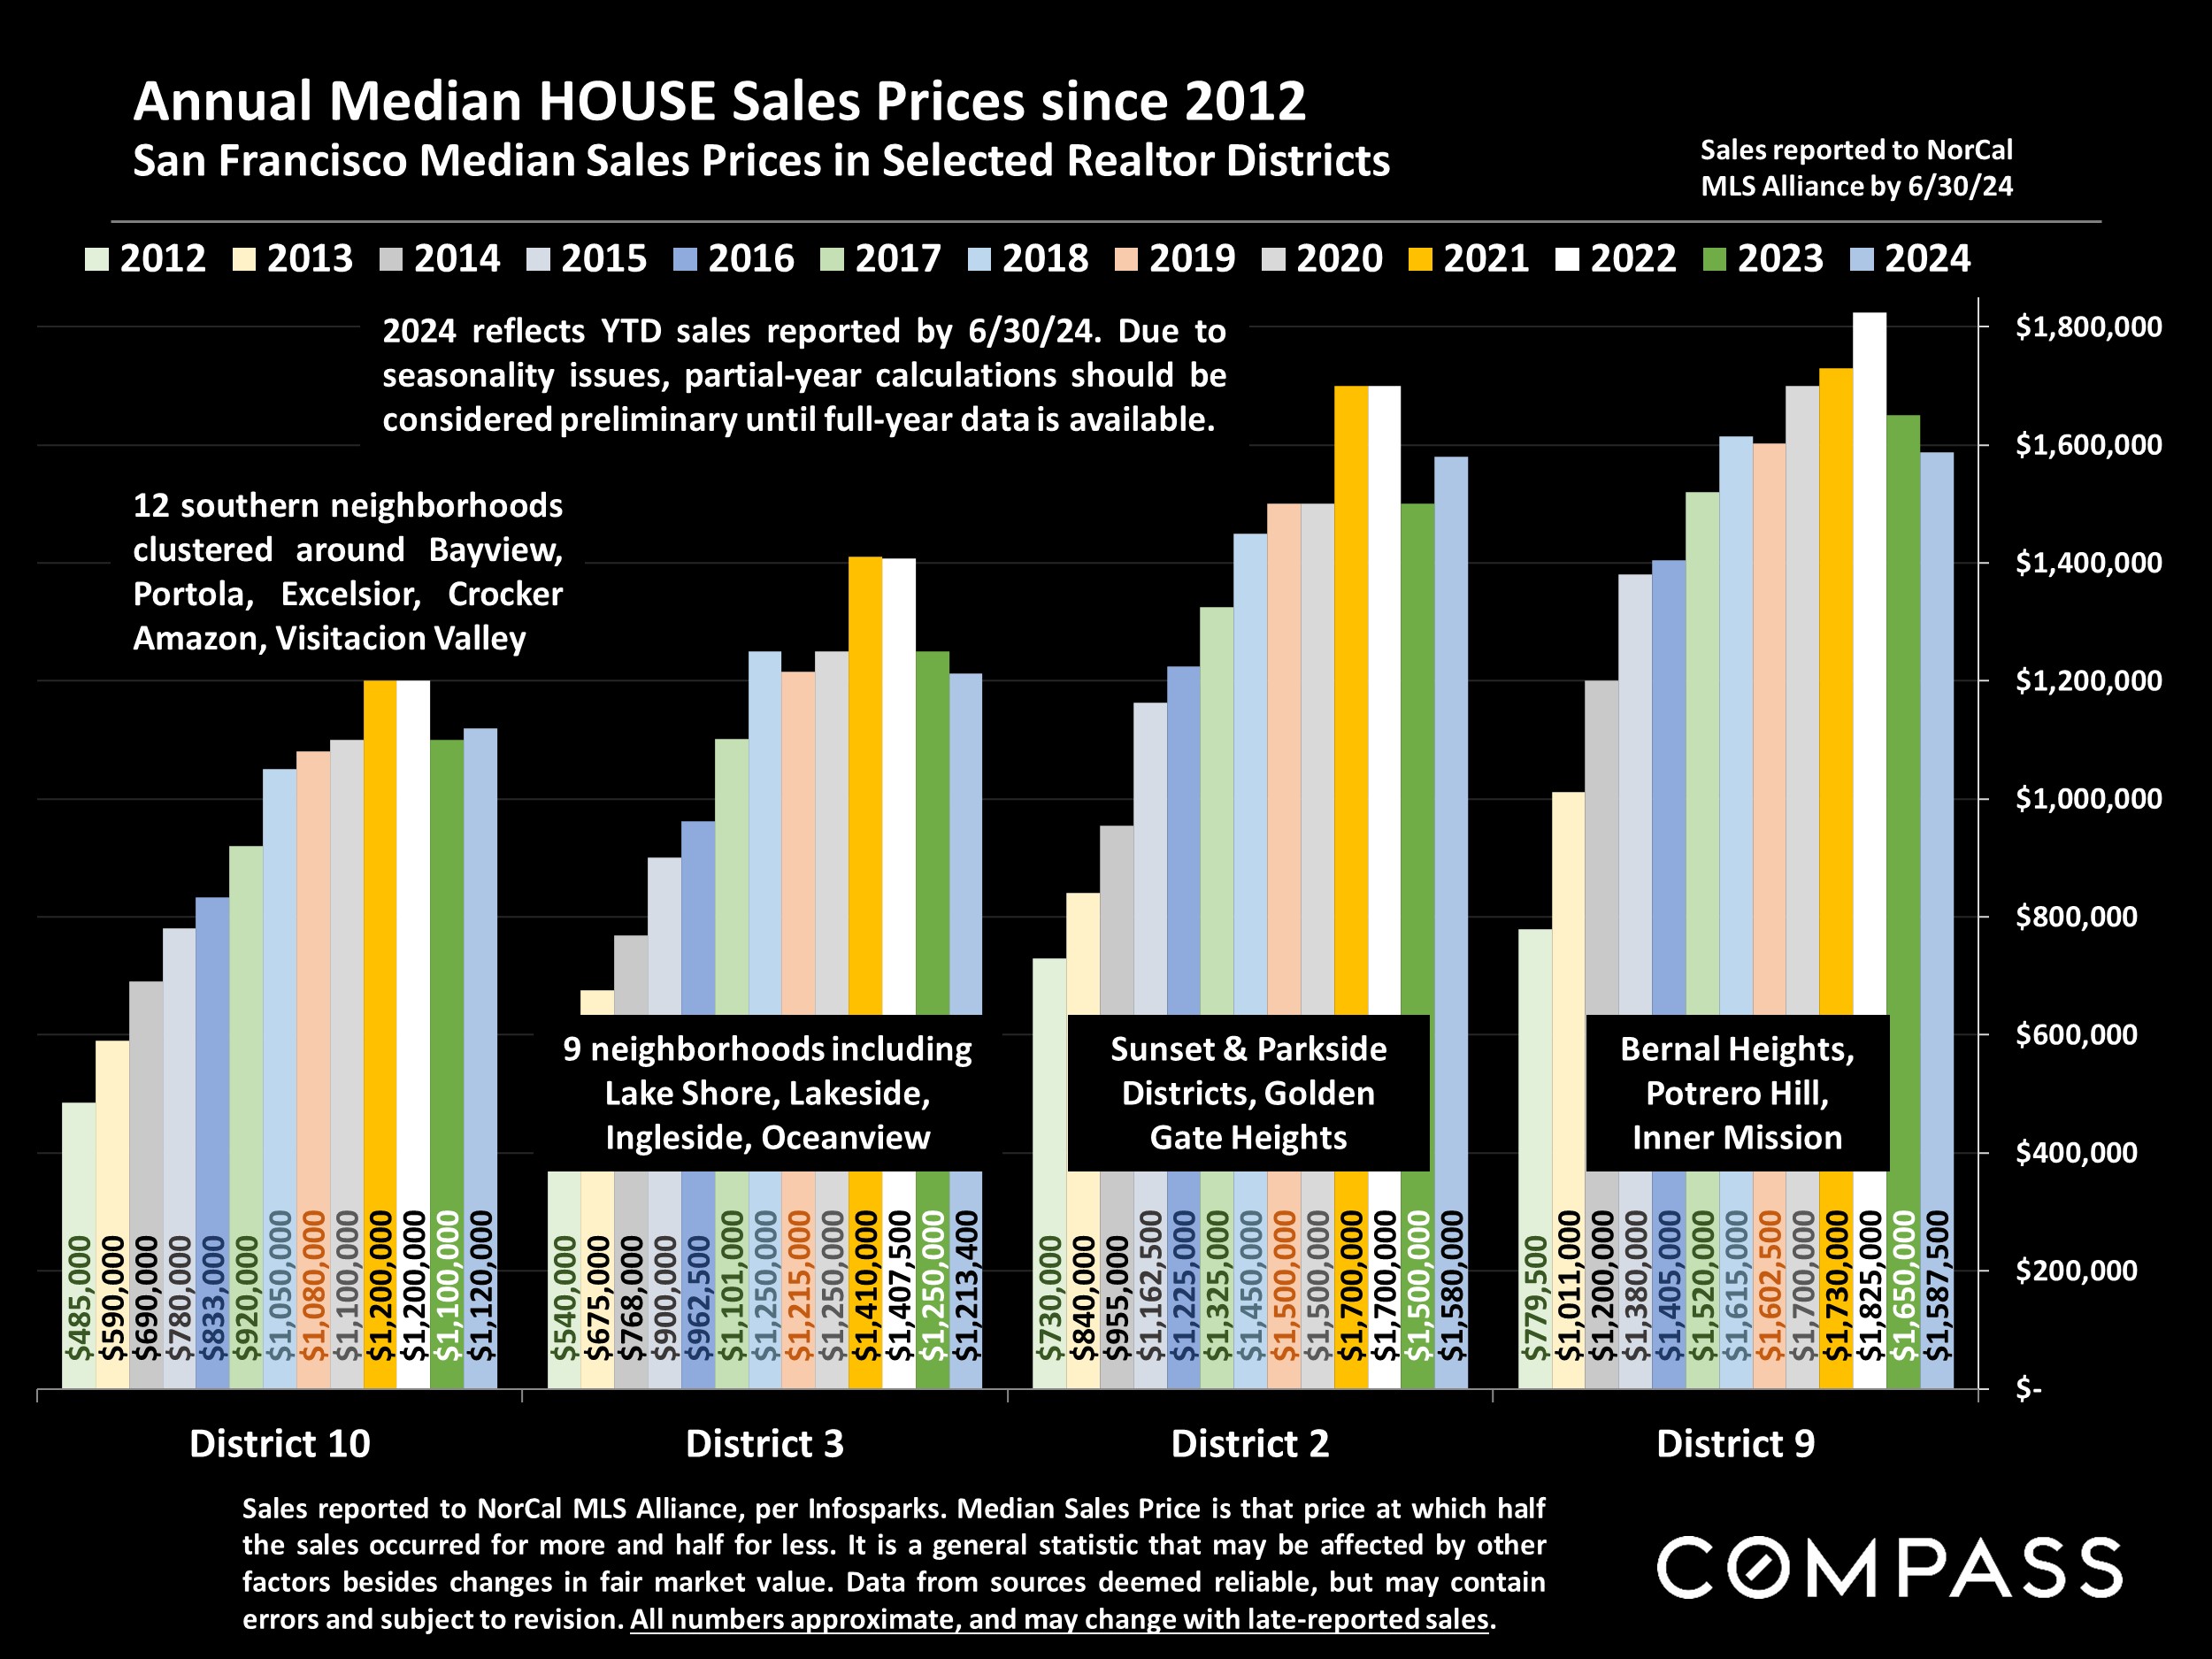
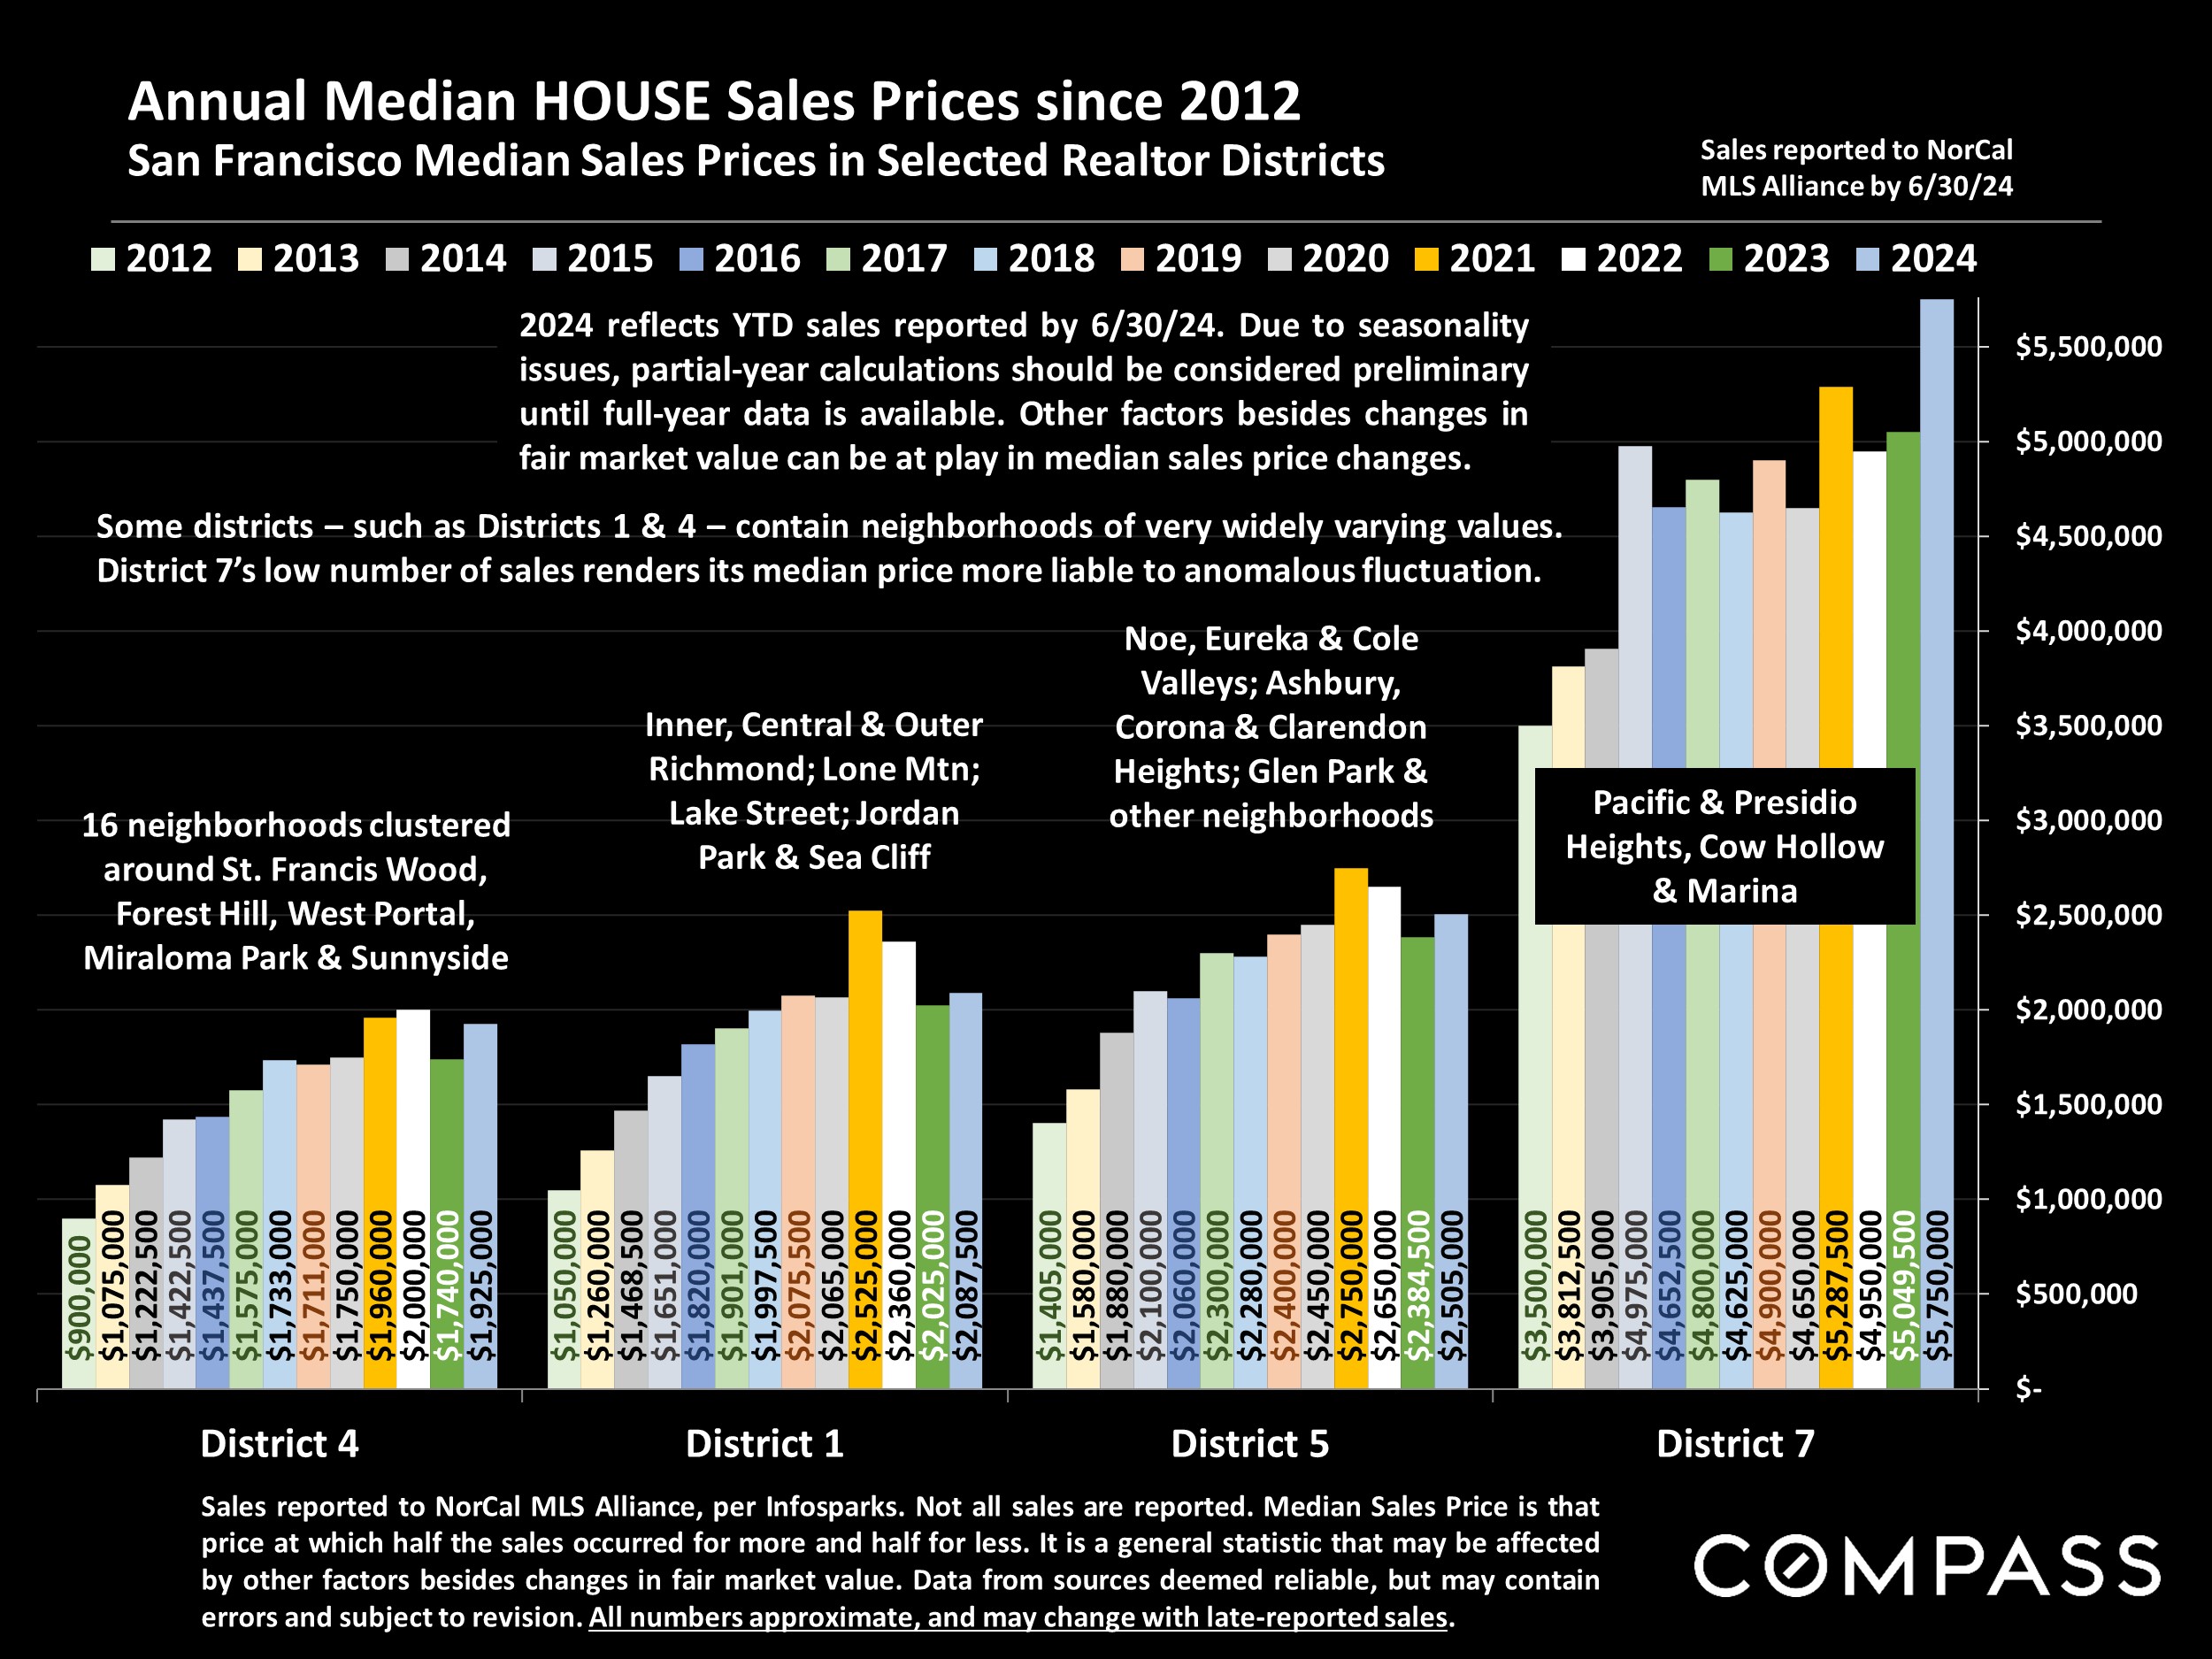
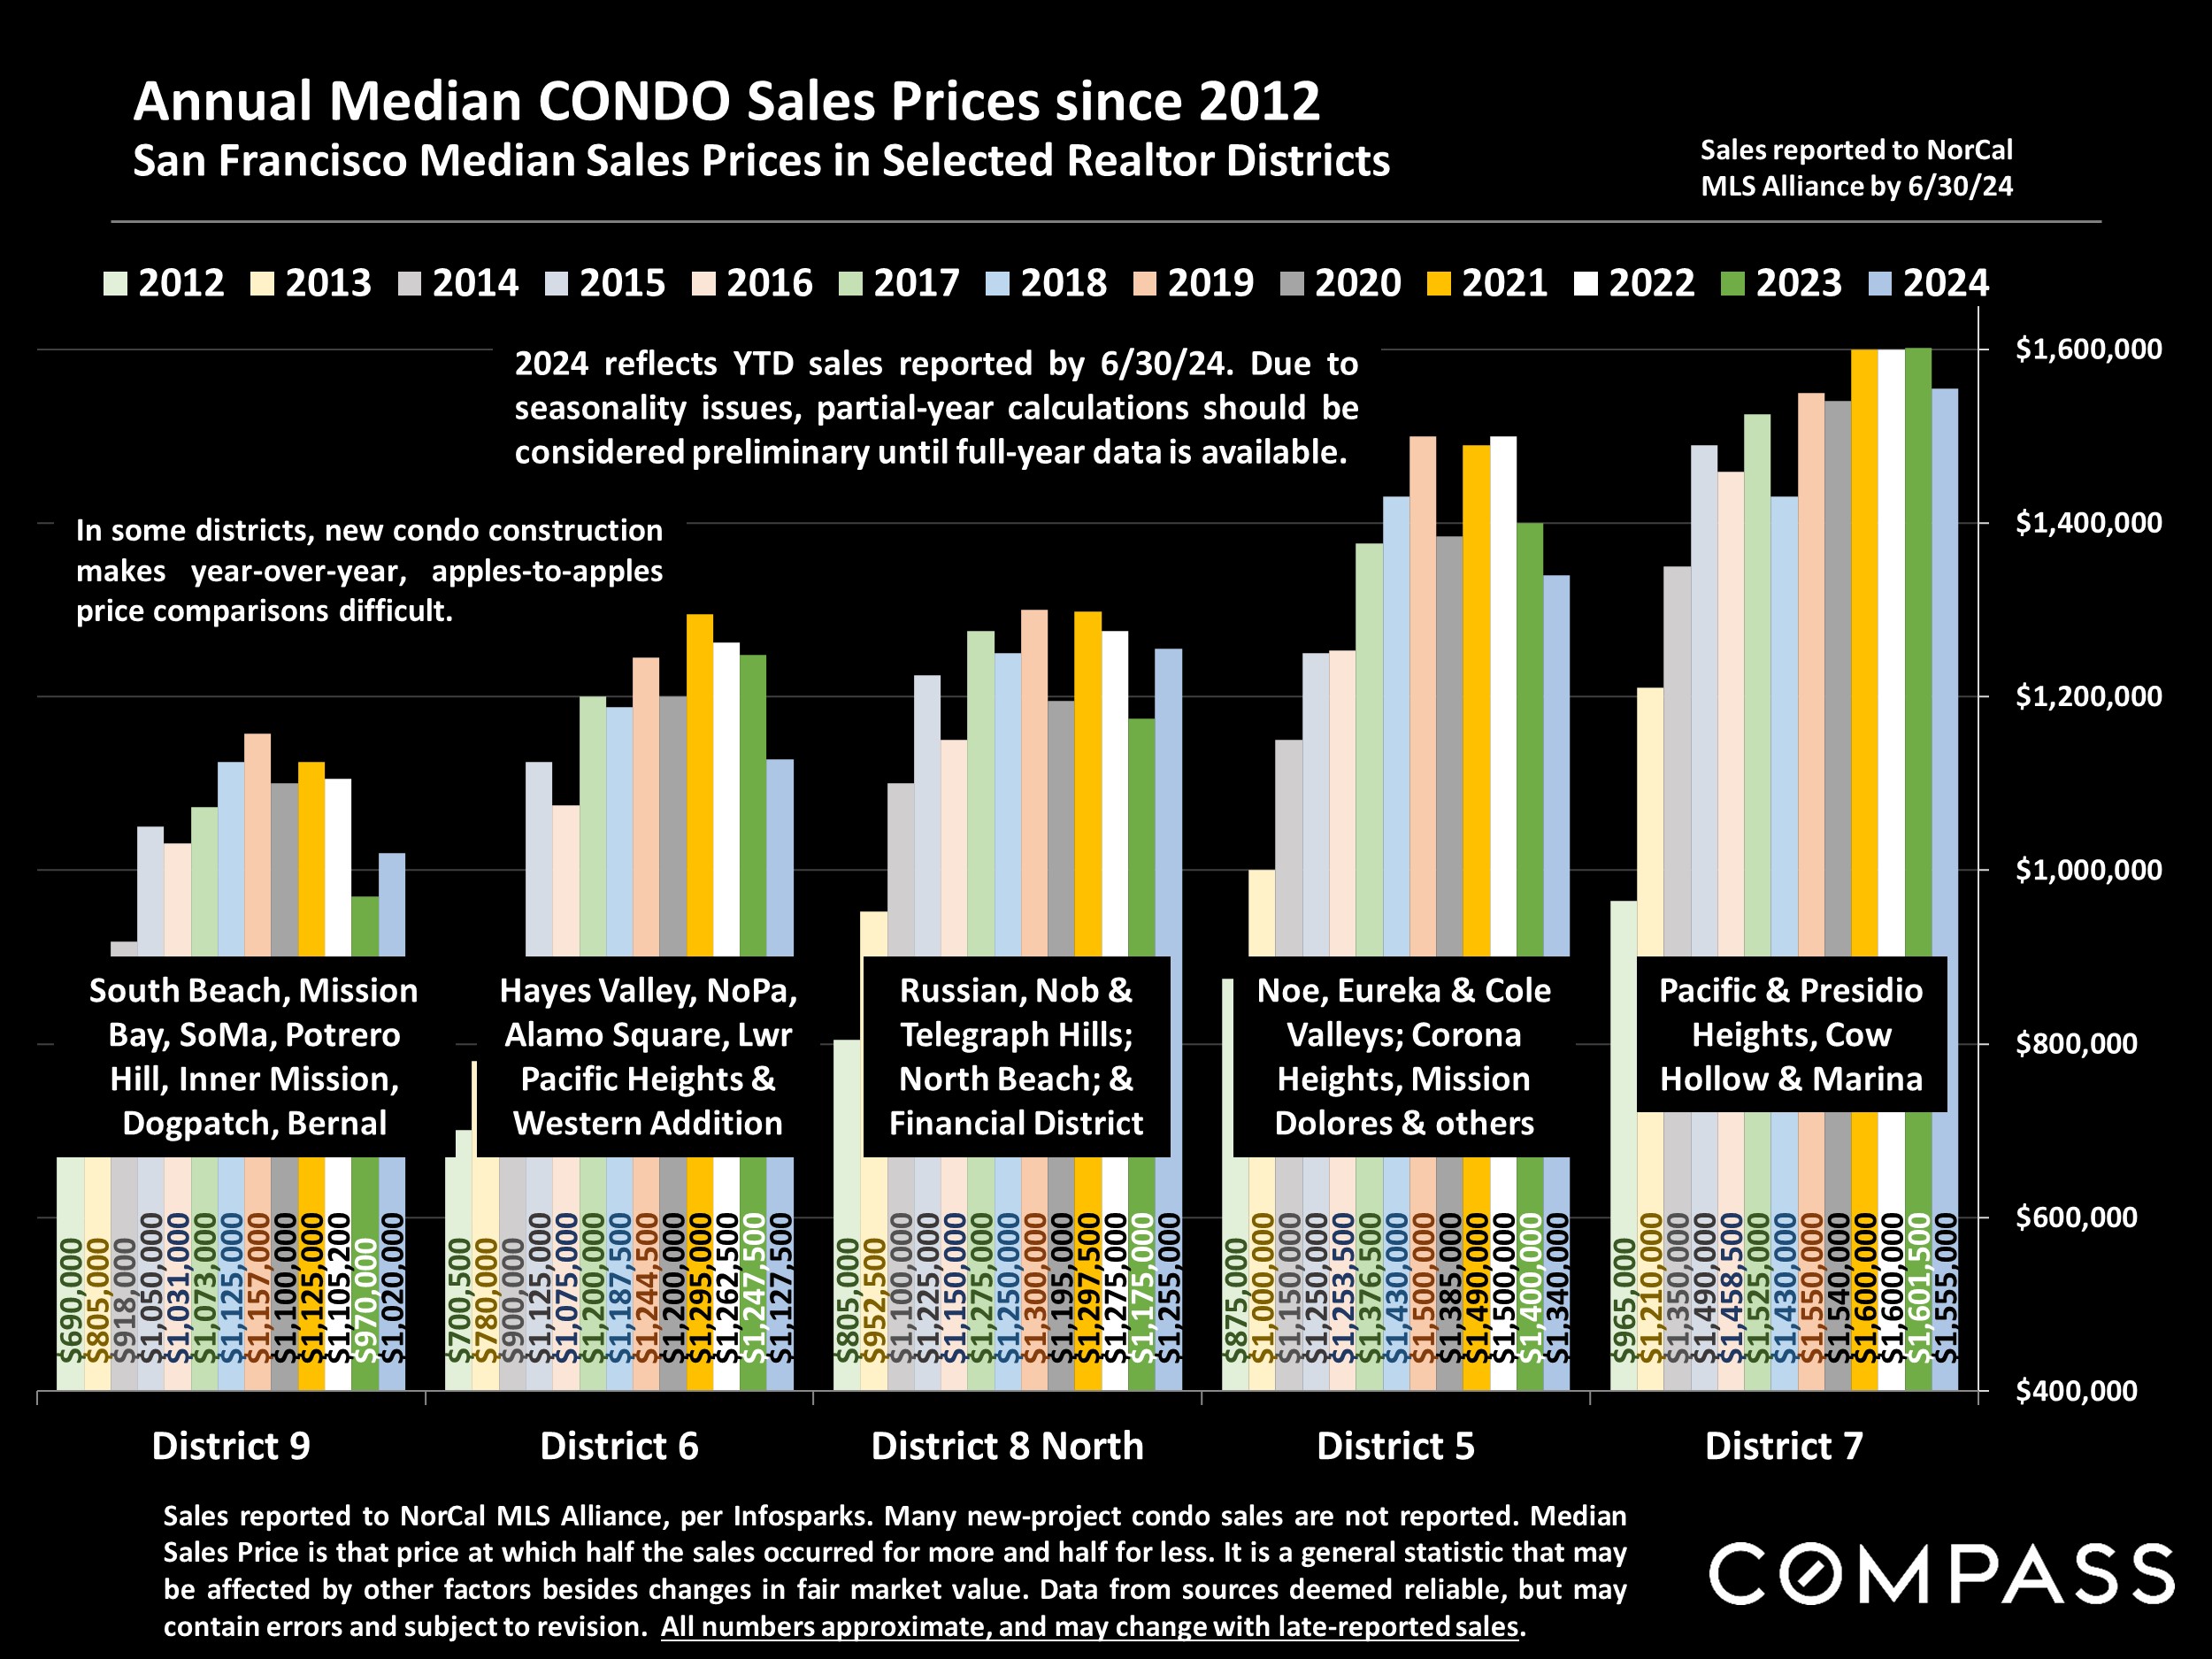
  • The median house sales price in Q2 2024 rose 6% from Q2 2023, while the median condo sales price declined by 2.5%.
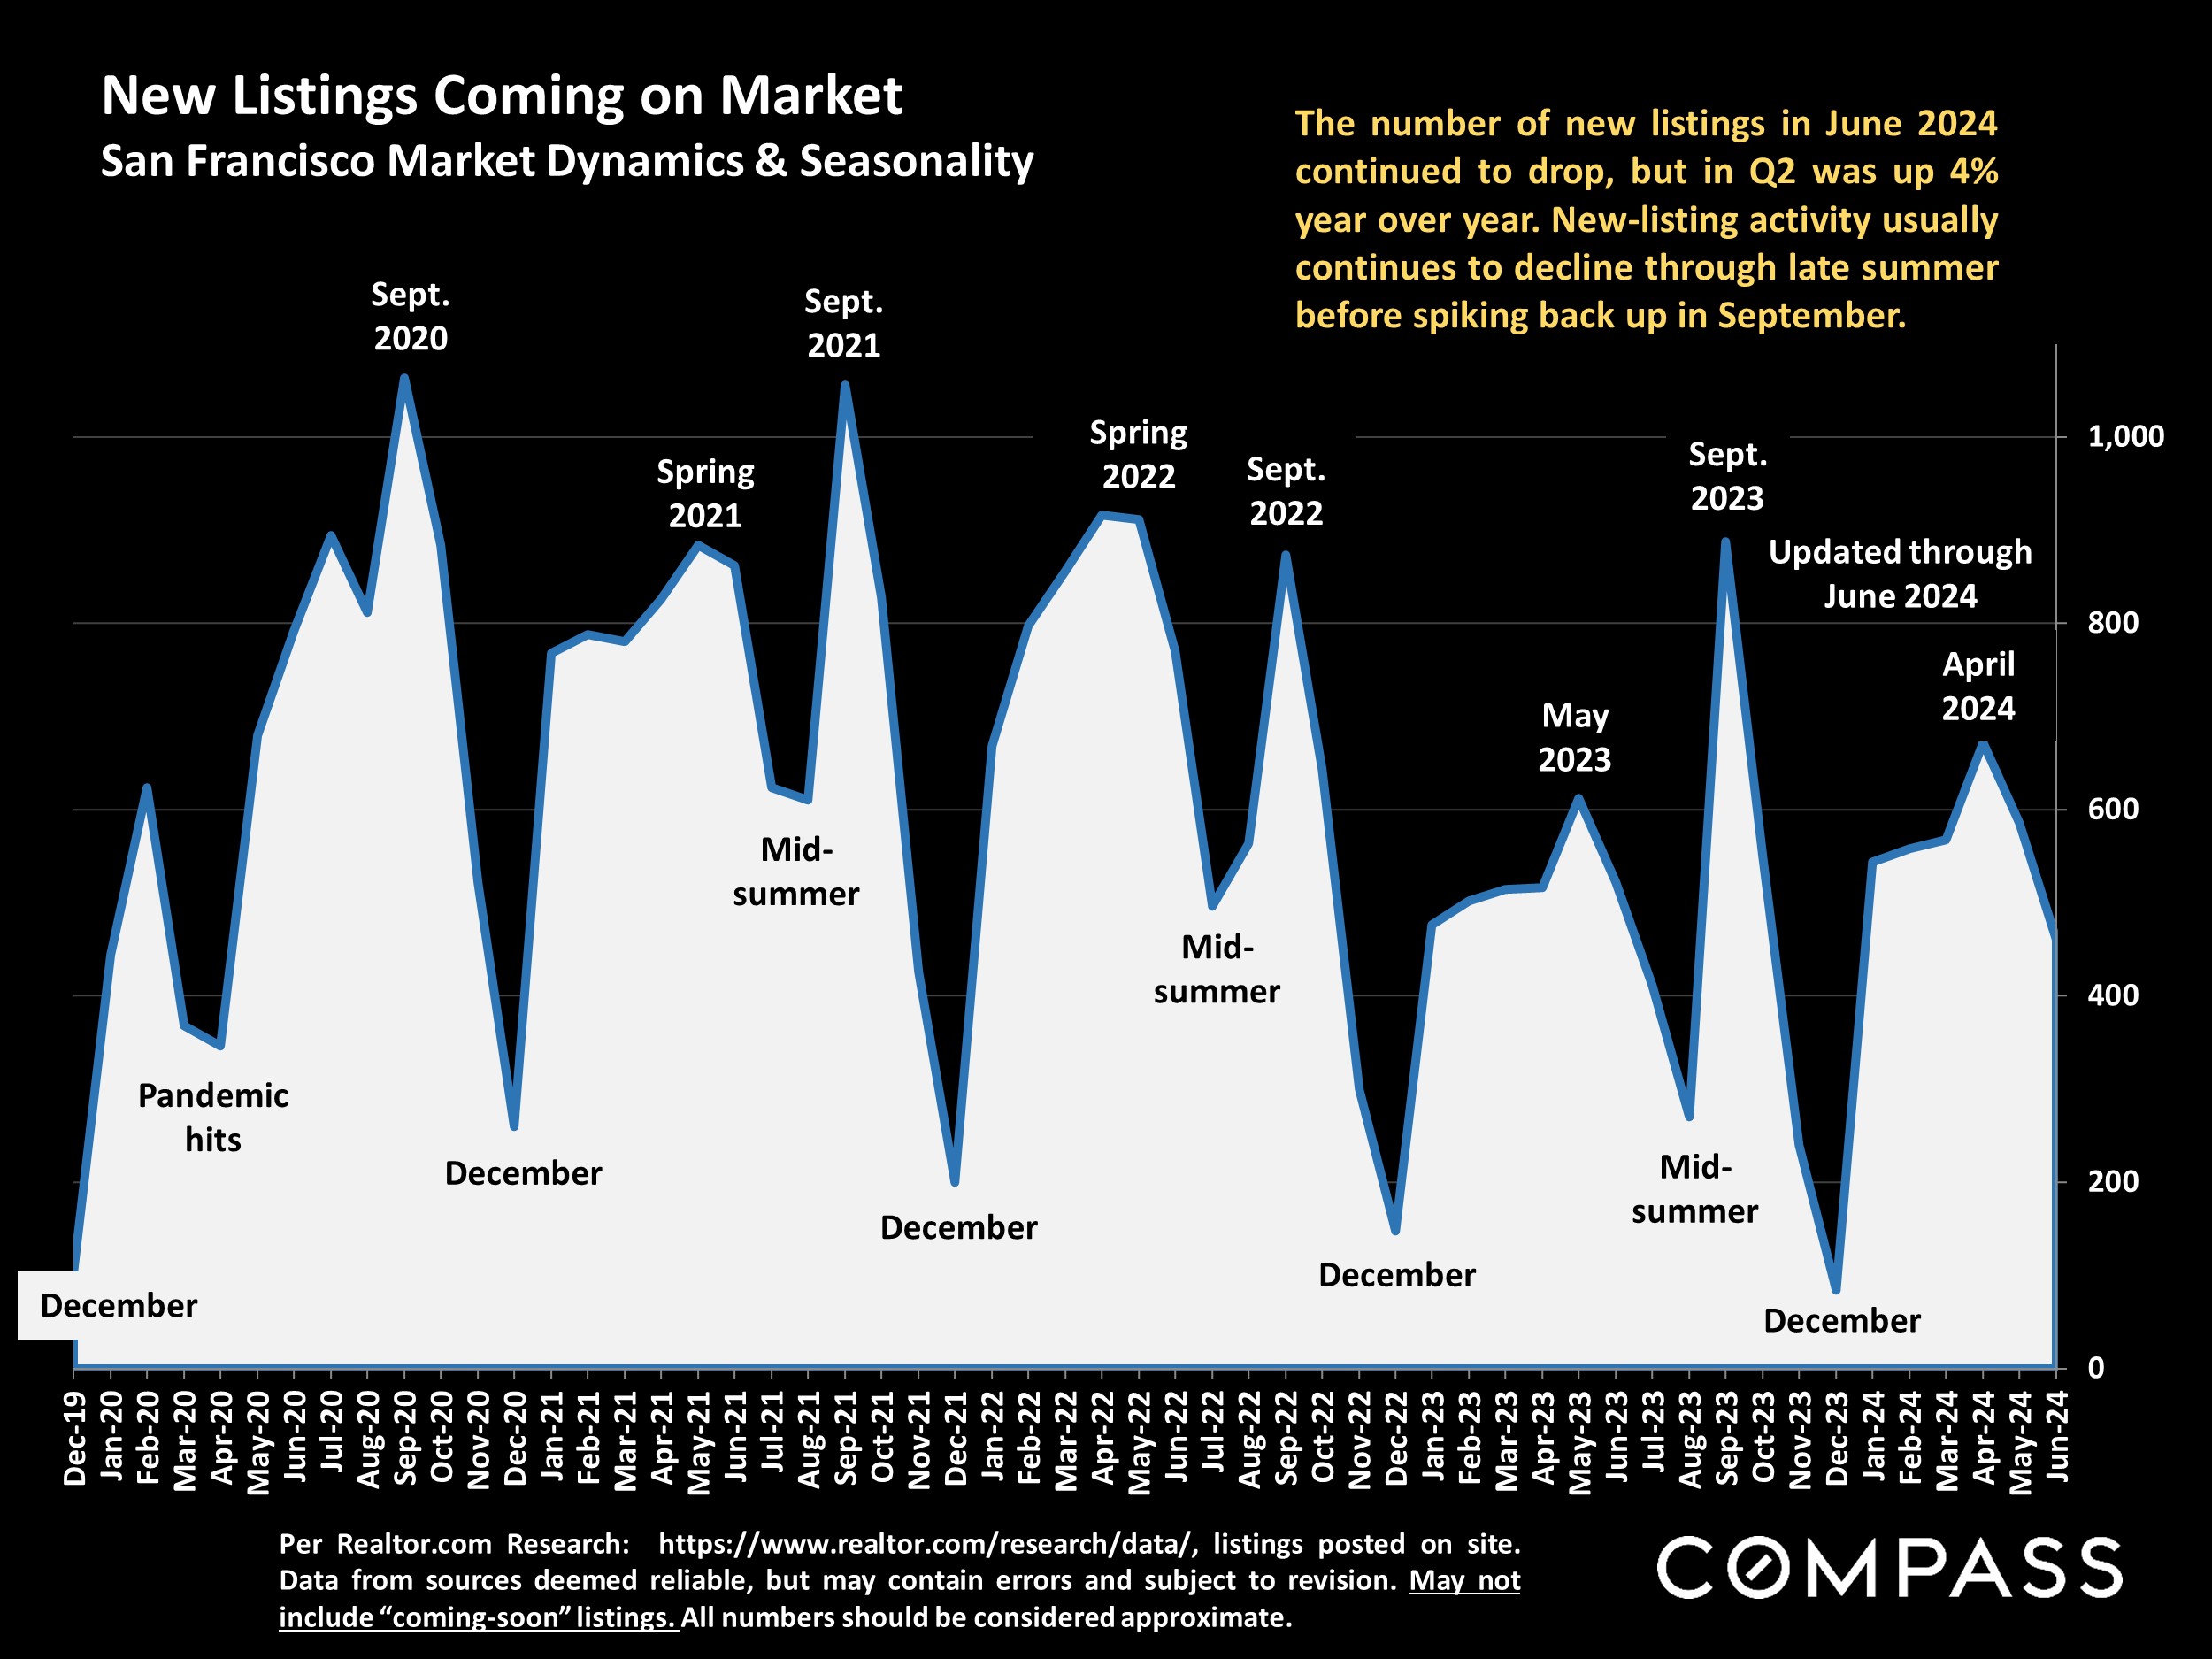
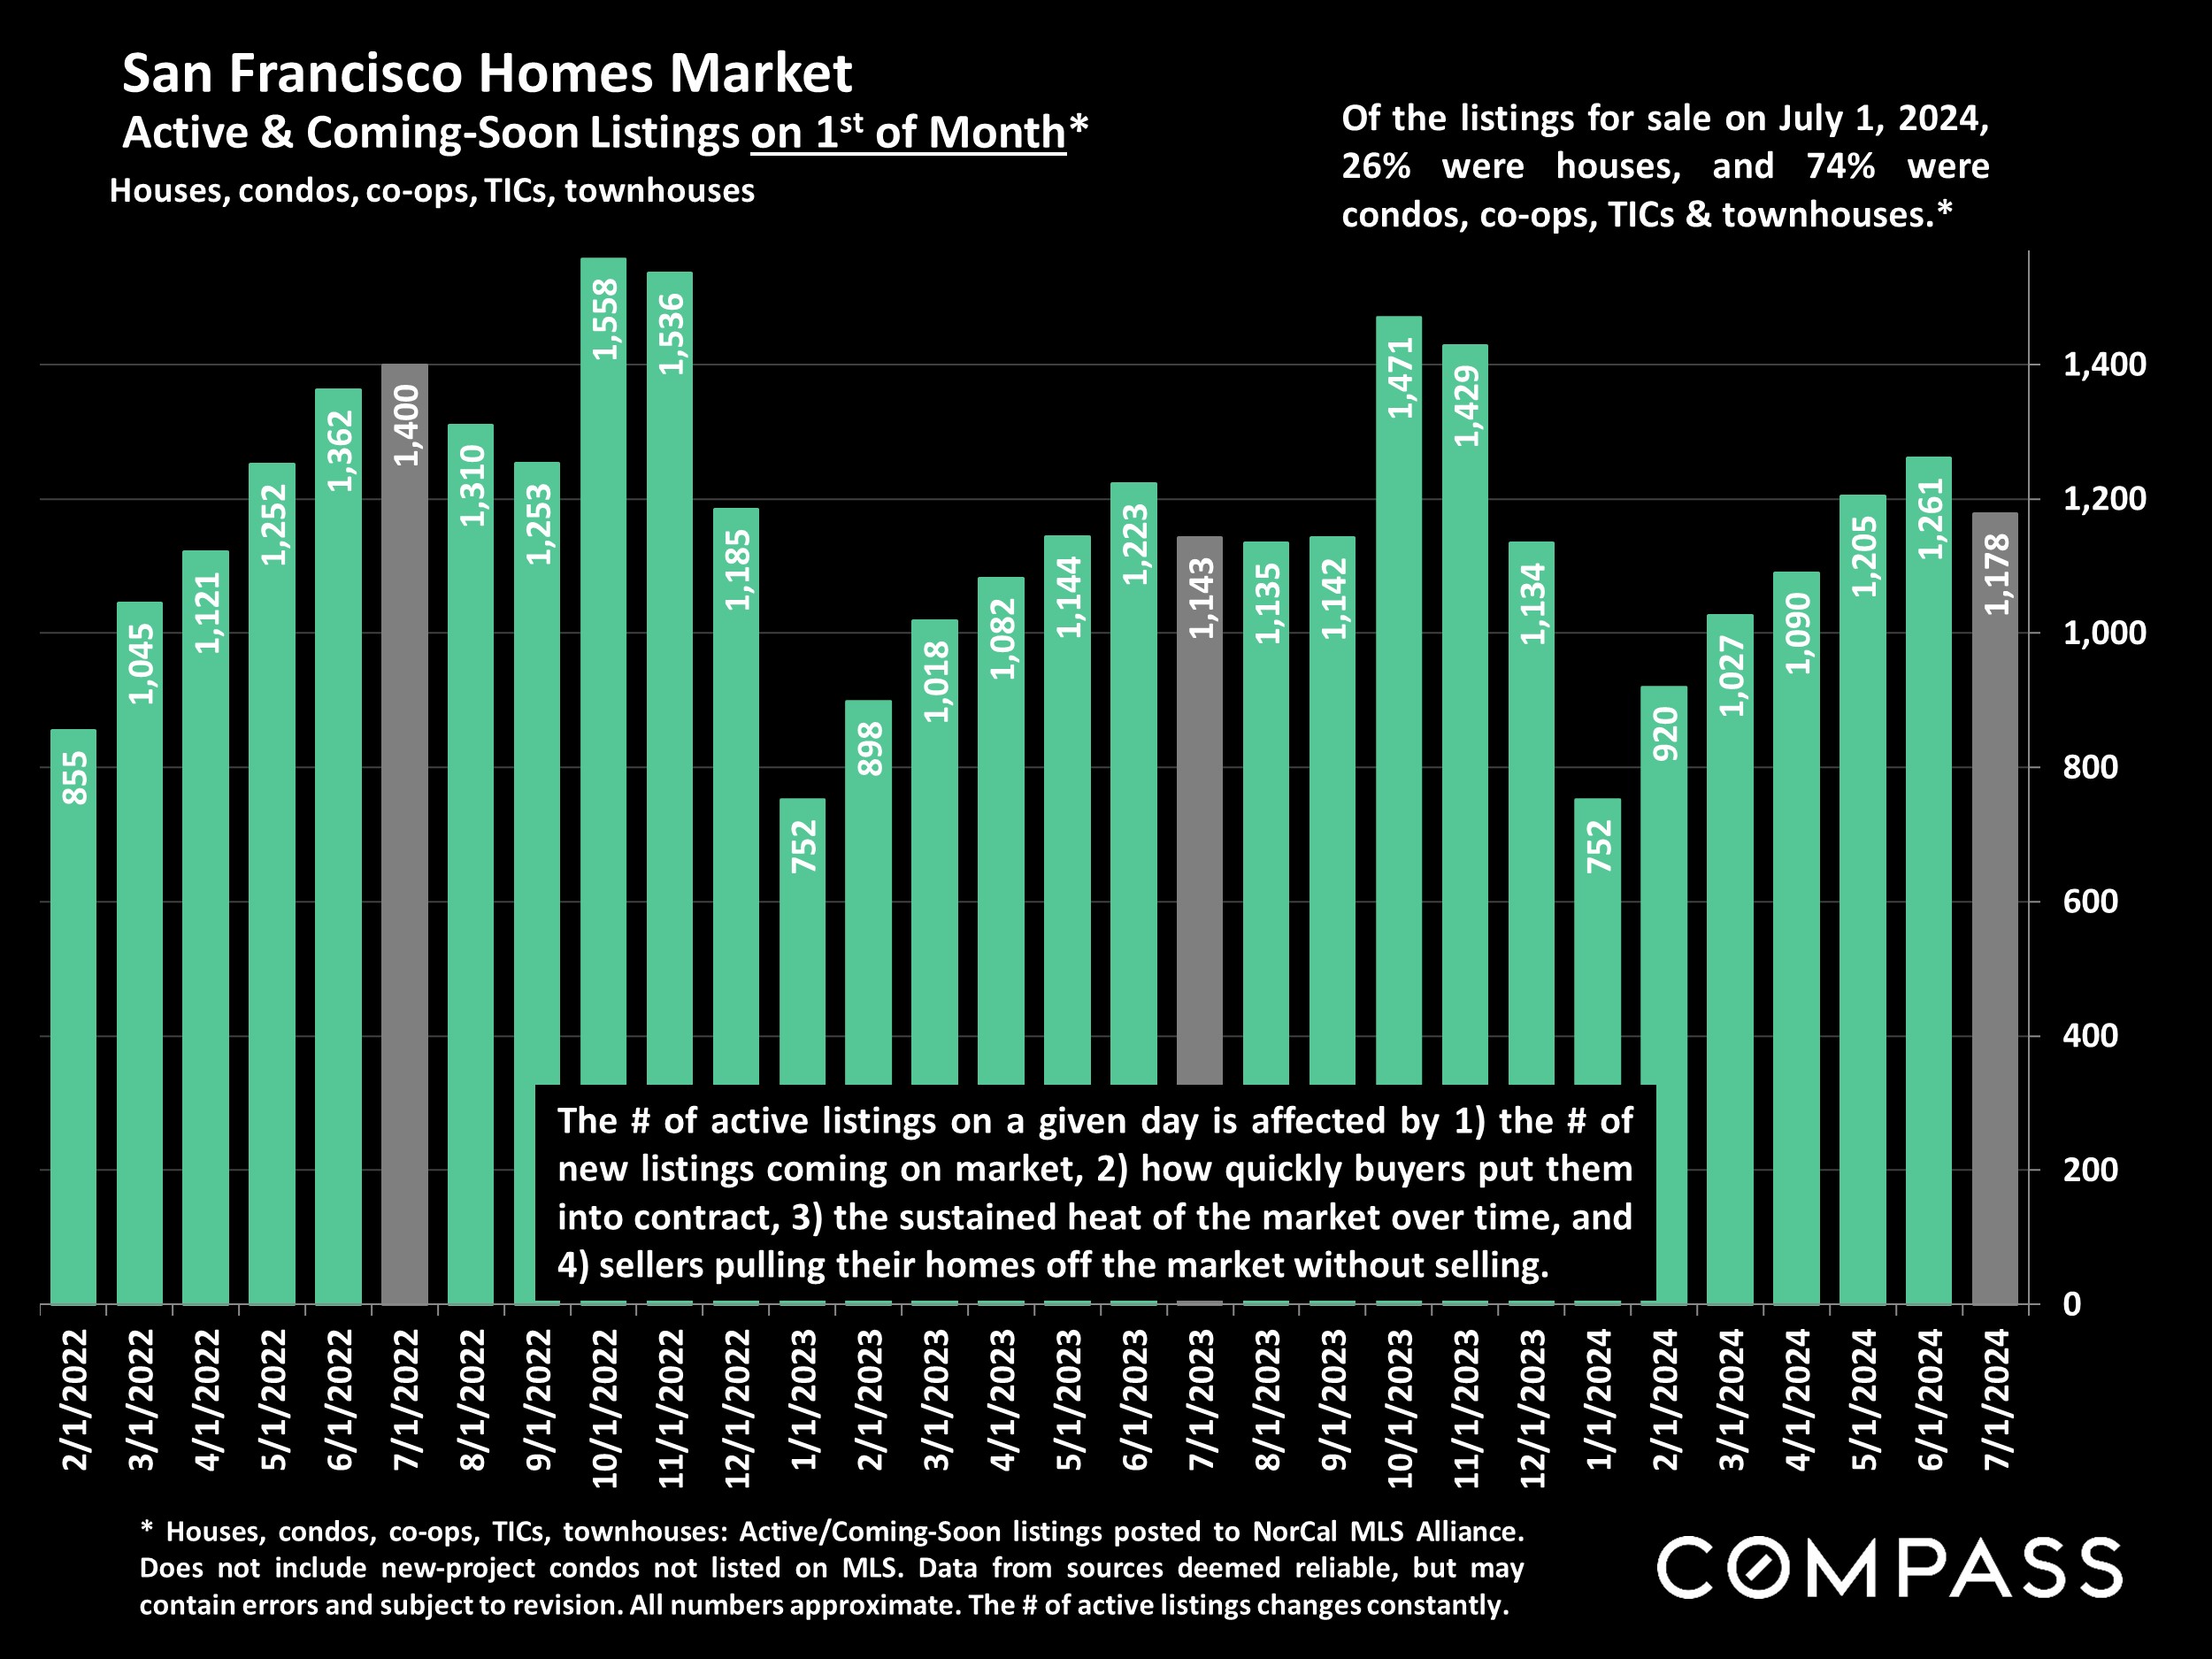
  • The number of homes for sale on July 1st rose 3% year over year. San Francisco has, so far, not seen the large increases in listings in 2024 common in other Bay Area counties.
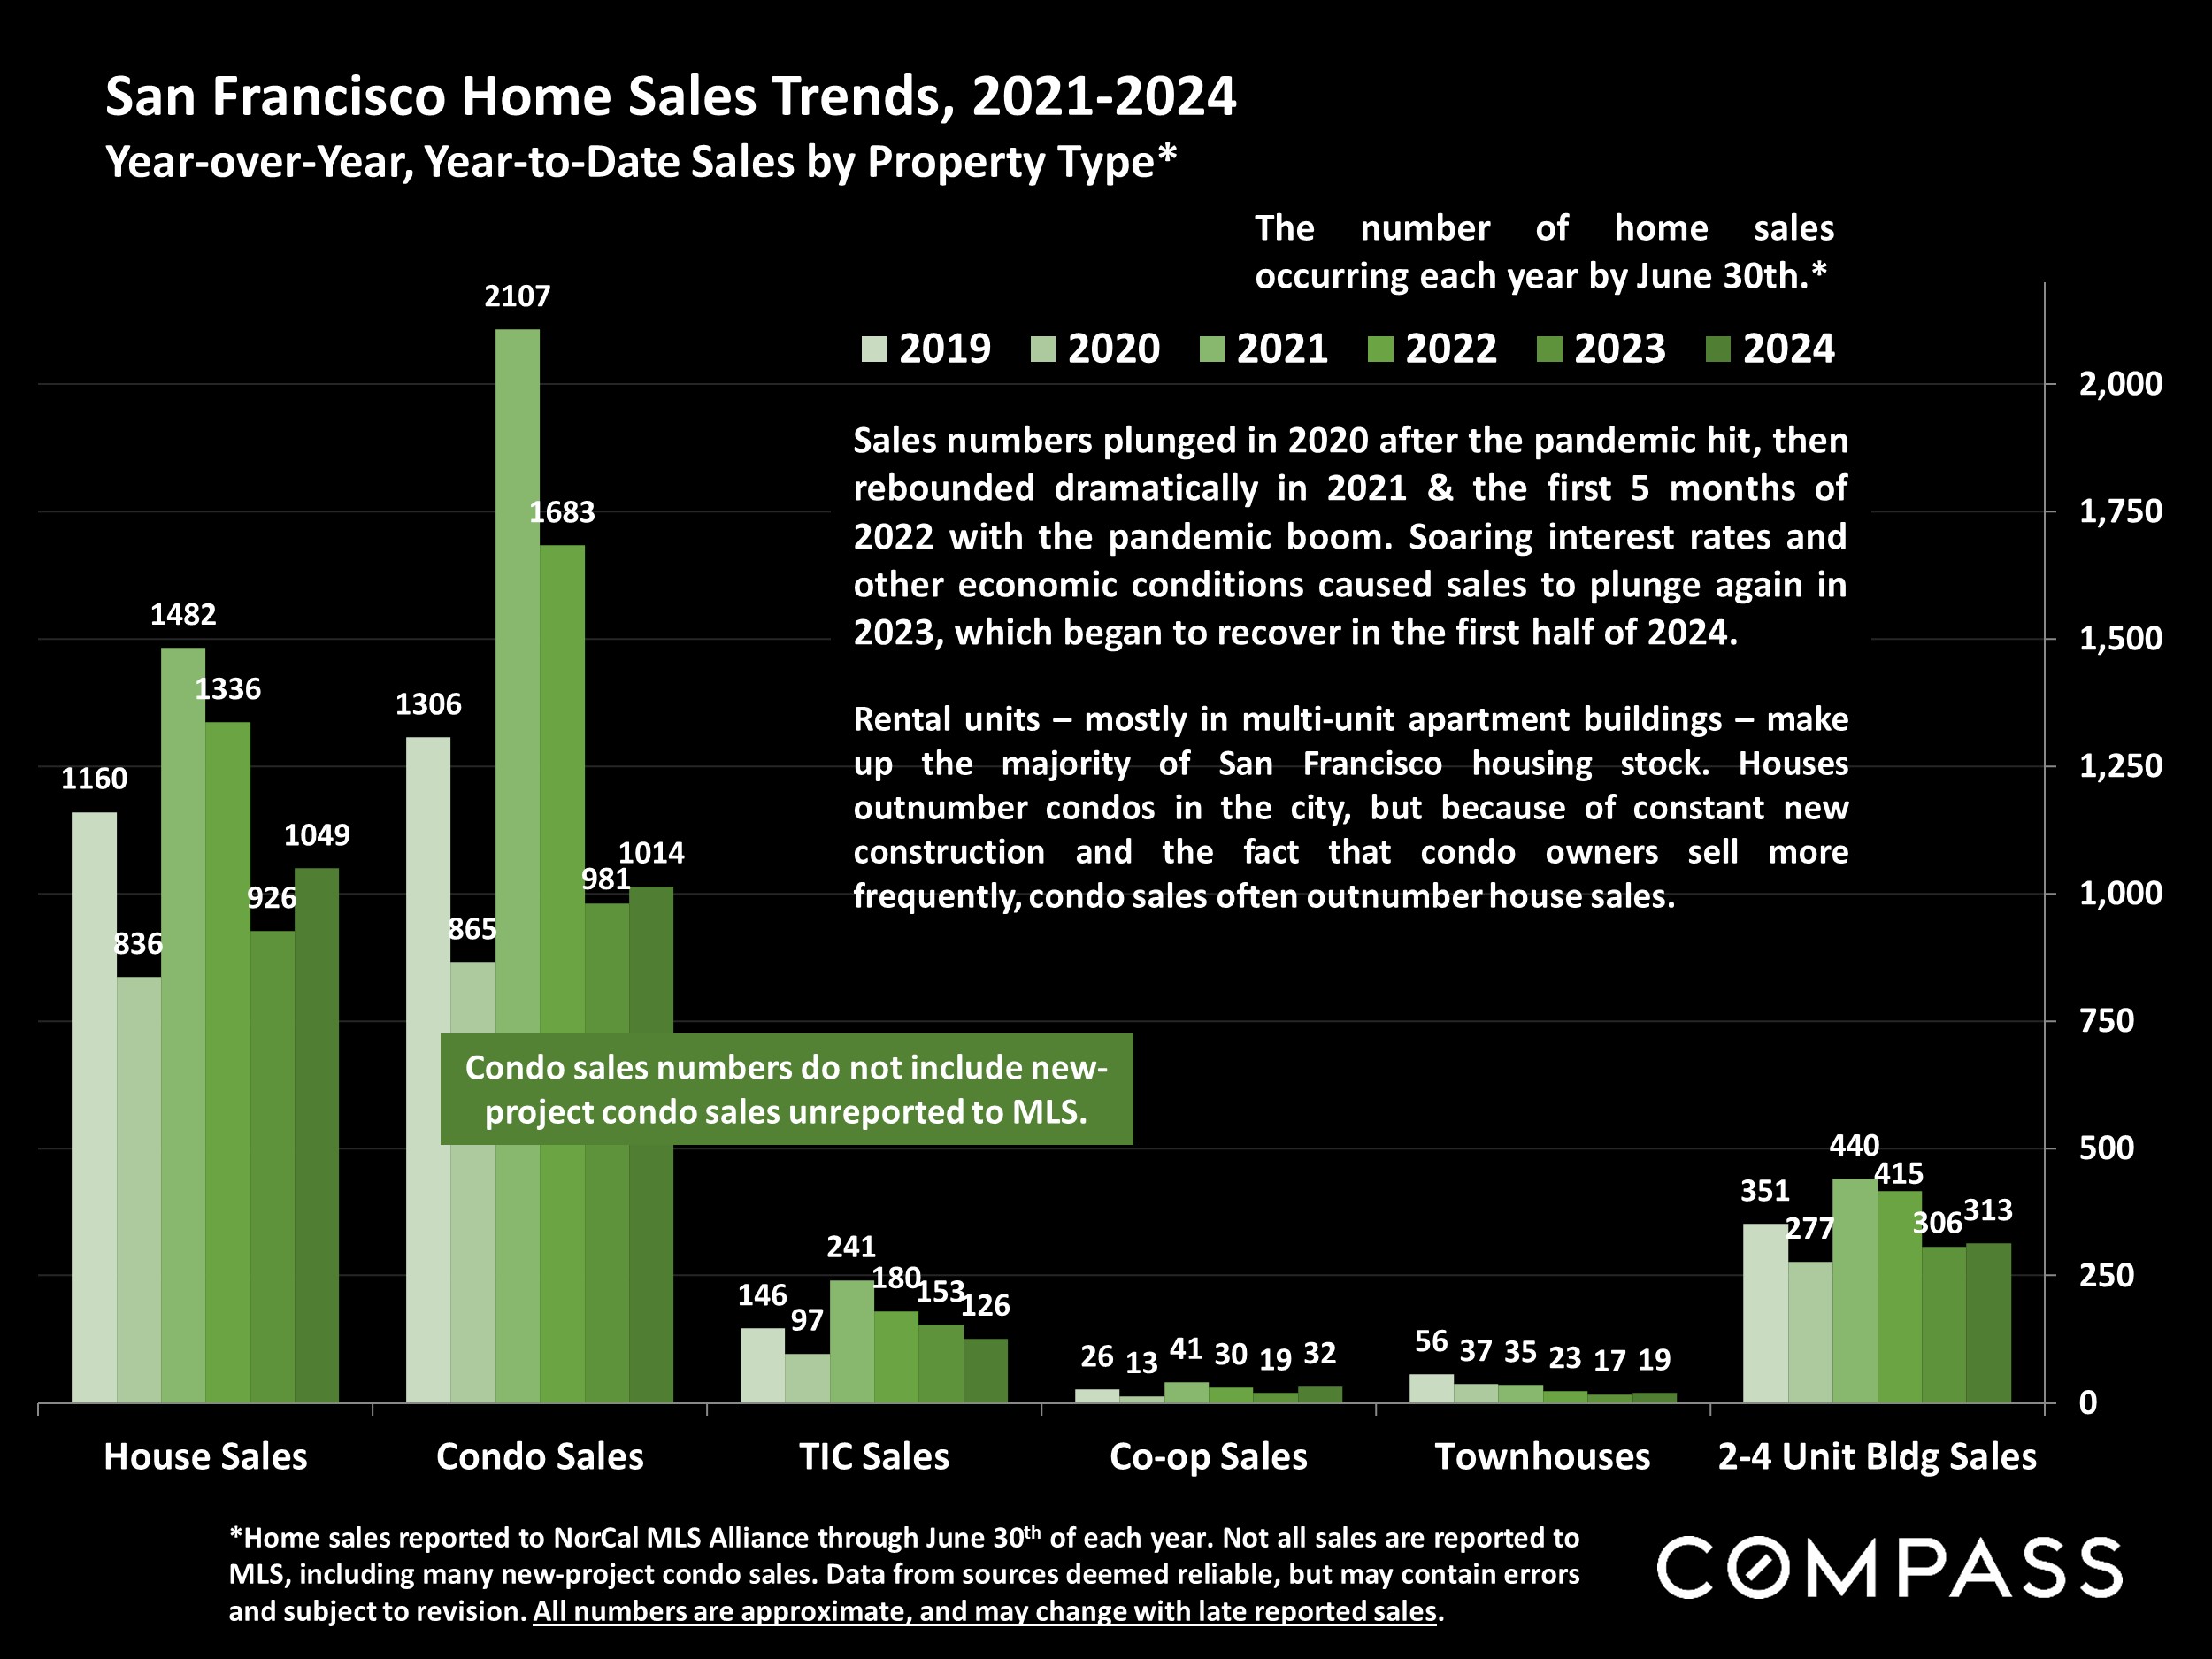
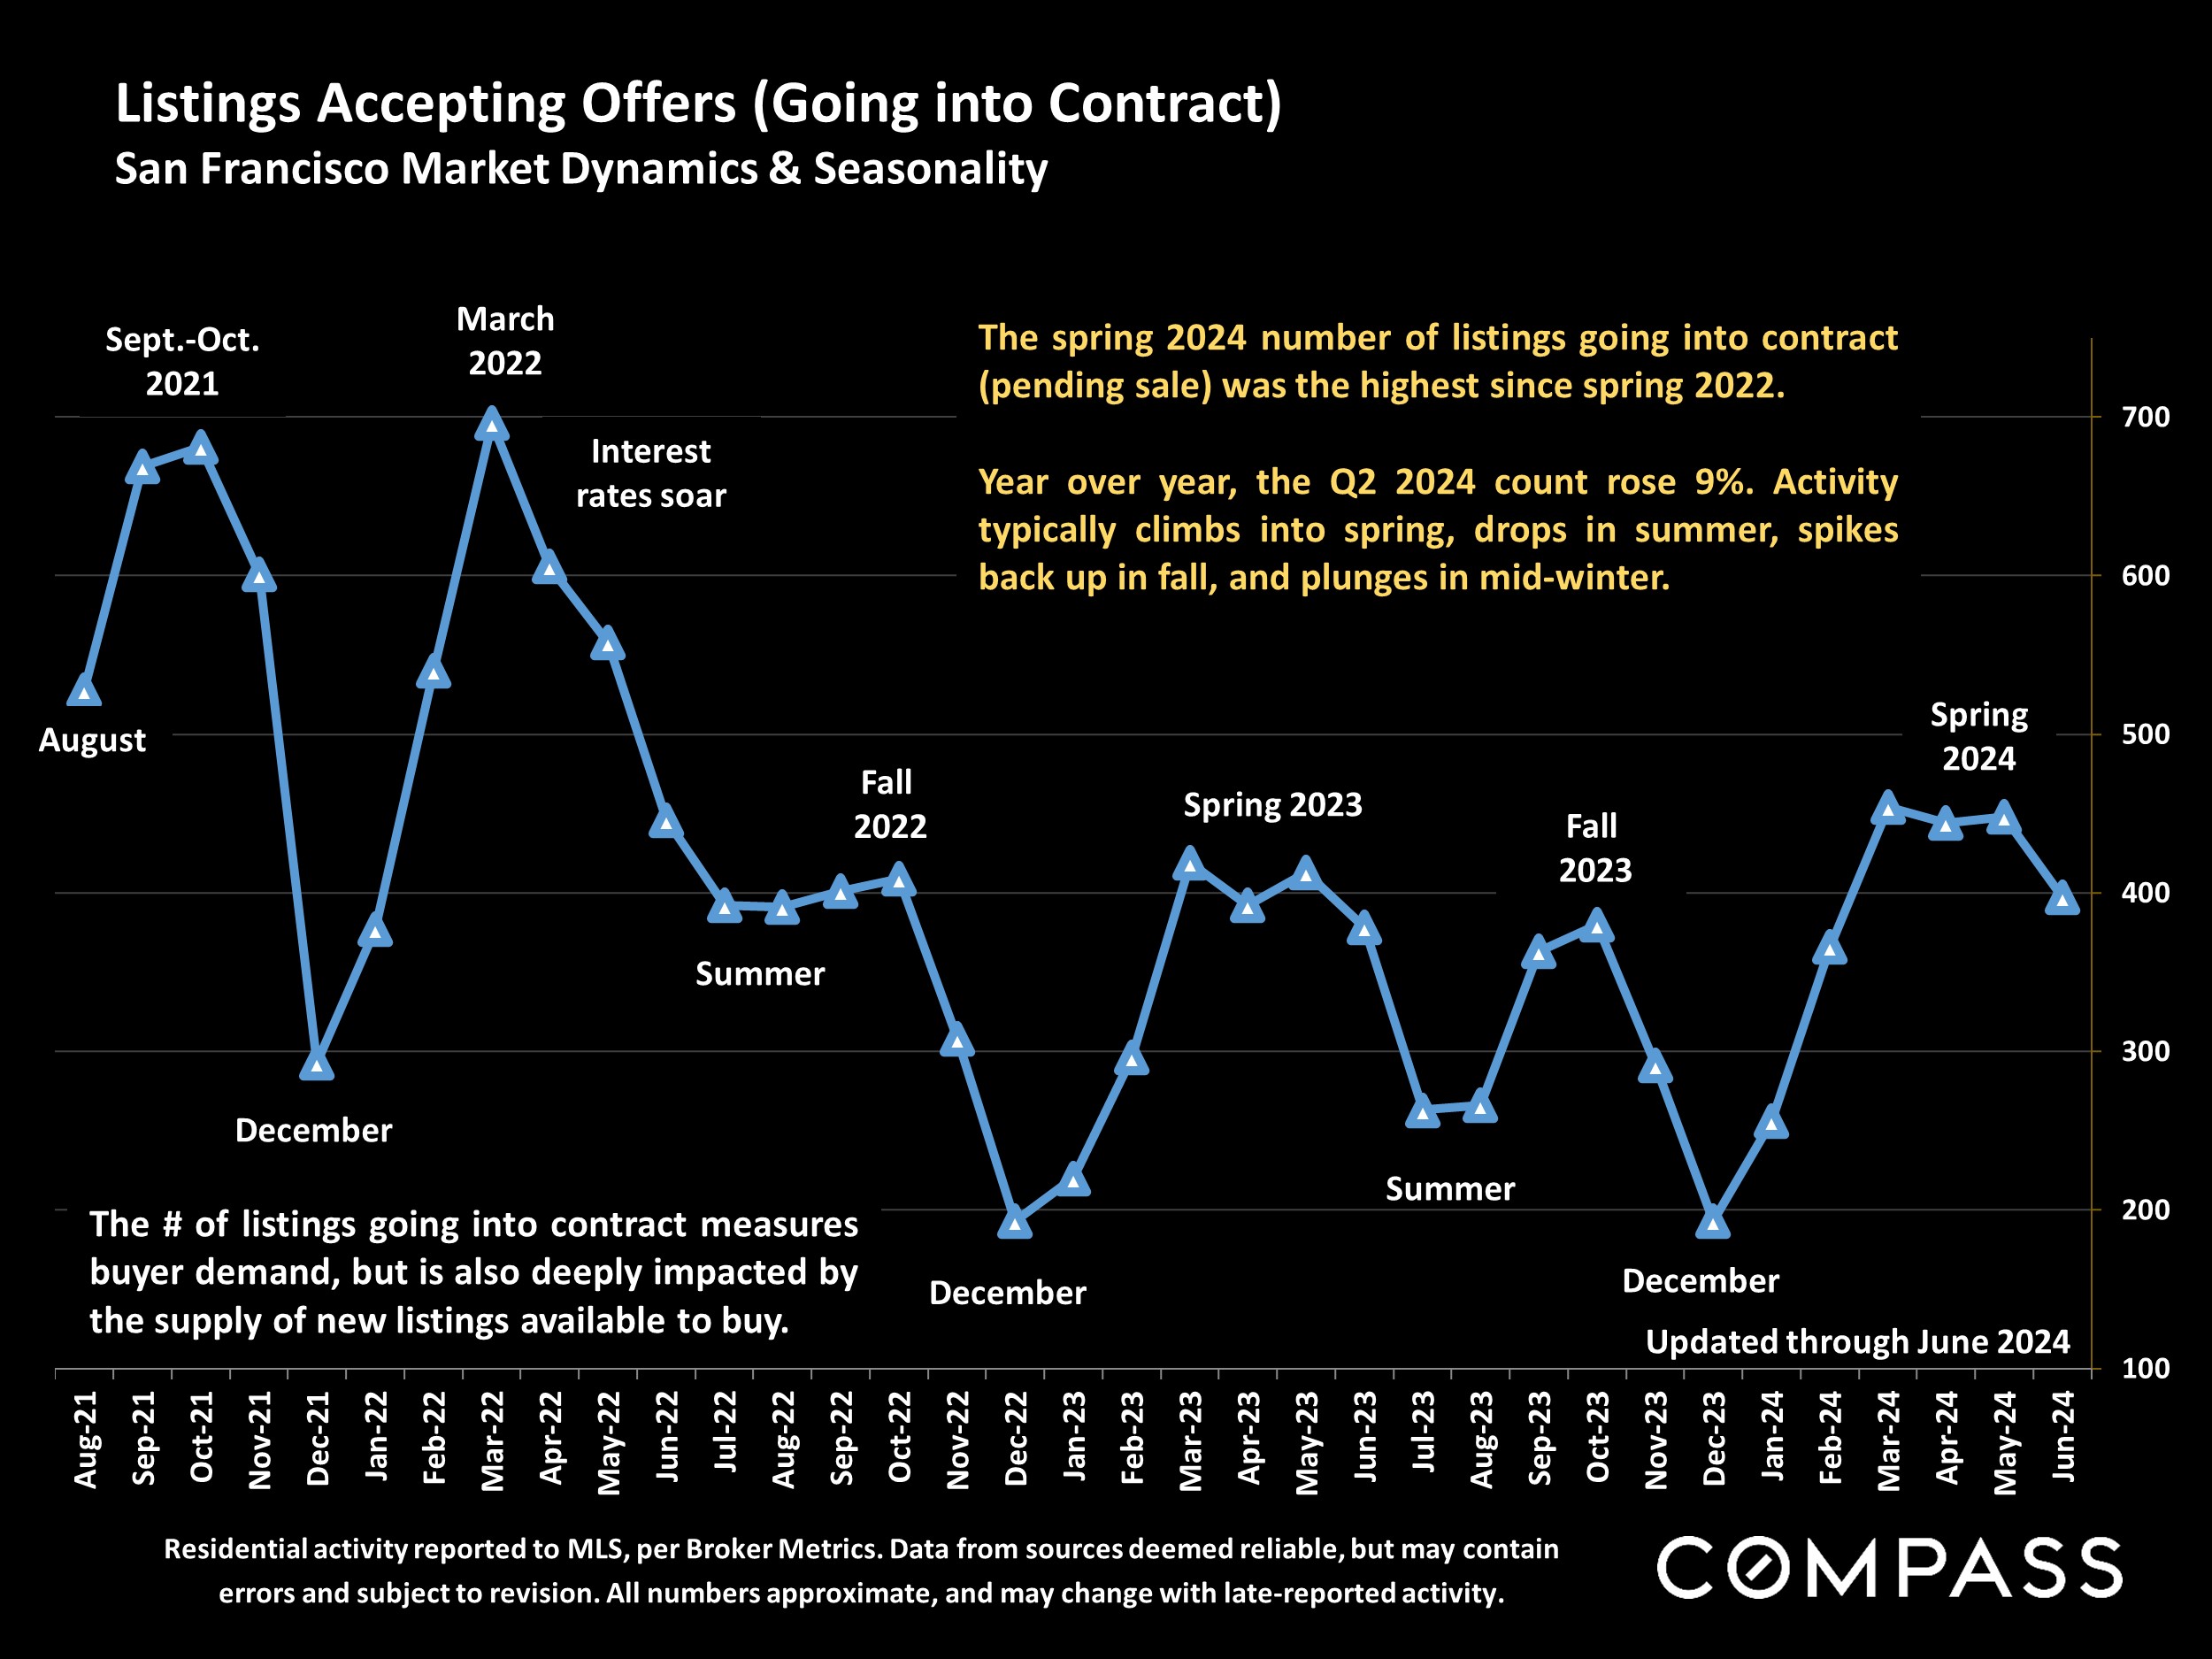
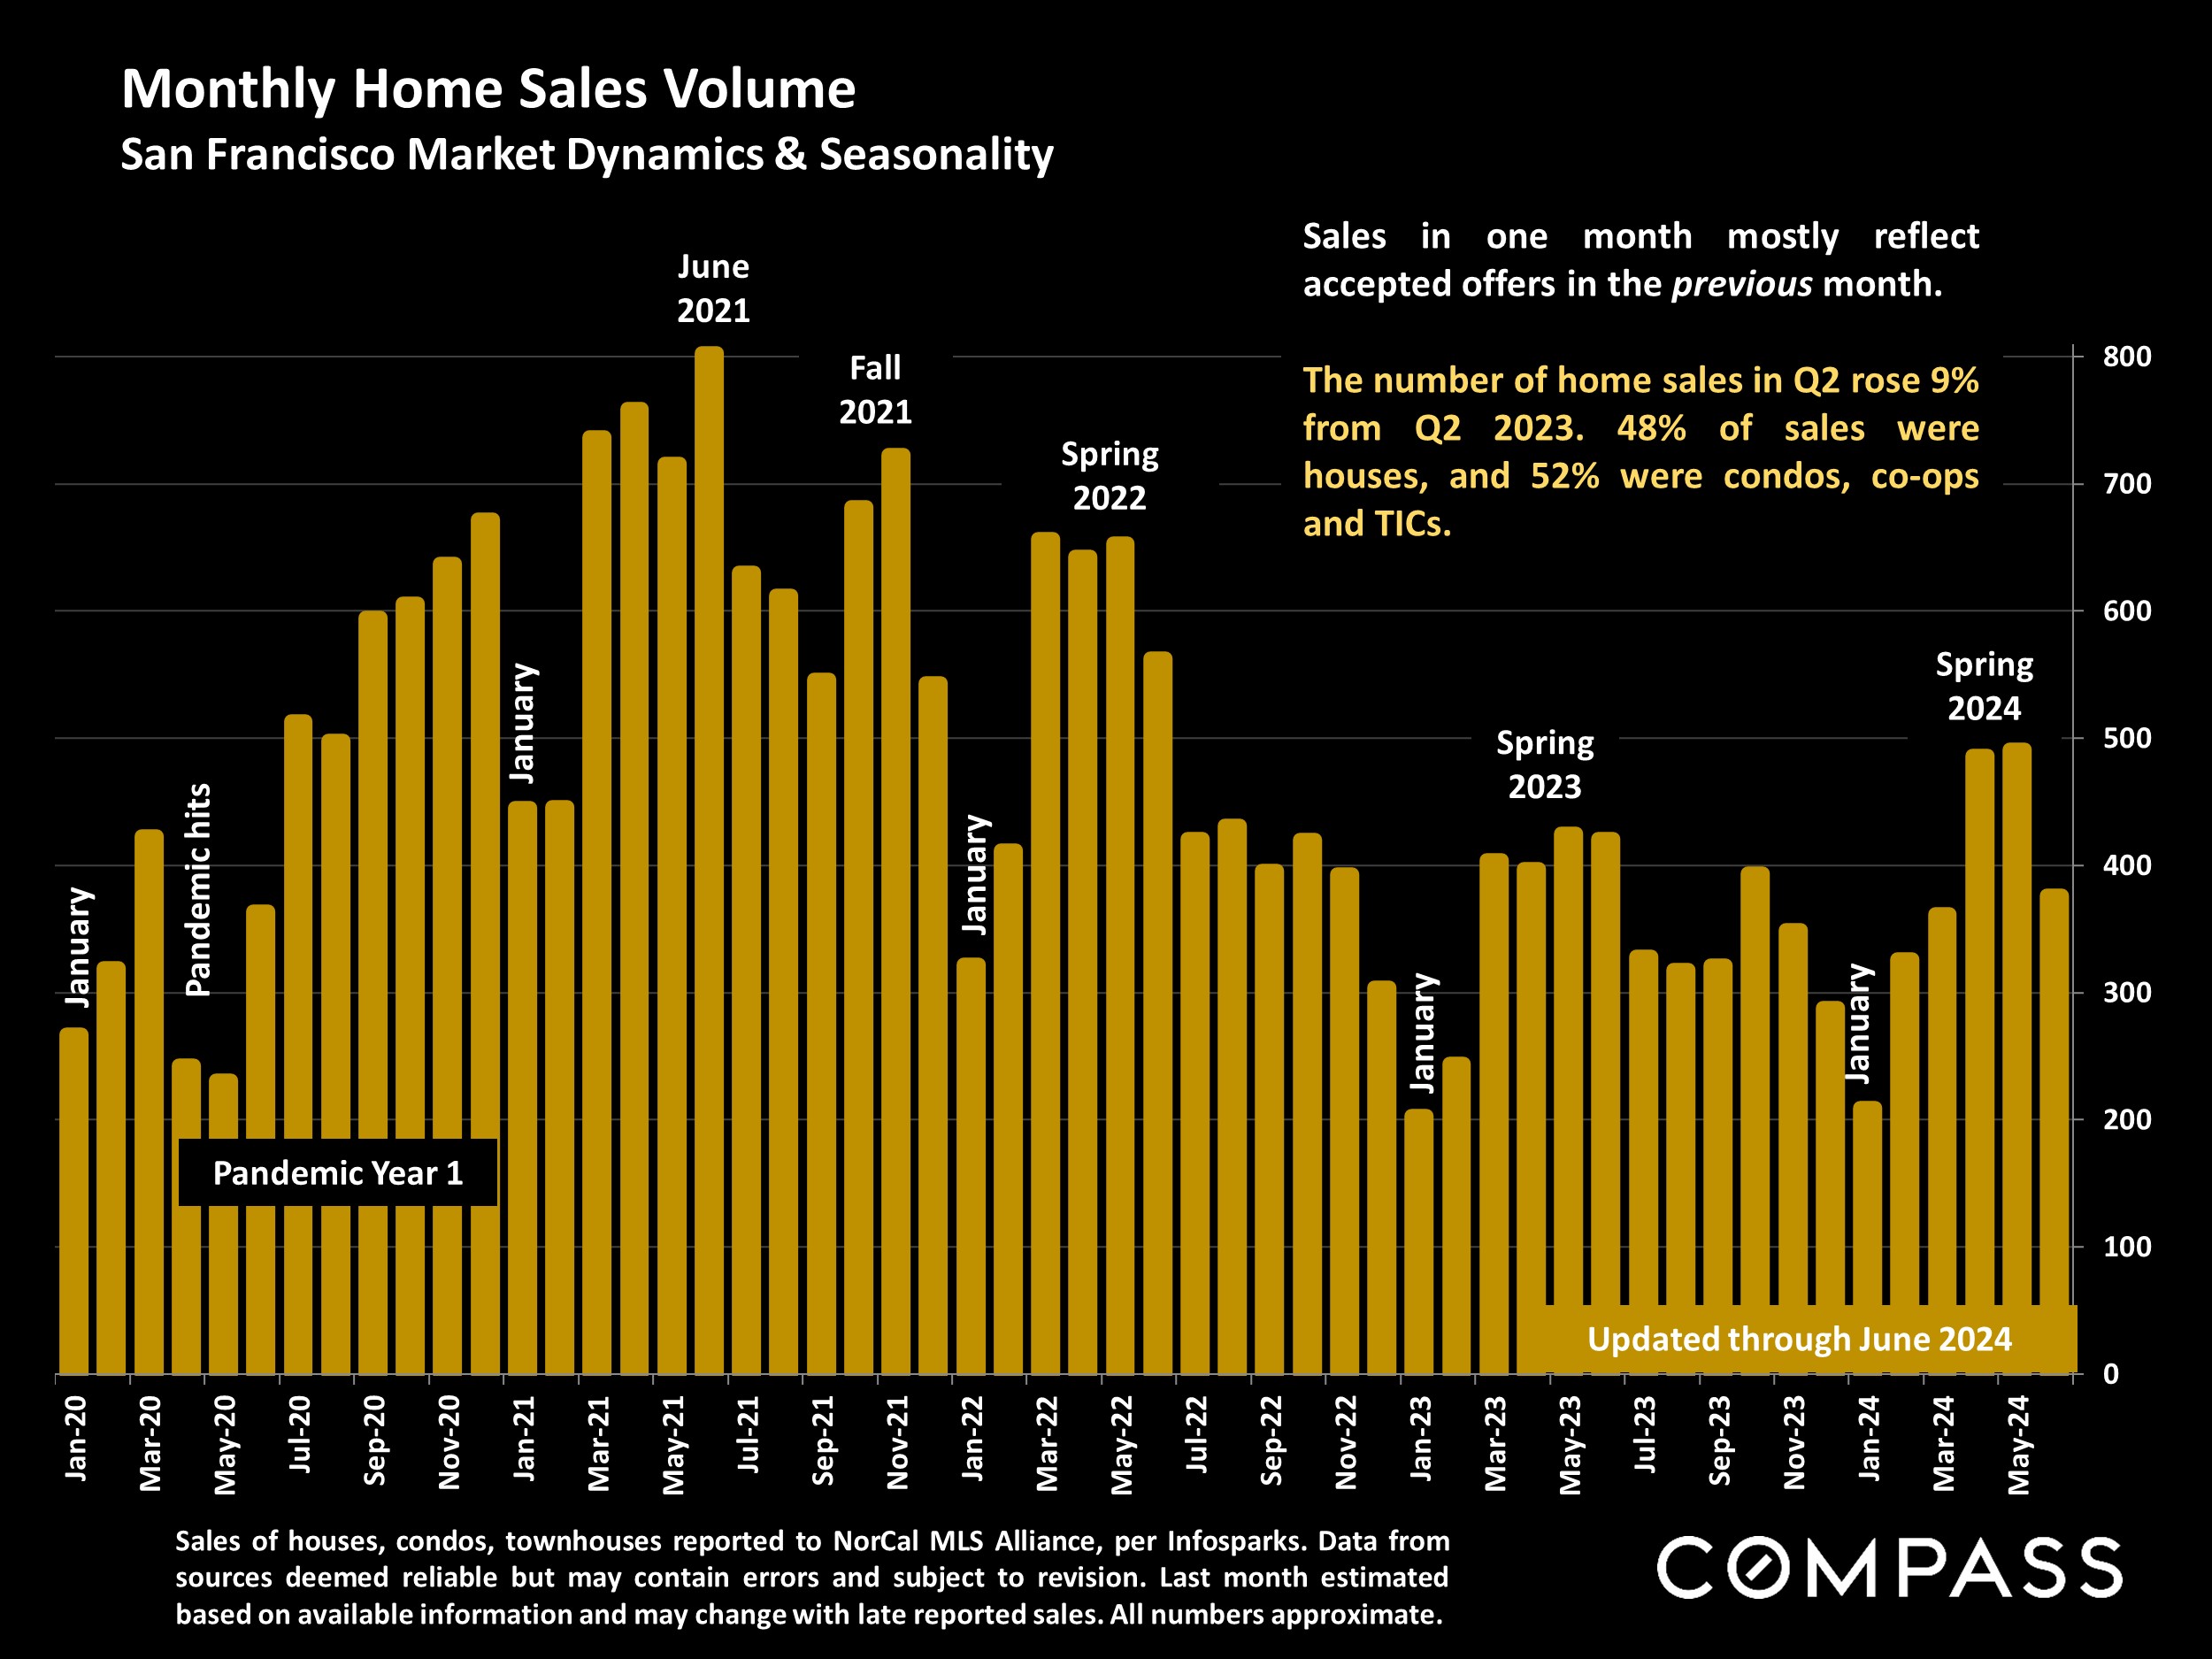
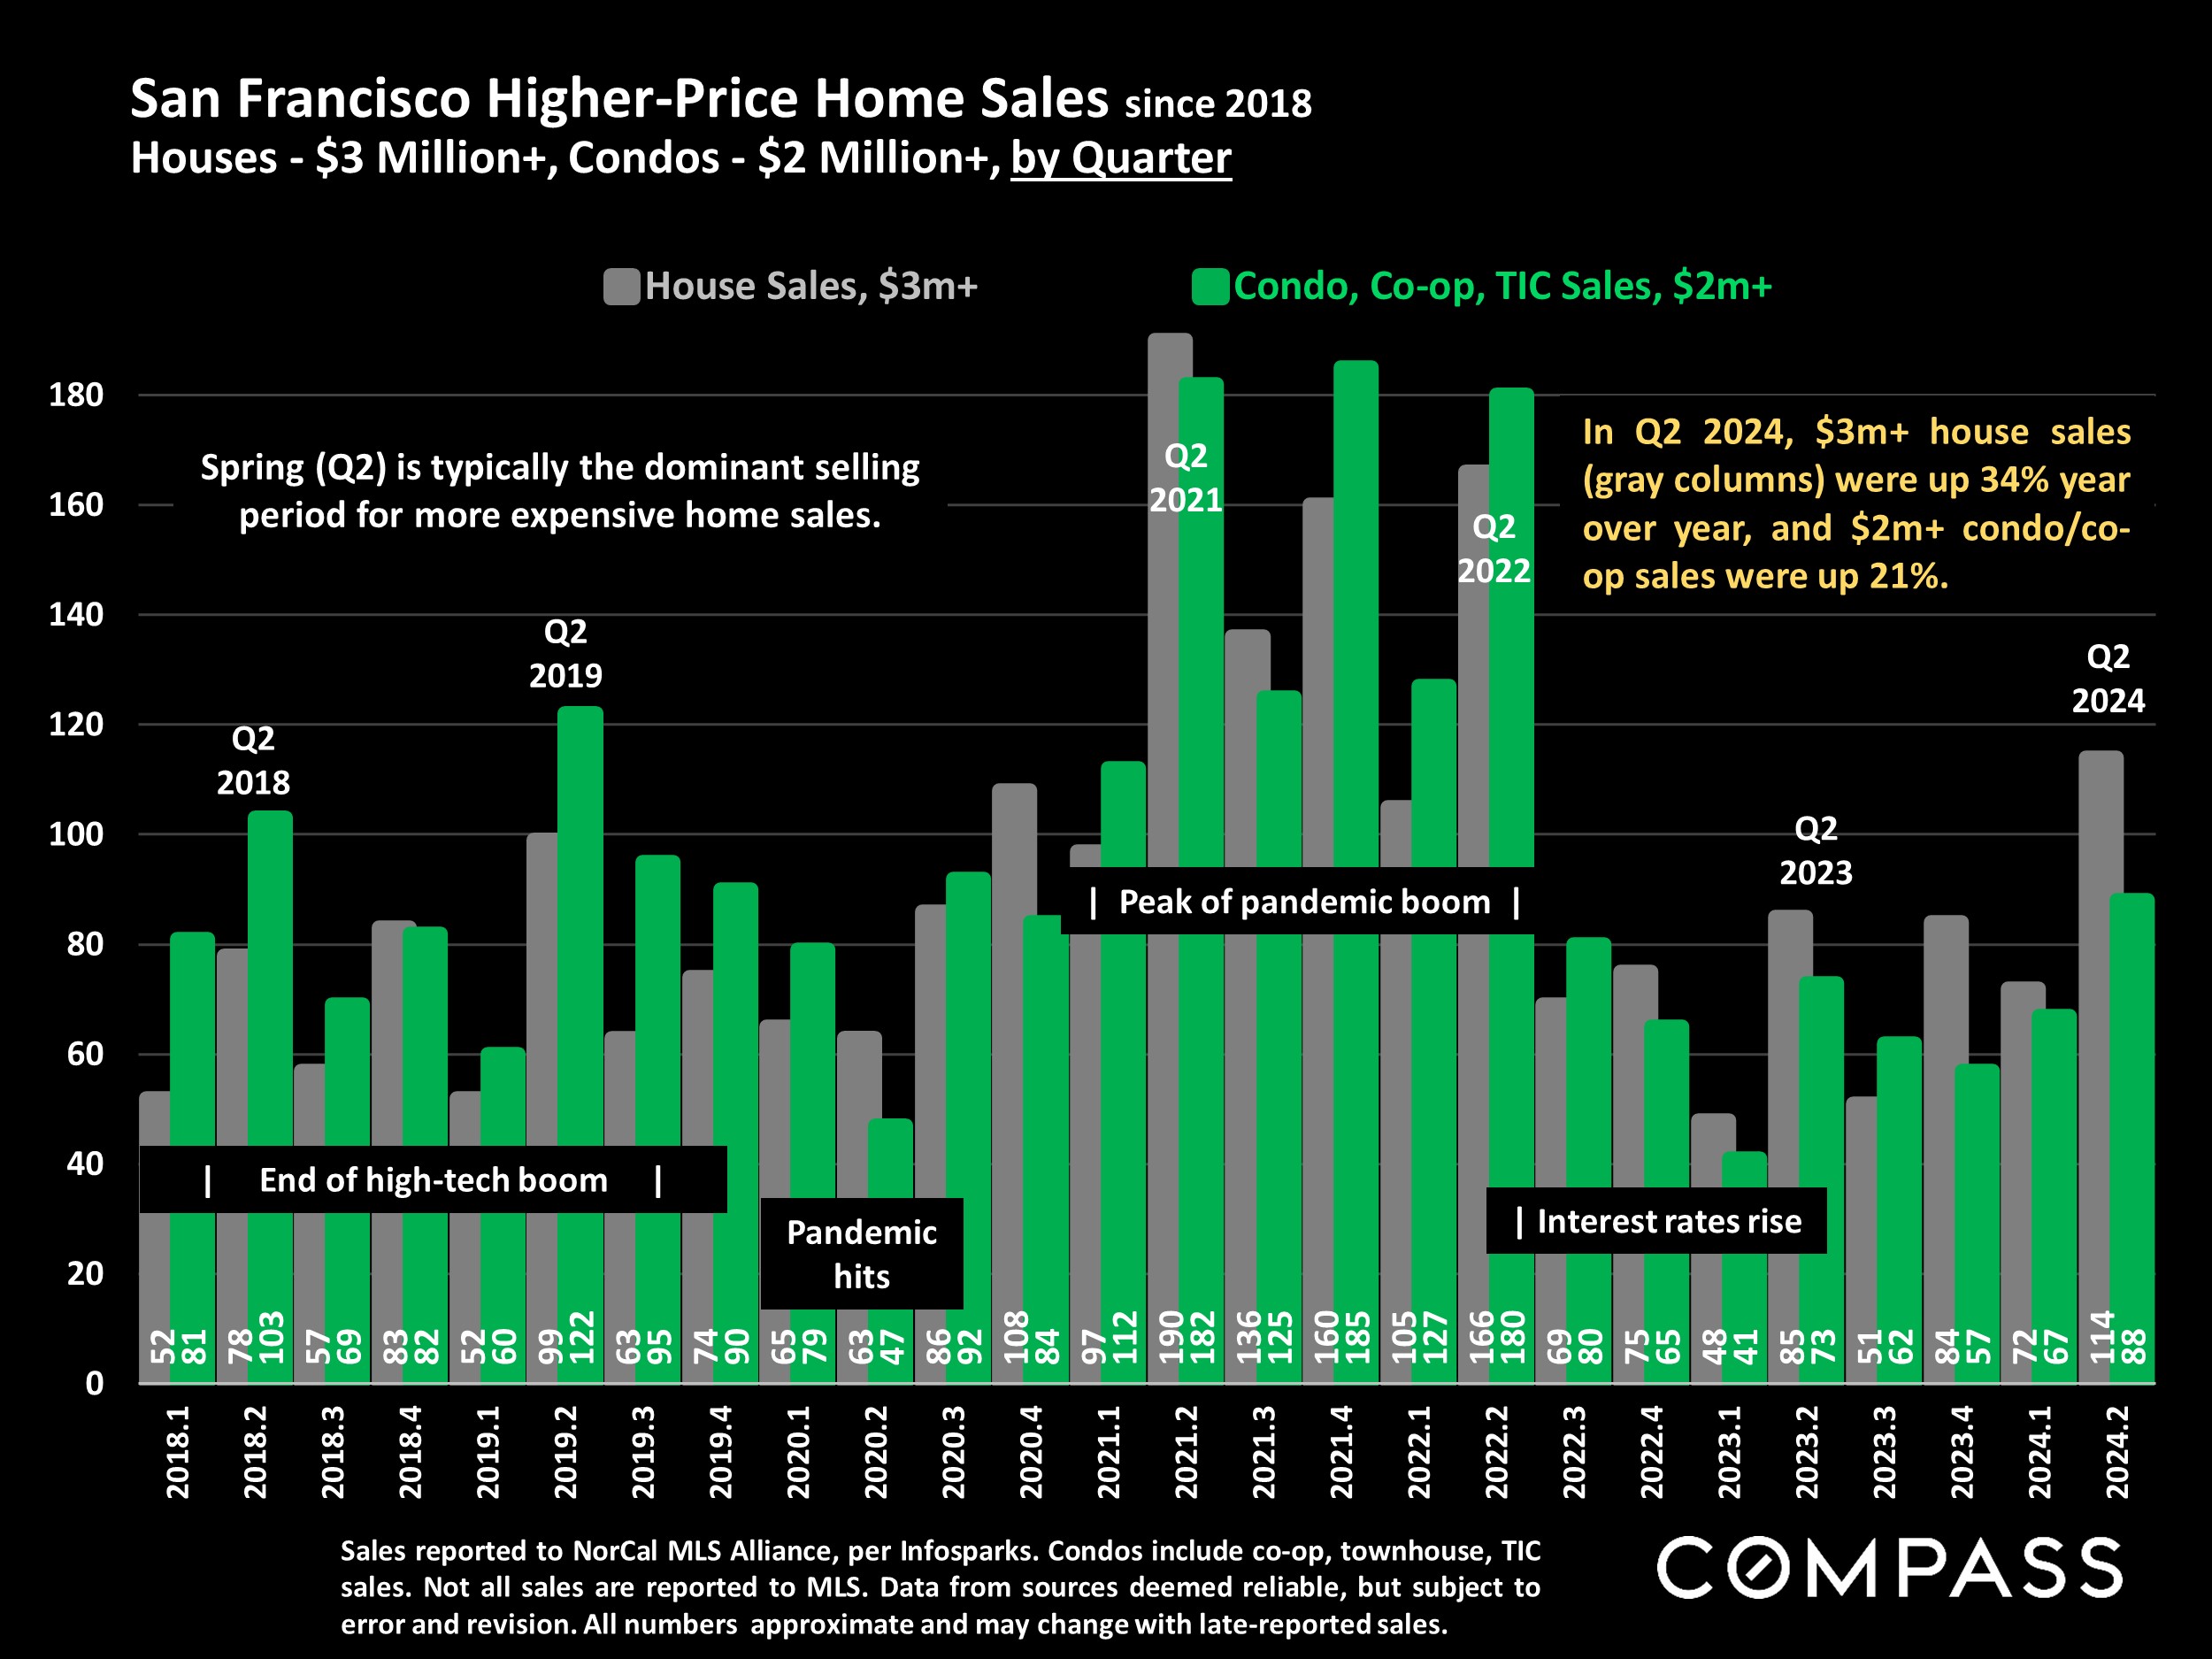
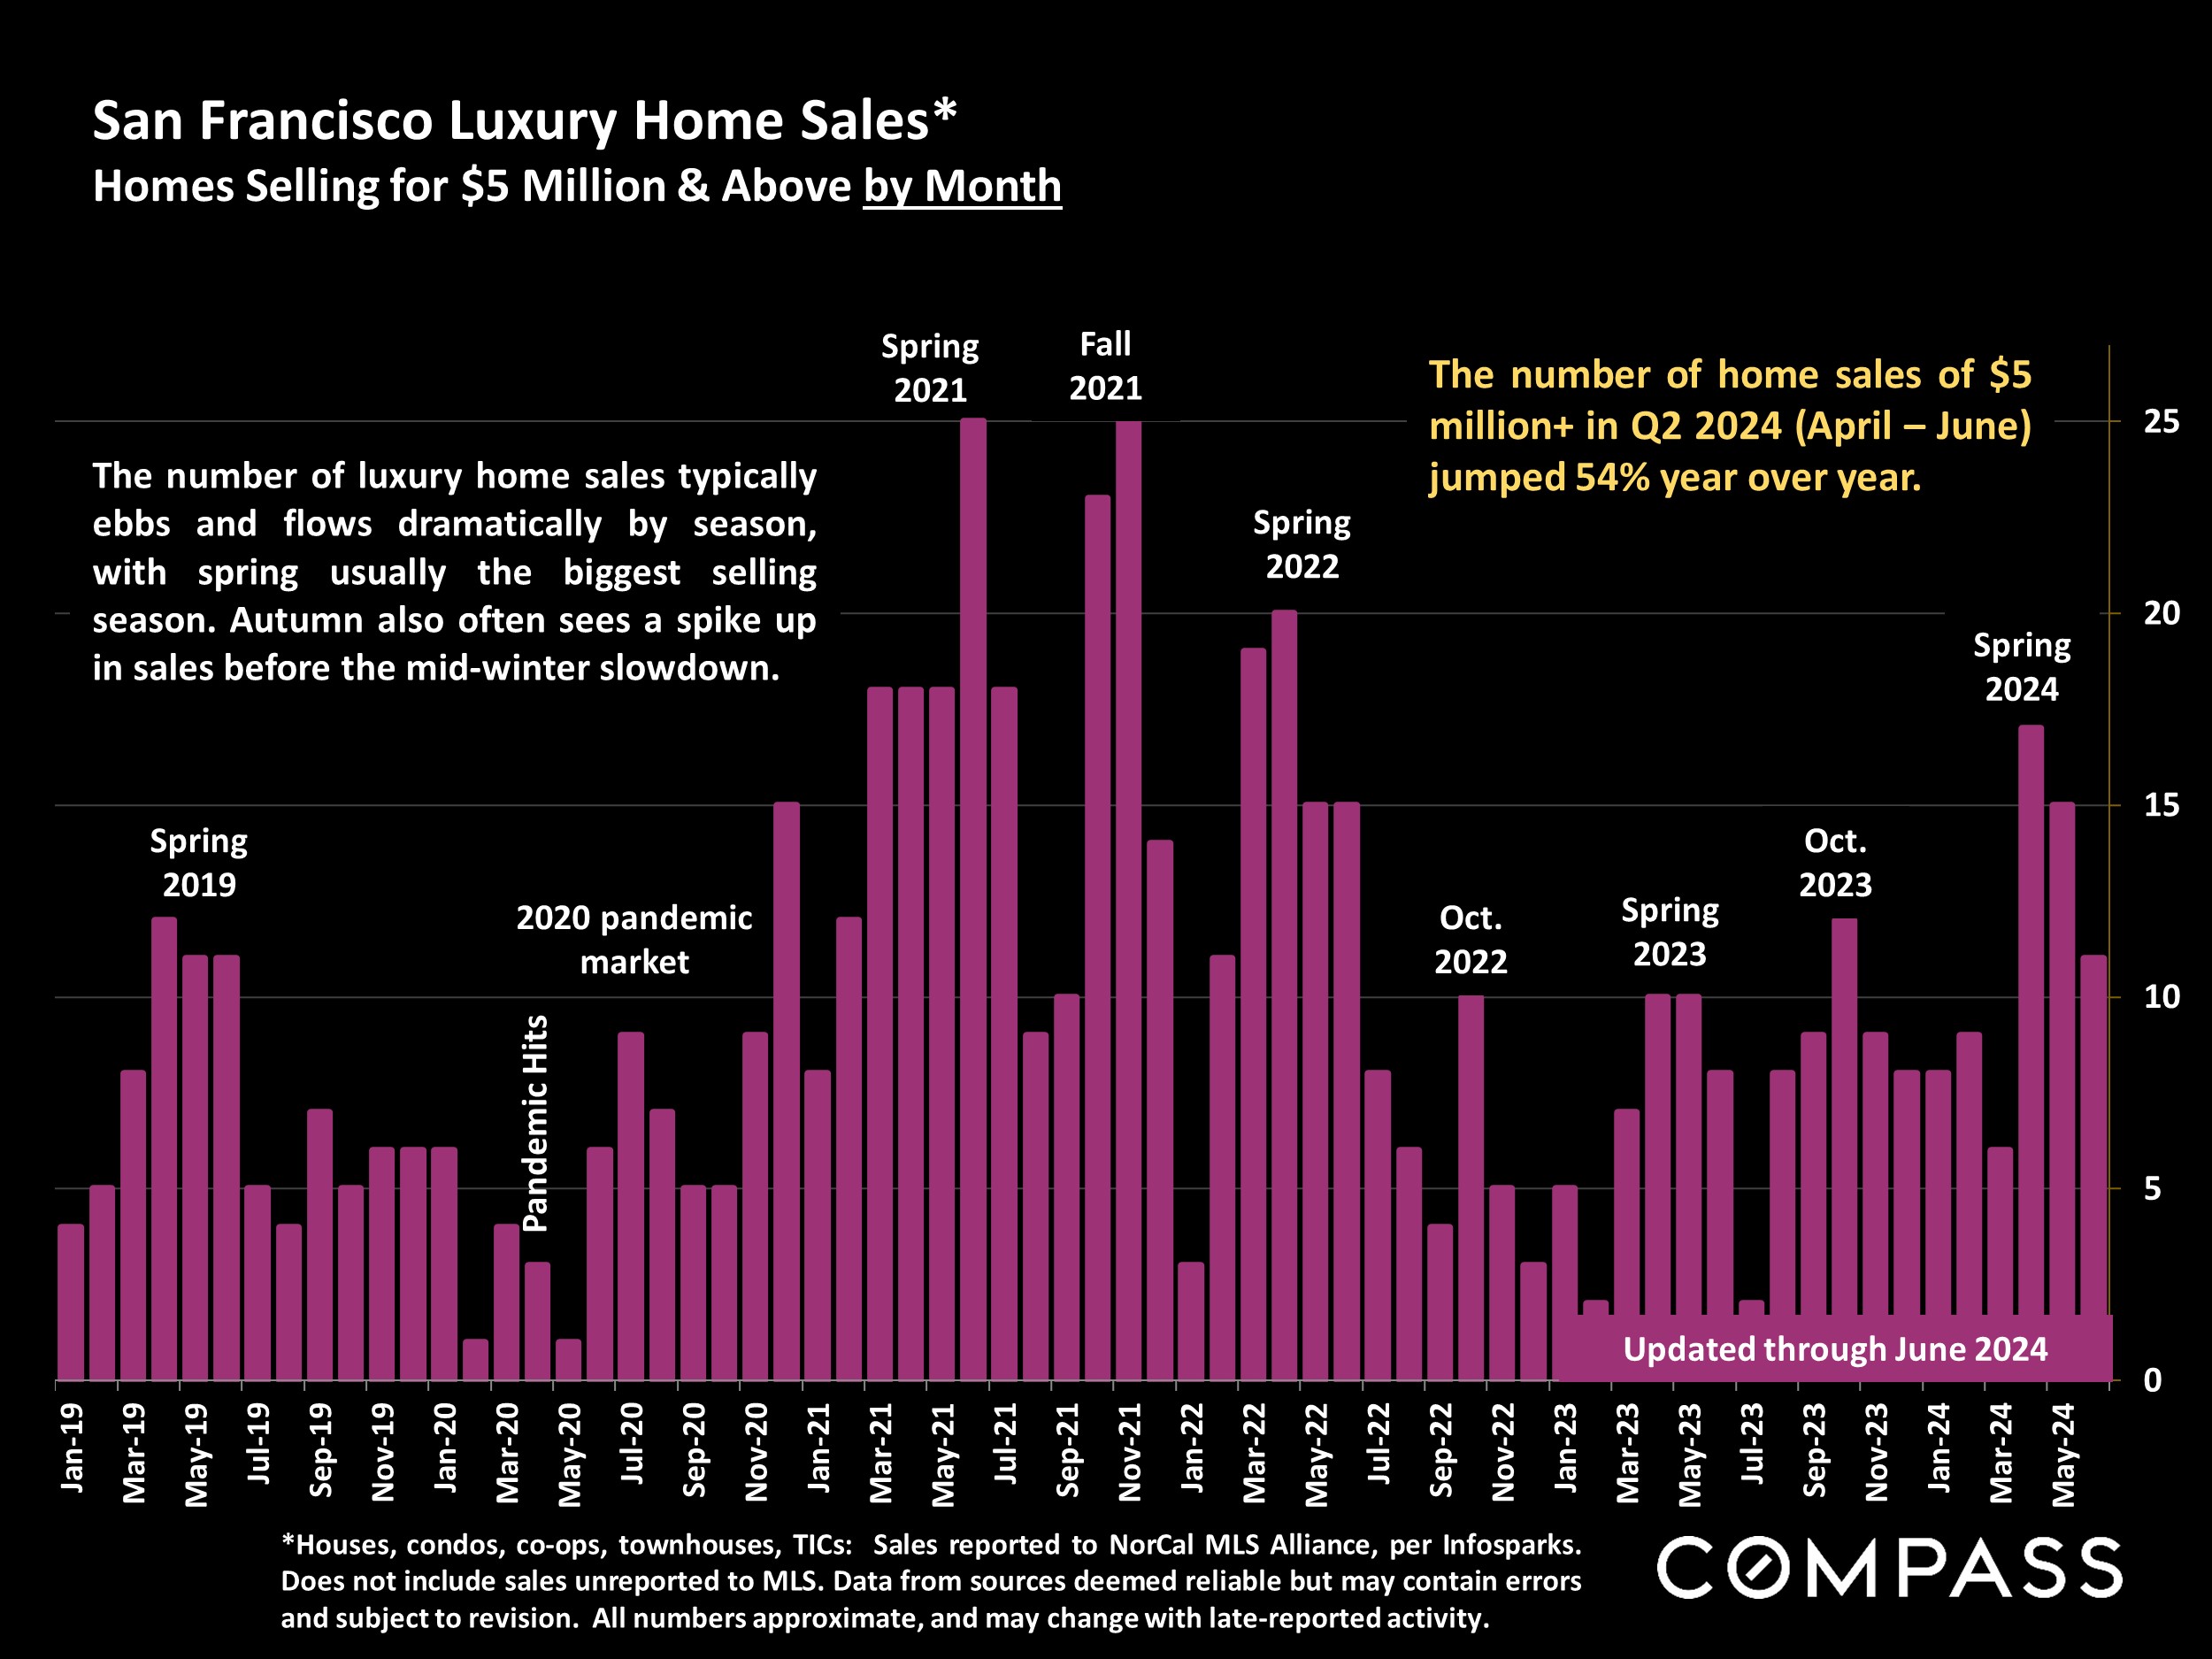
  • Q2 home sales rose 9% year over year, but homes selling for $3 million+ jumped 29%, and $5 million+ sales soared 54%: Very affluent households have been playing an outsized role in the housing market since late 2023 (when financial markets began their rebound).
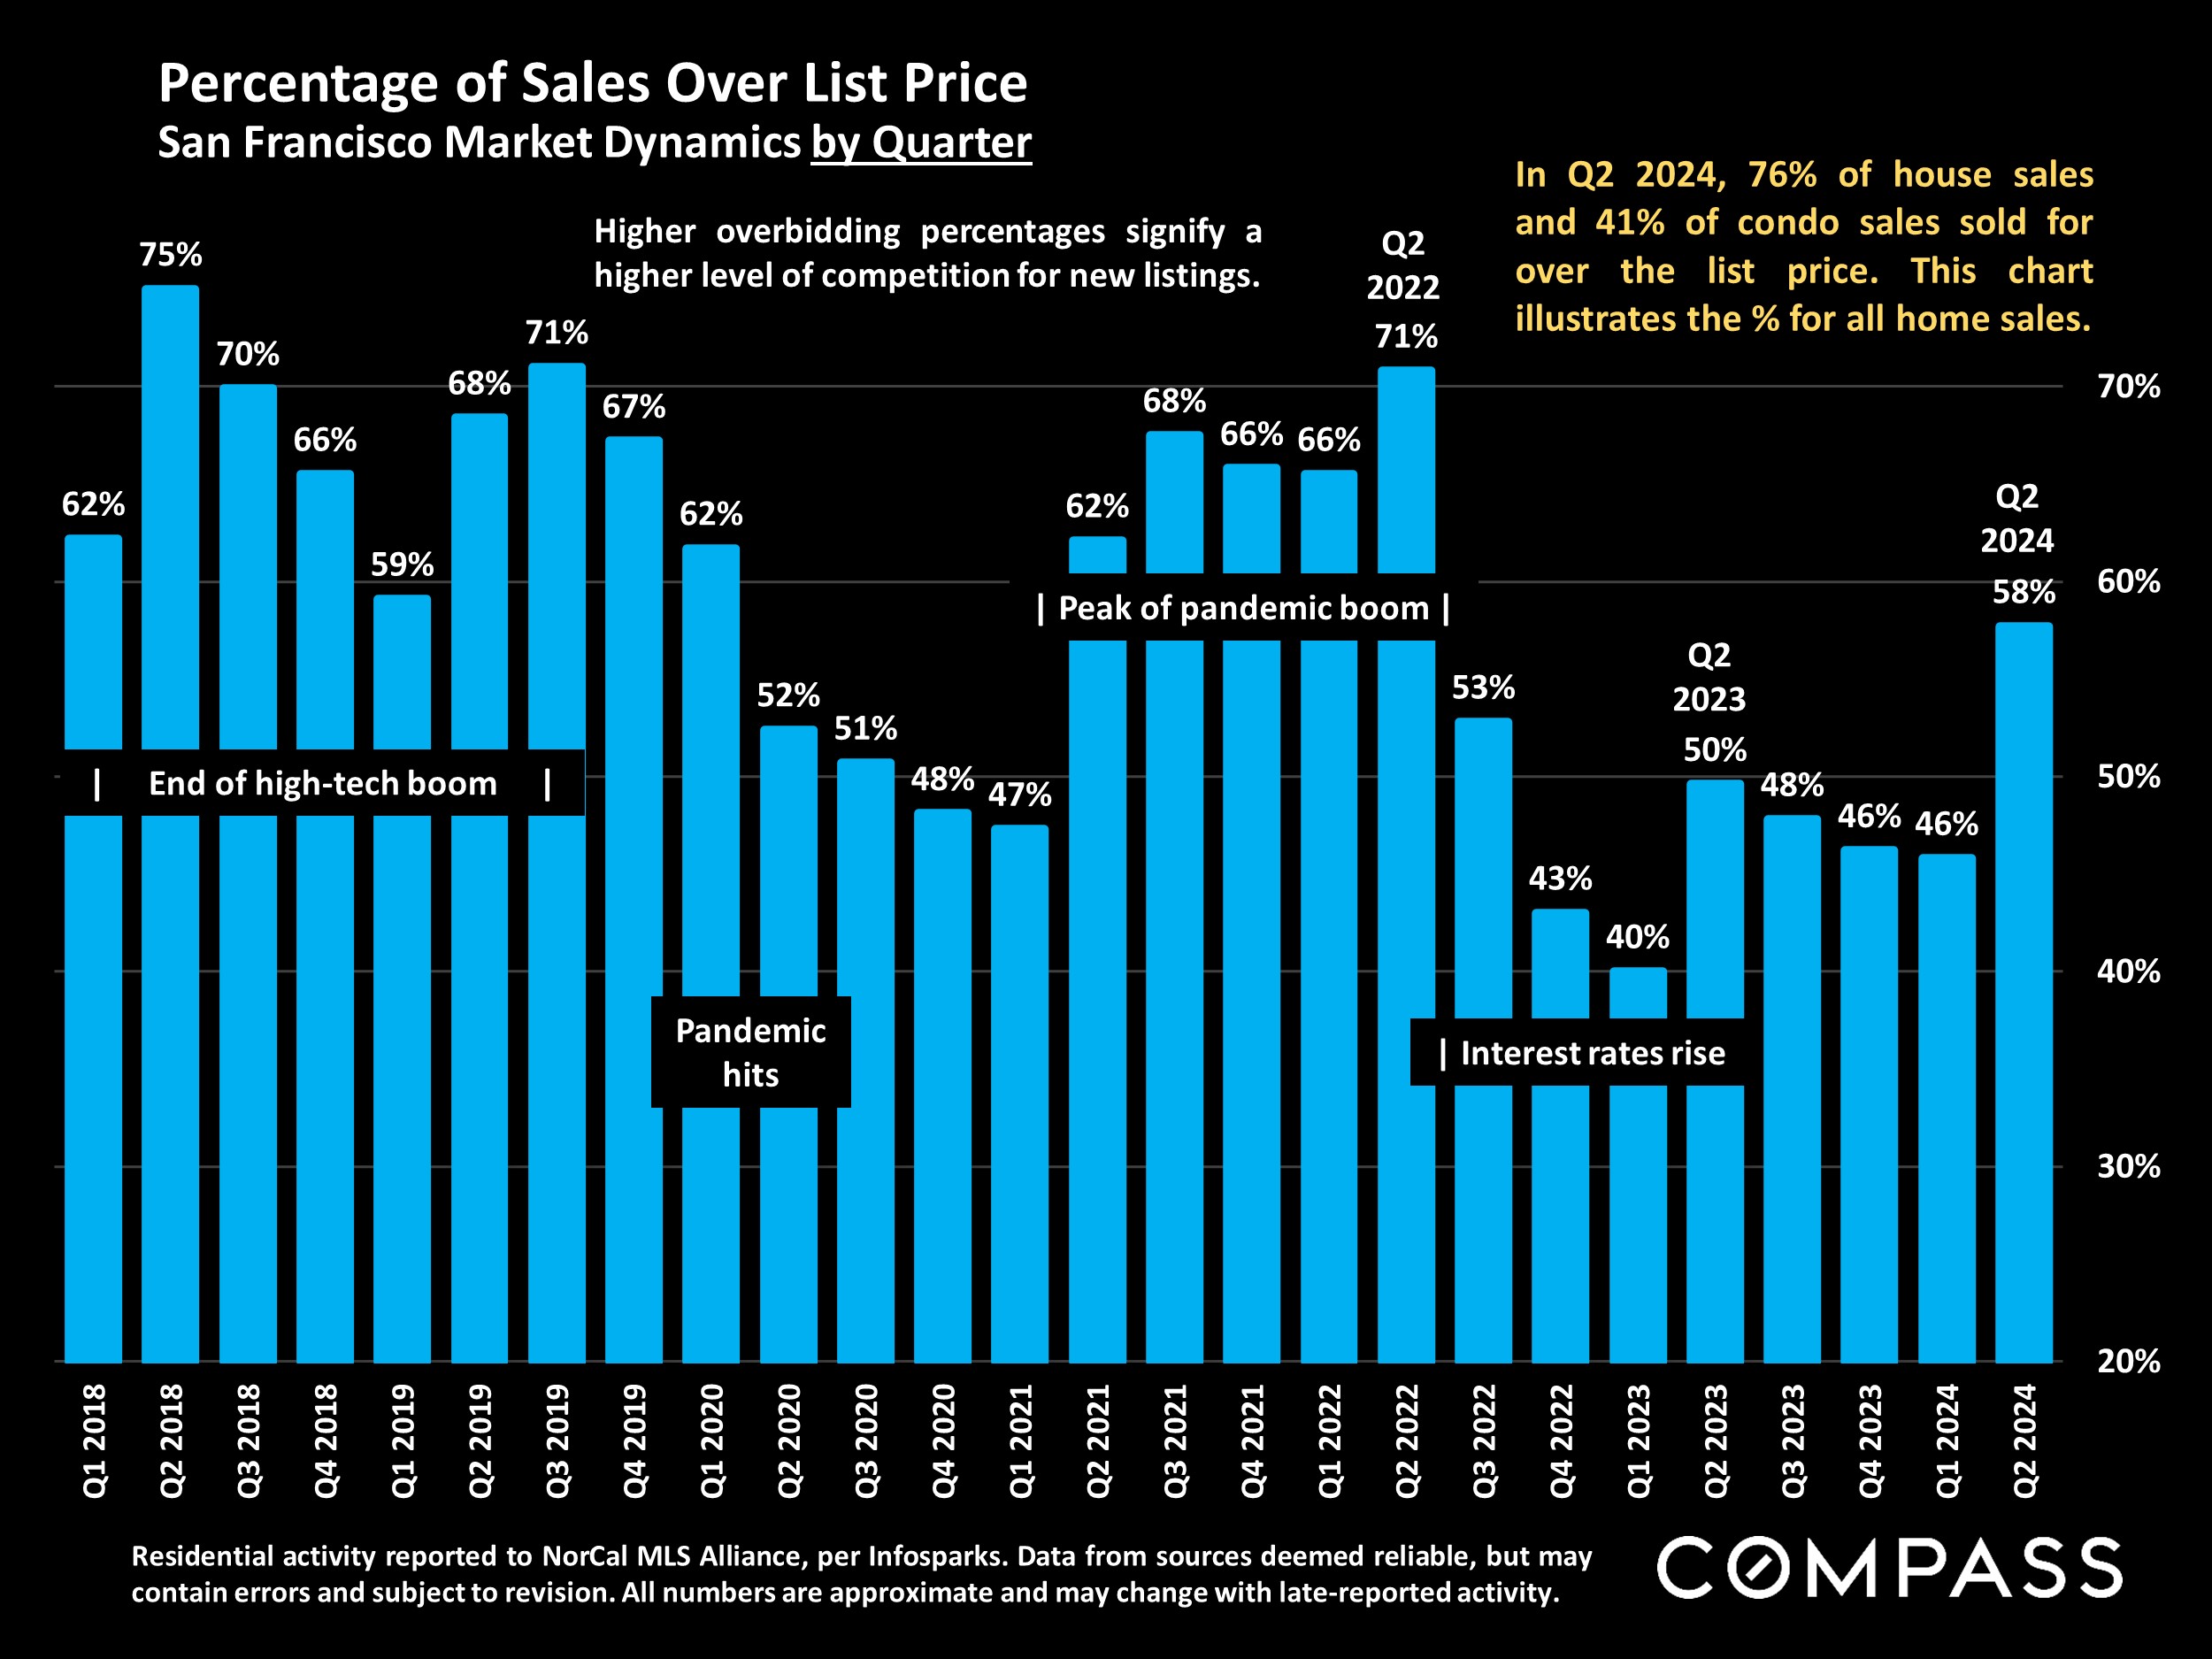
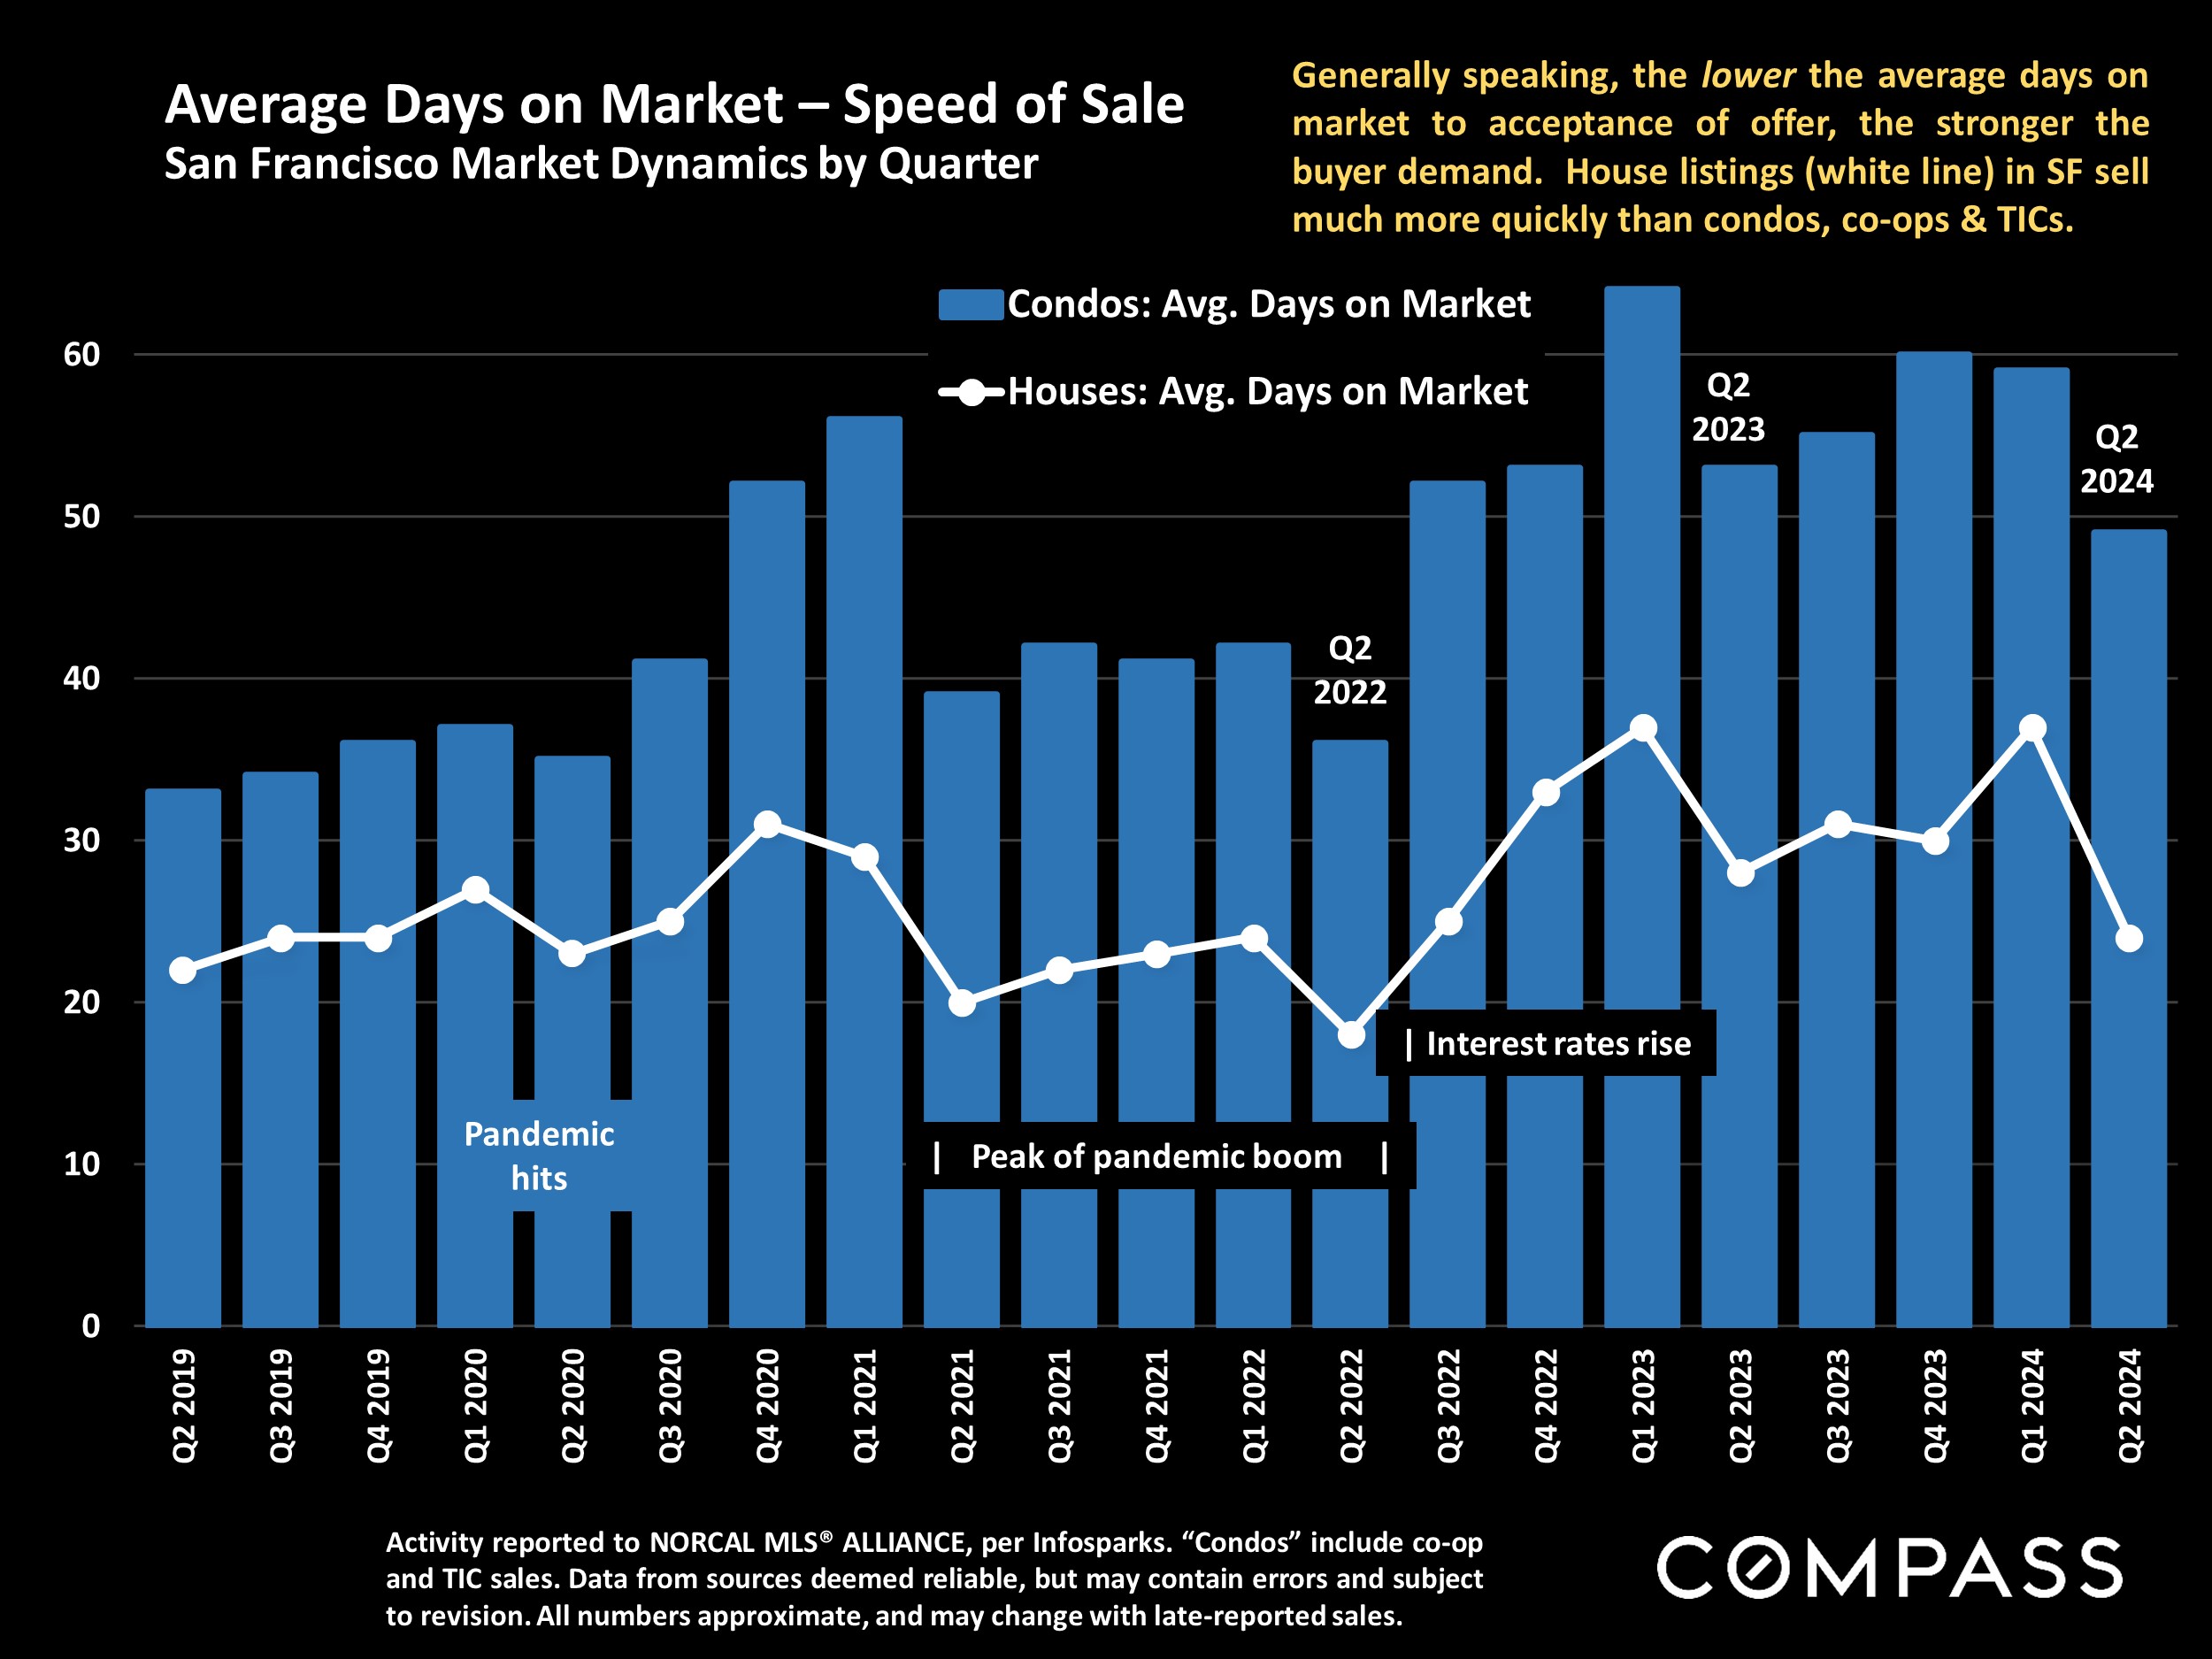
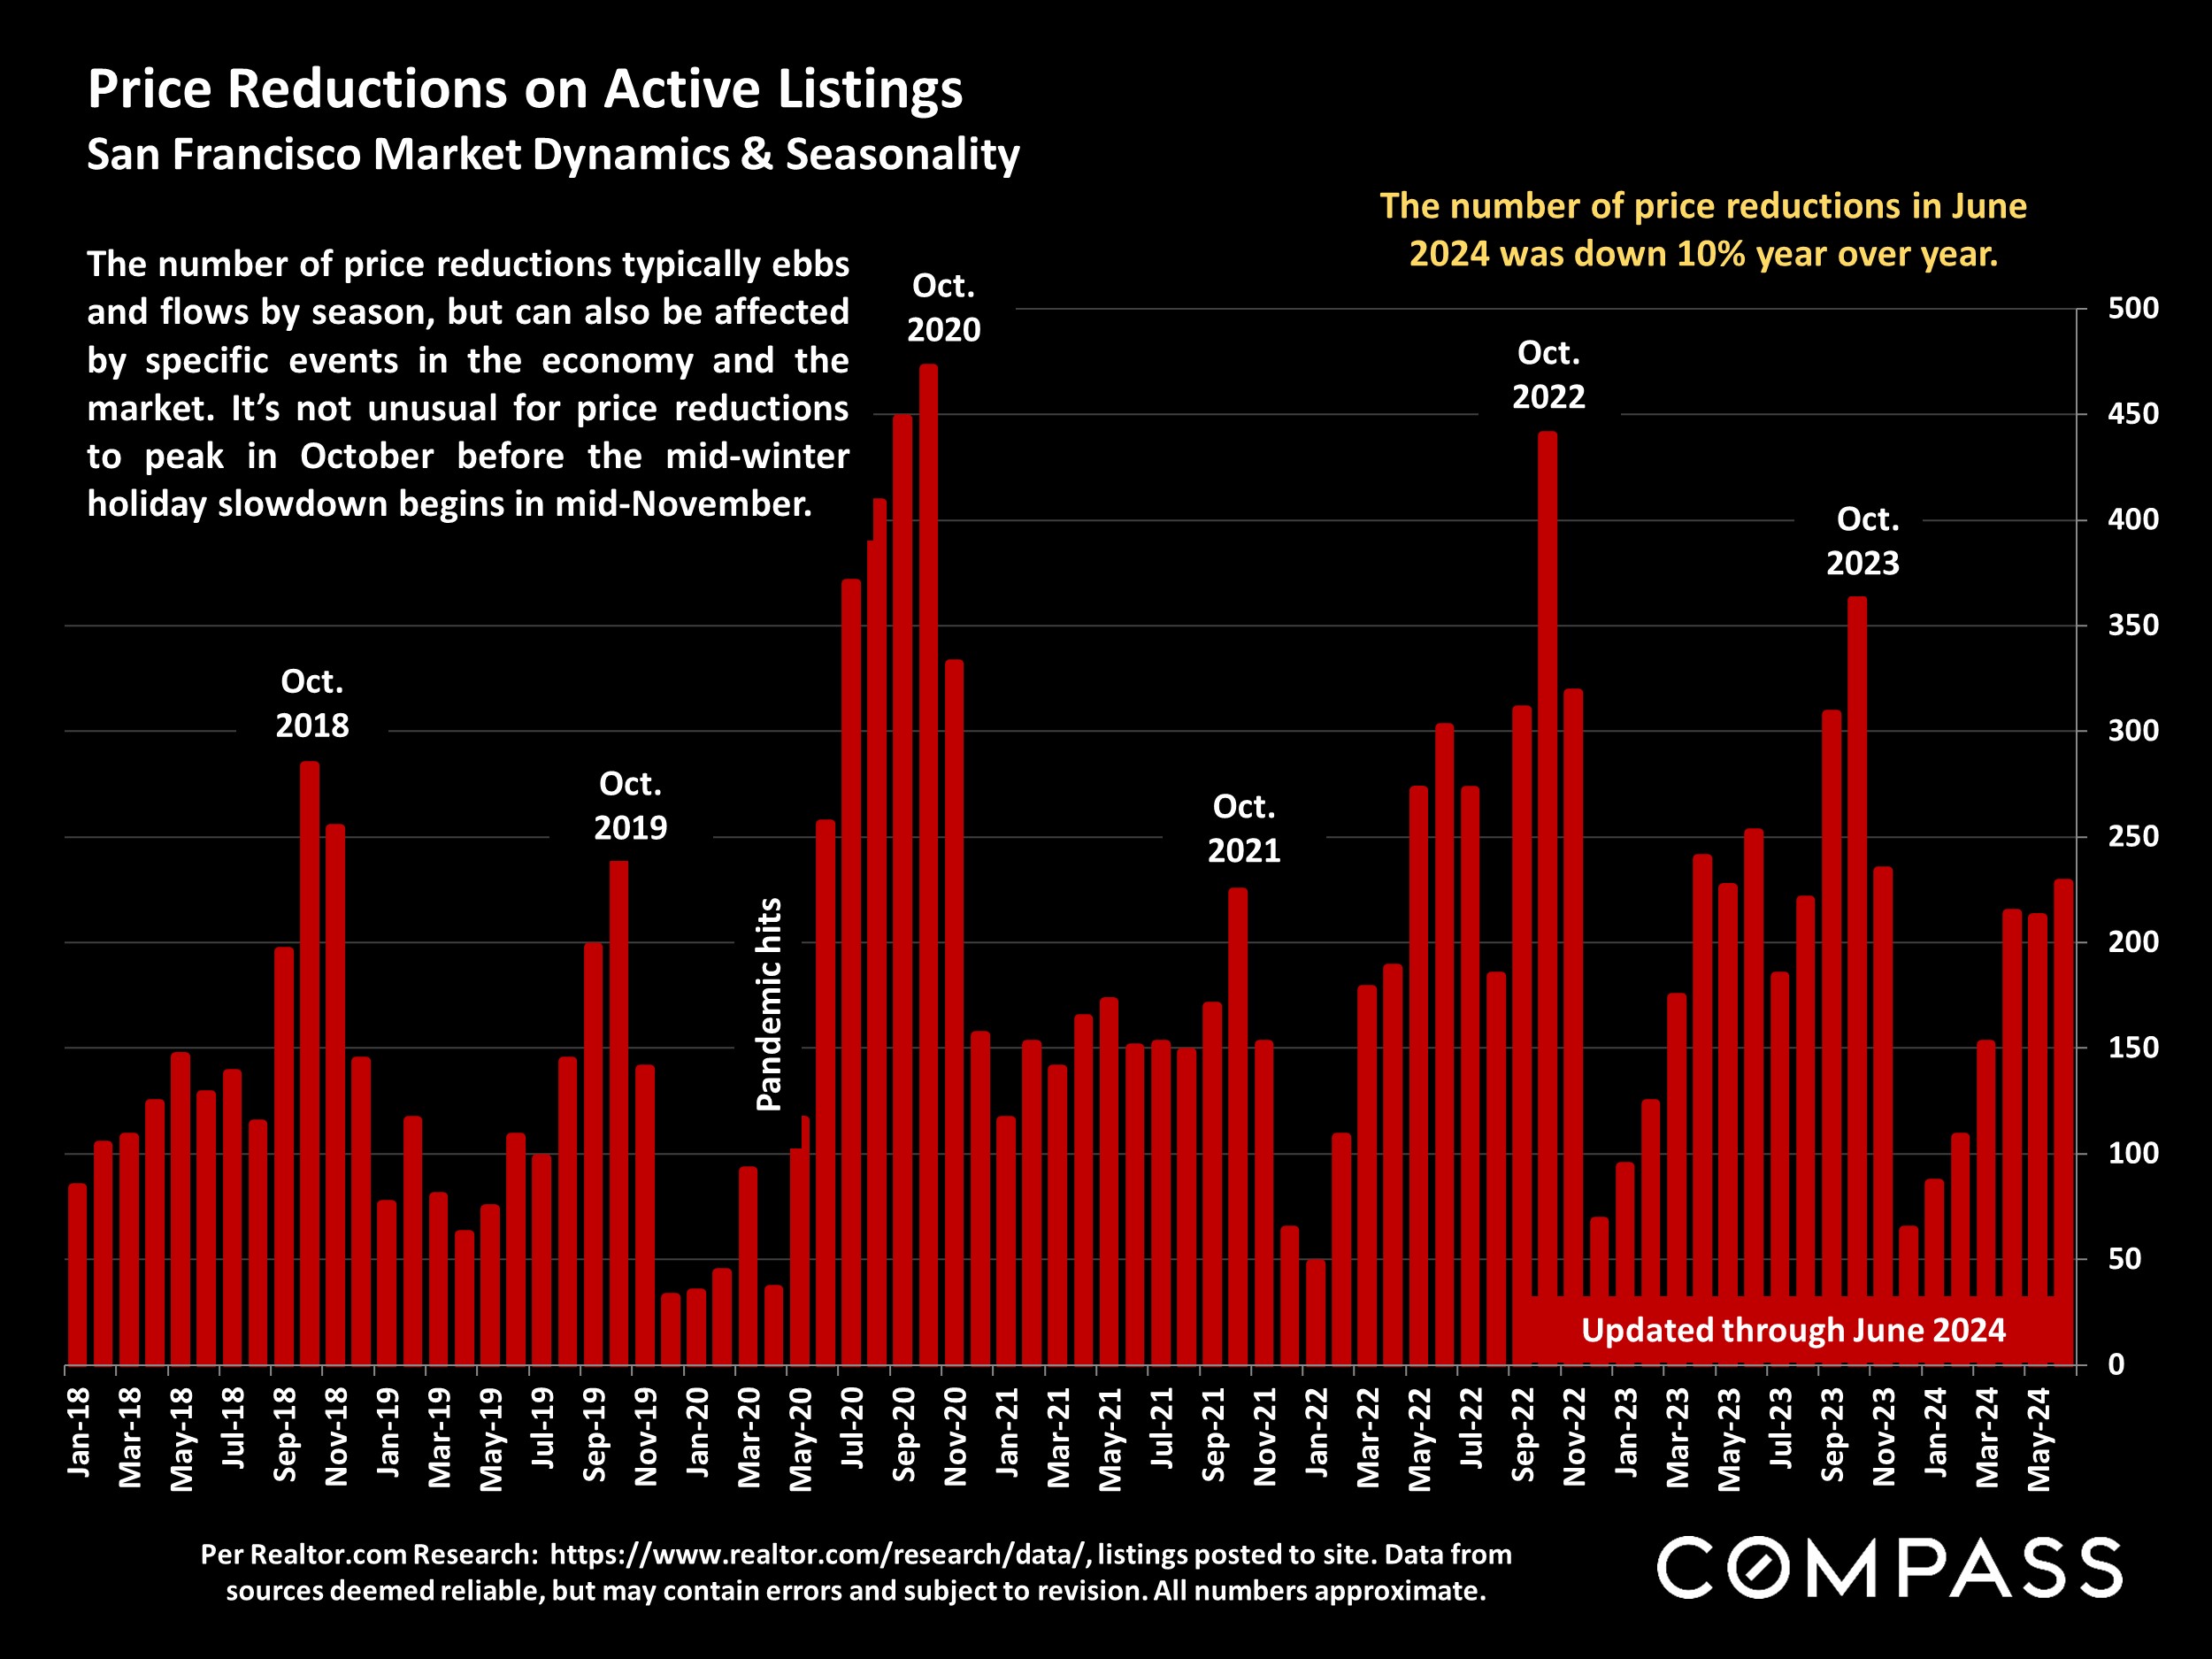
  • Overbidding percentages hit their highest readings, and average days on the market their lowest readings in 2 years. The number of price reductions declined year over year.
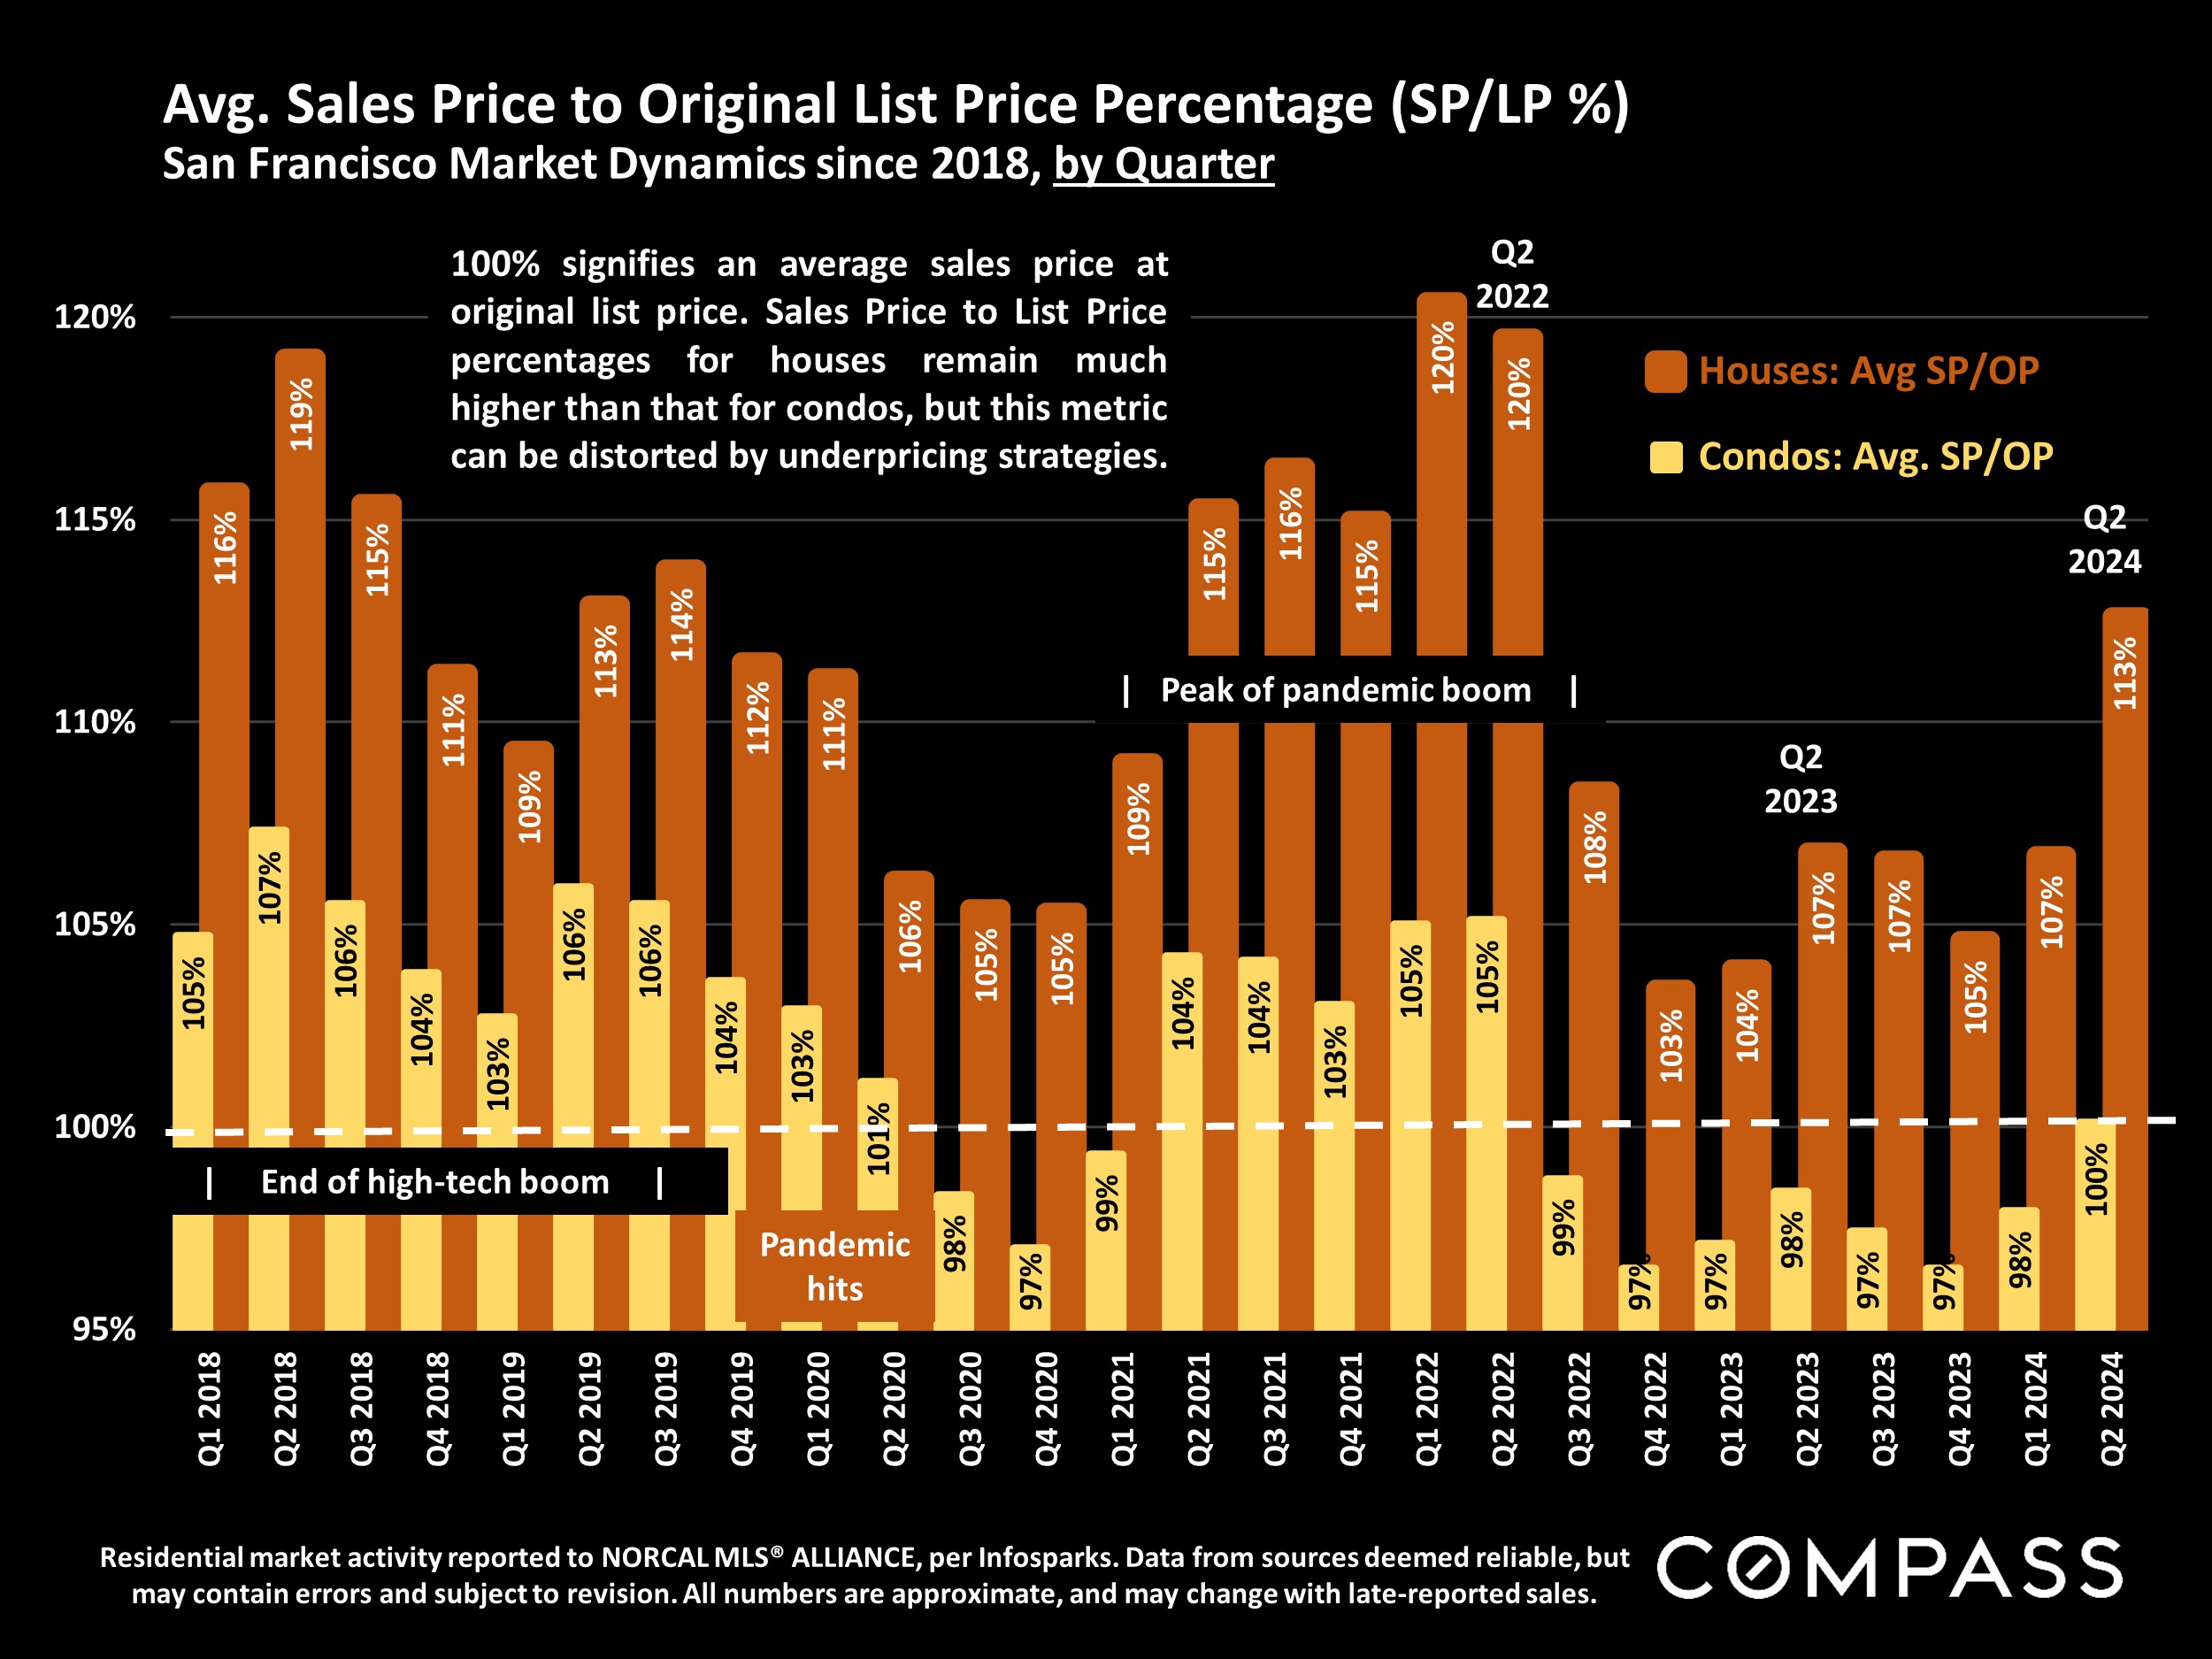
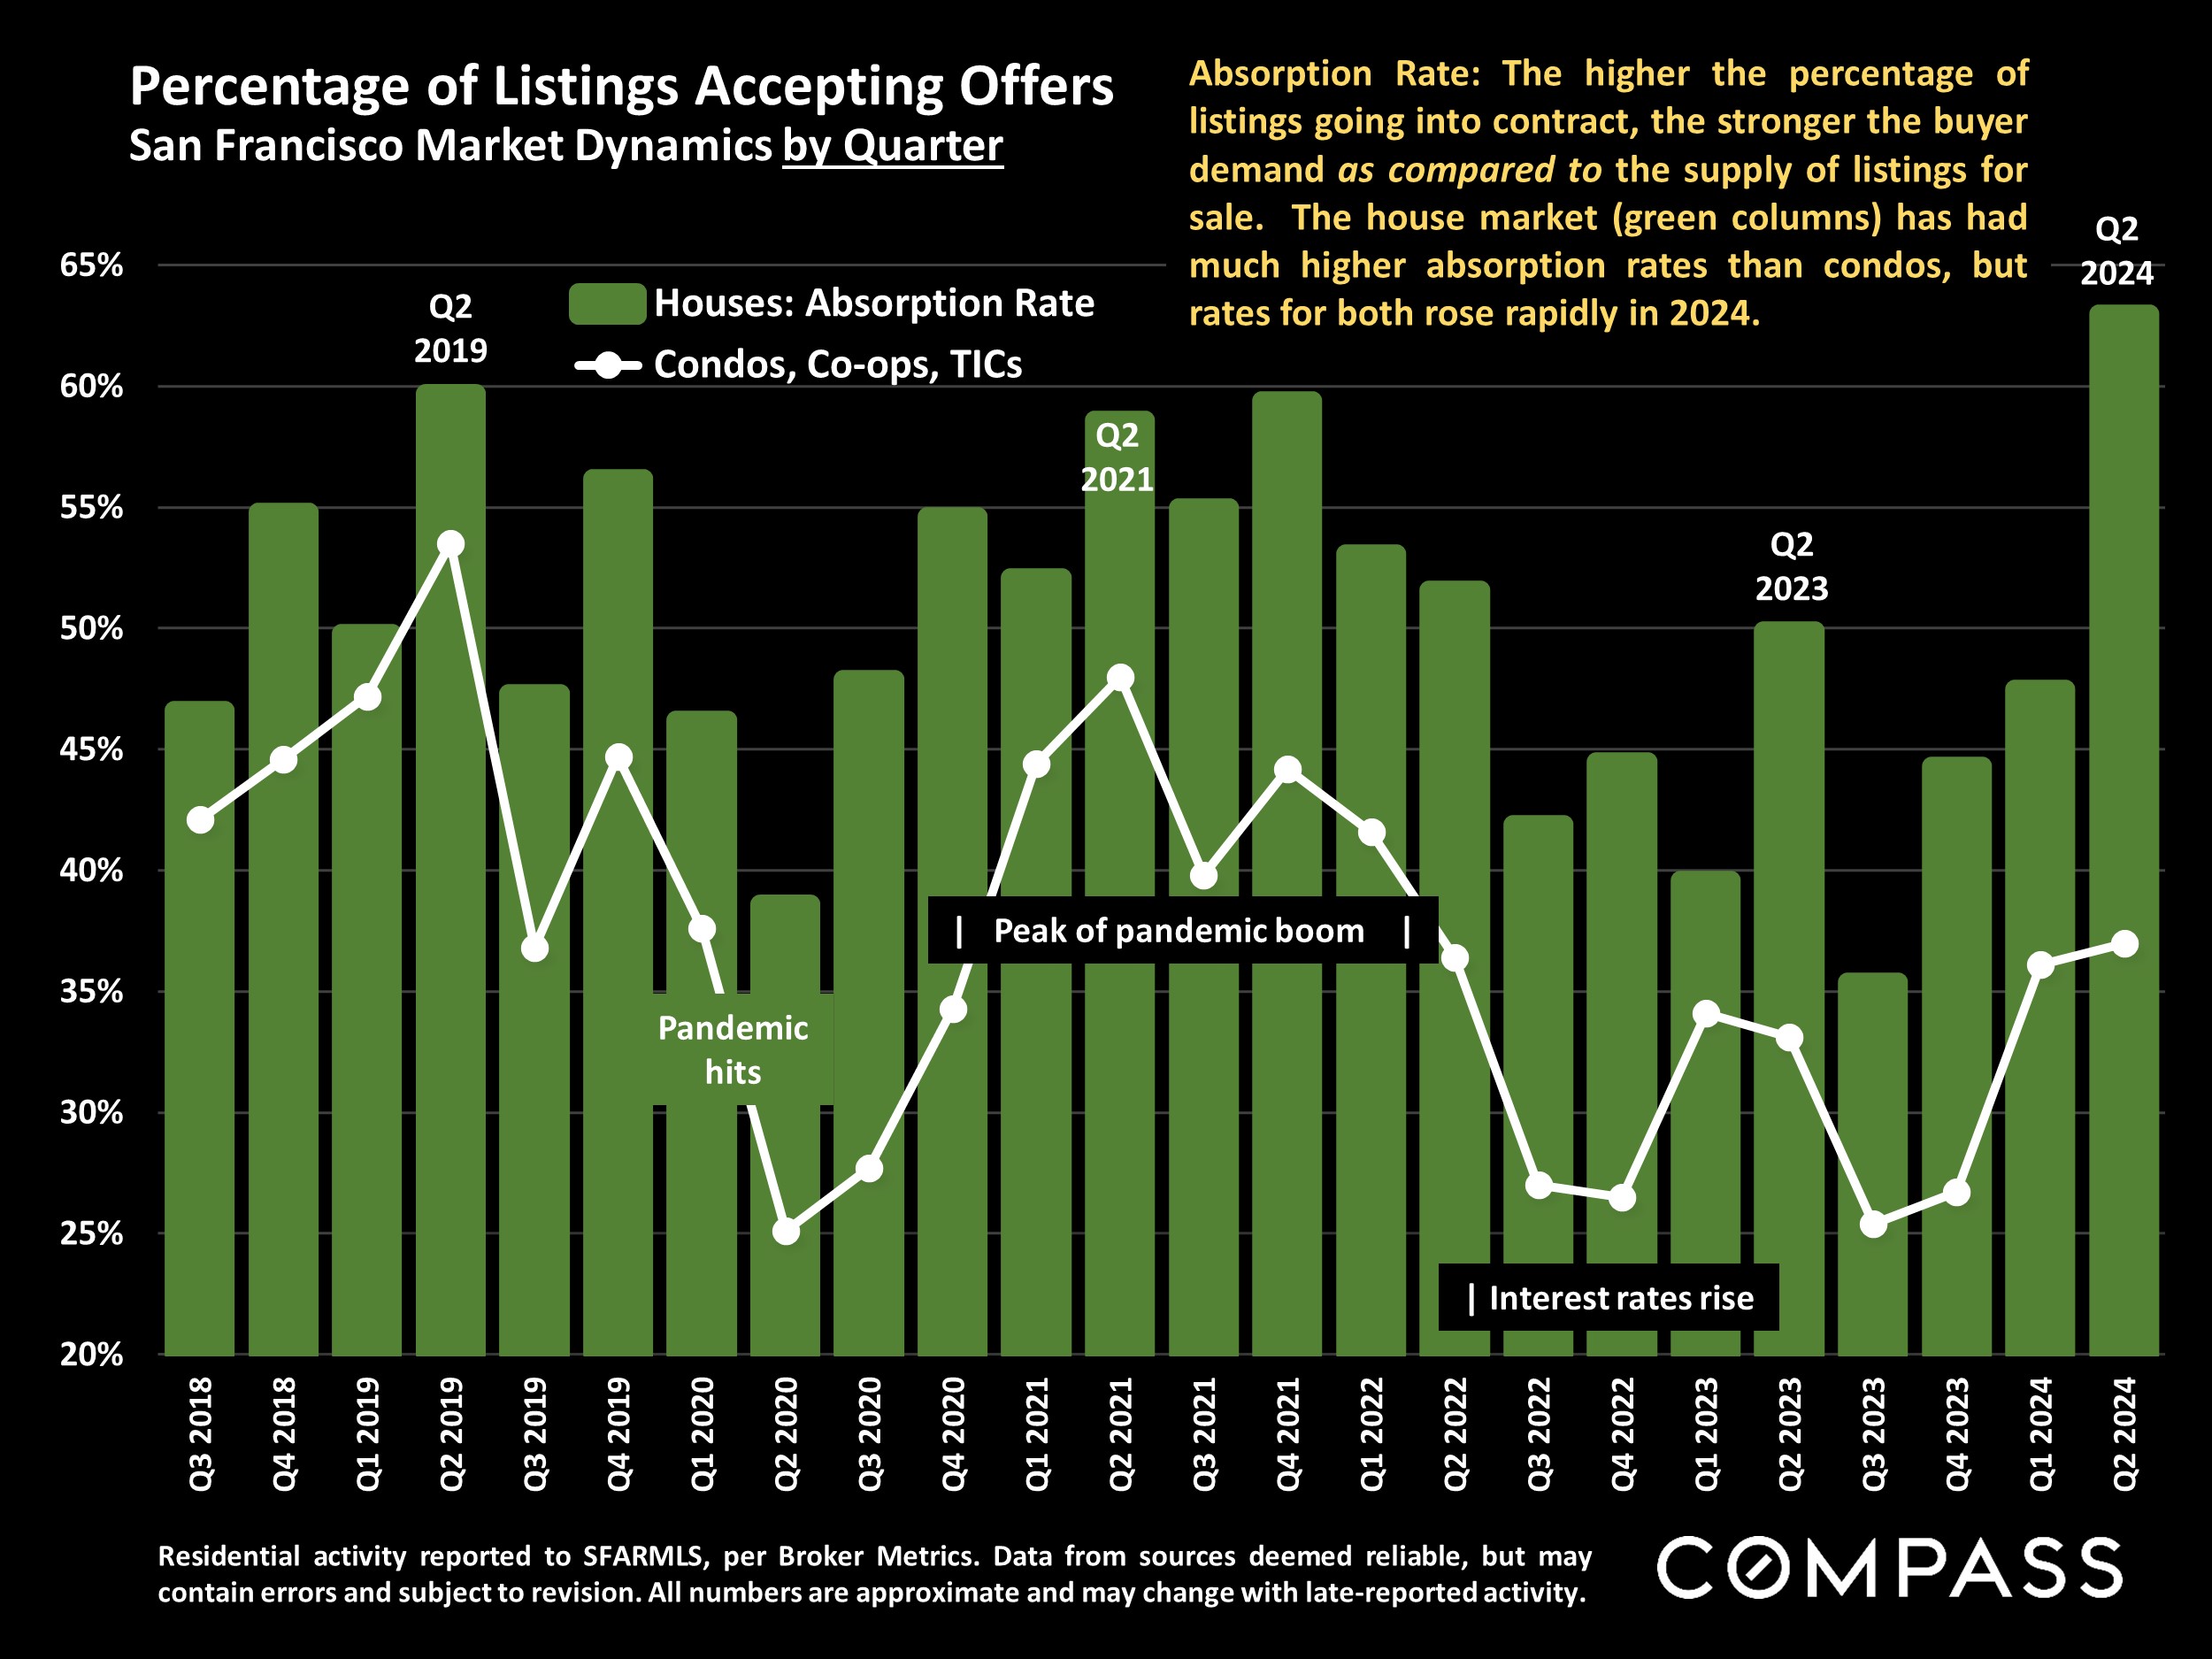
  • Market dynamics continue to be much more heated in the housing market than in the condo market, reflecting significant differences in supply and demand in those segments.

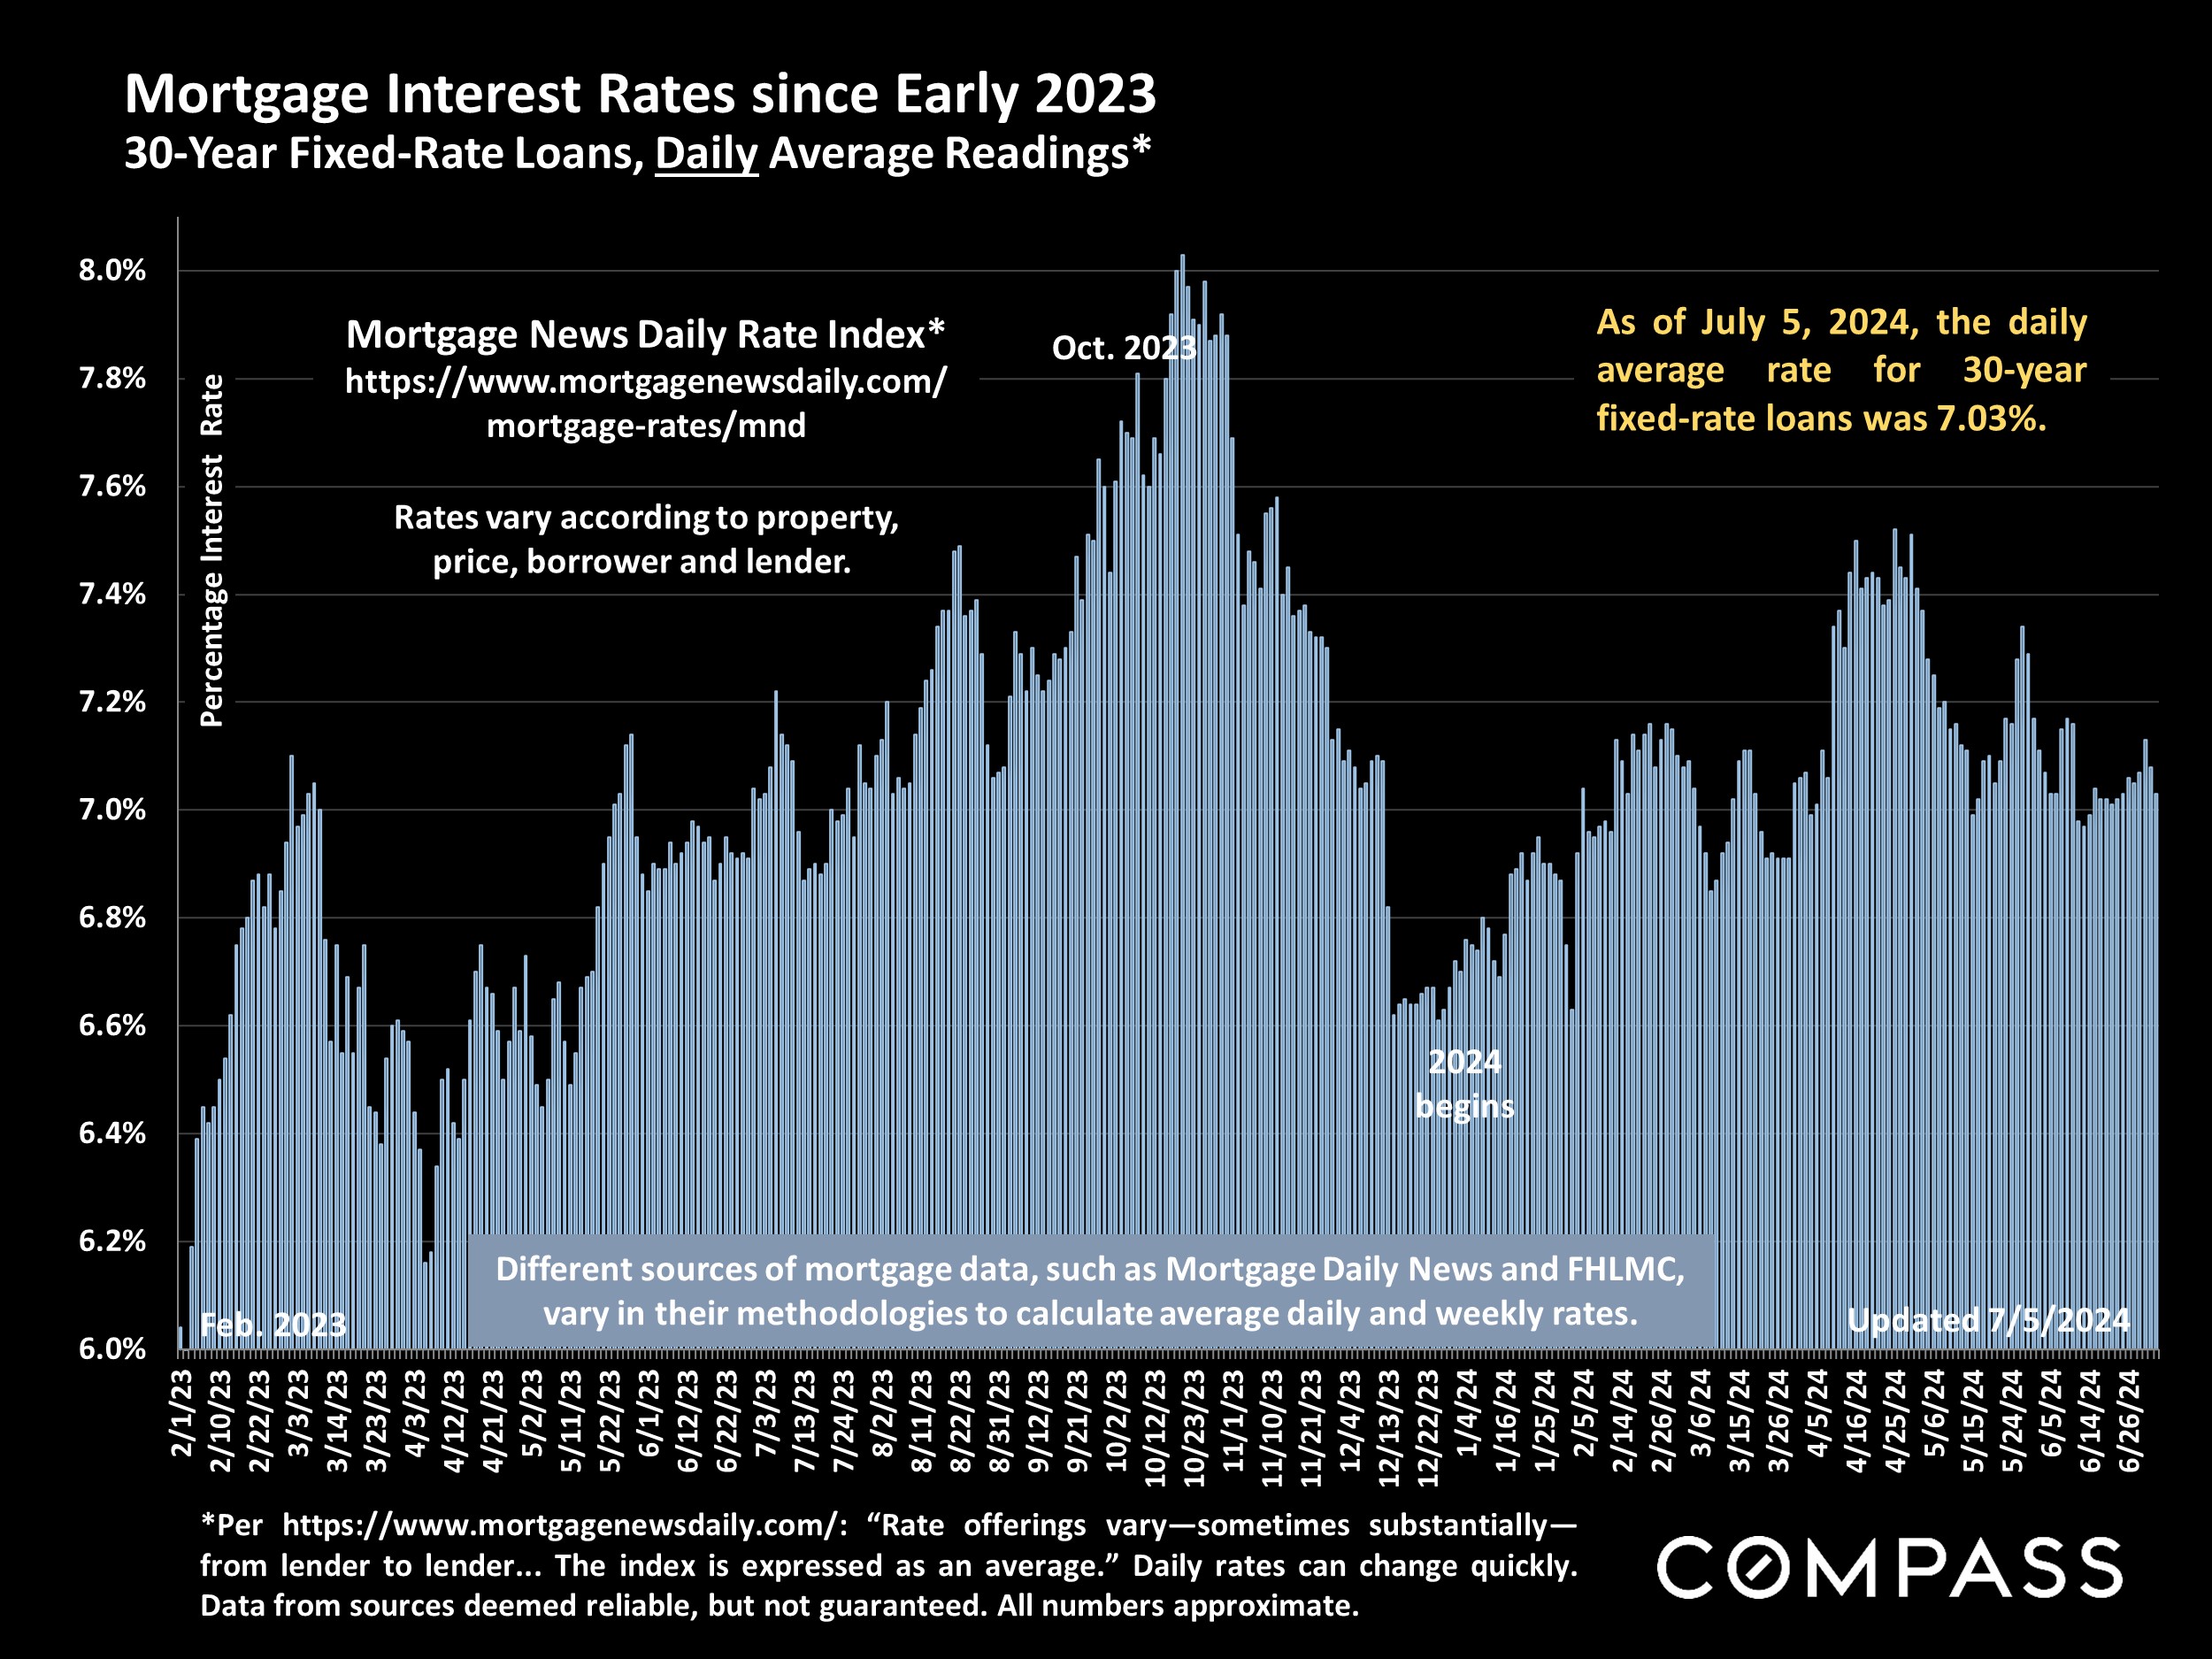
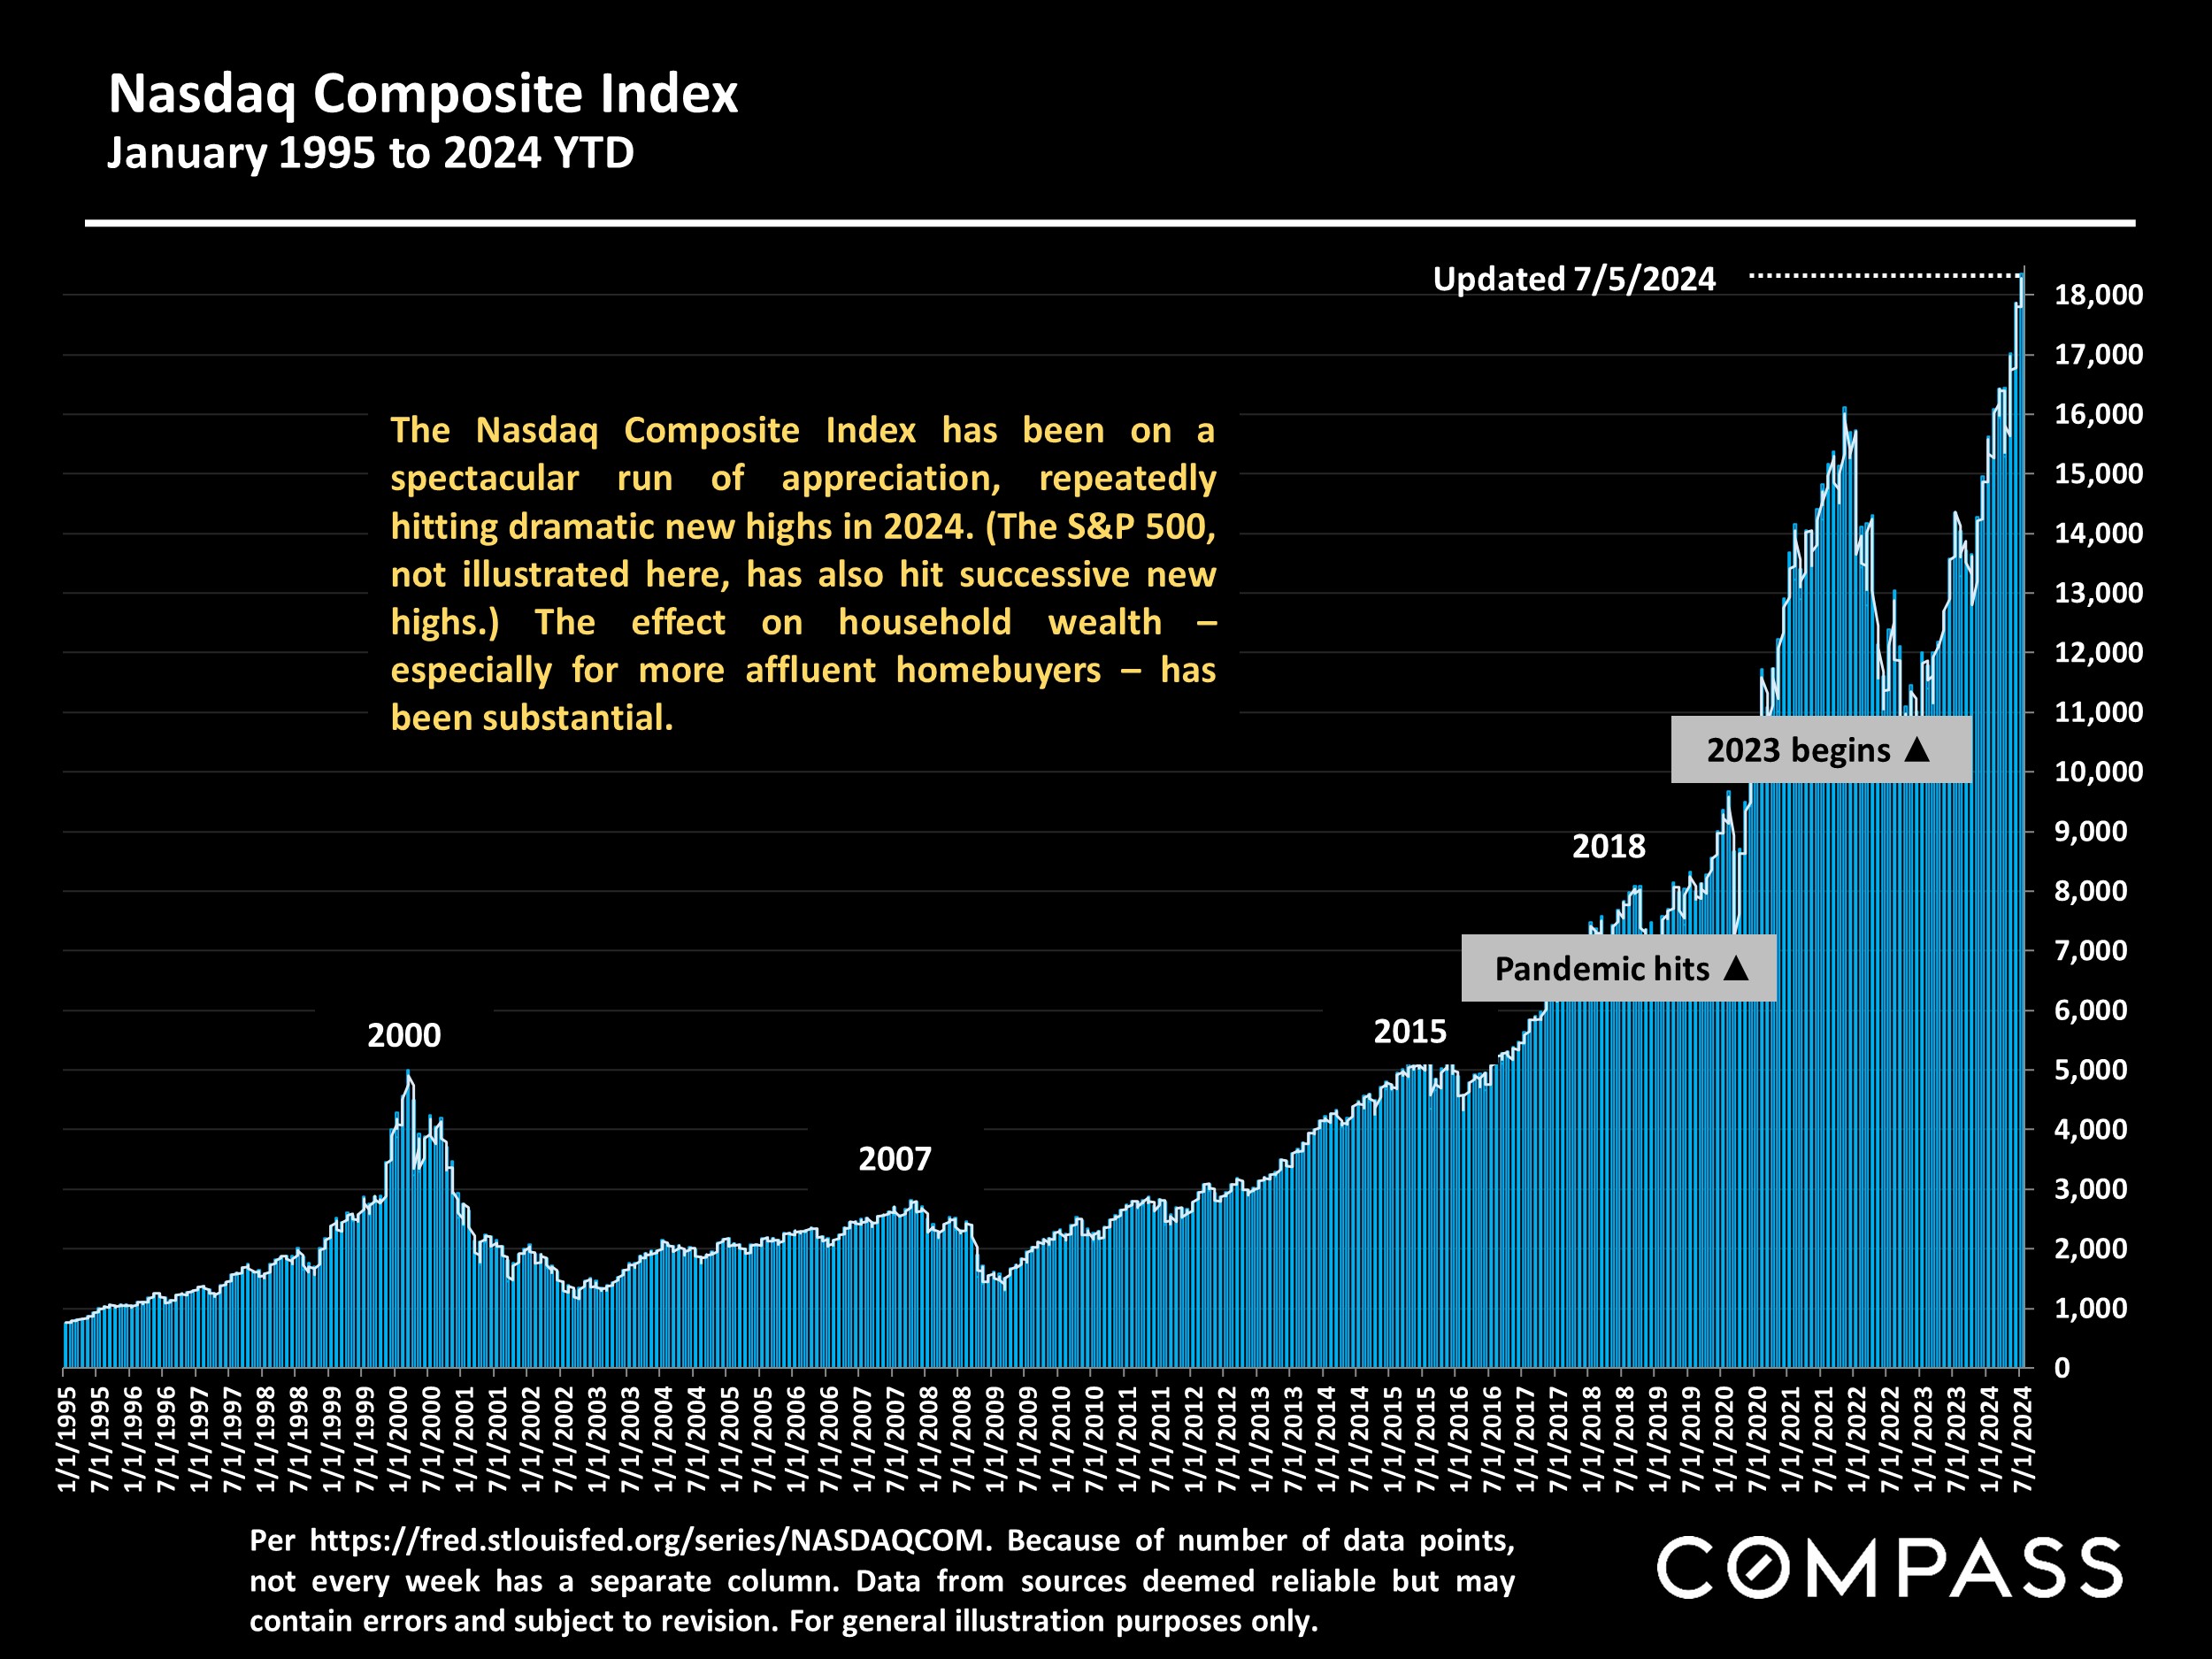
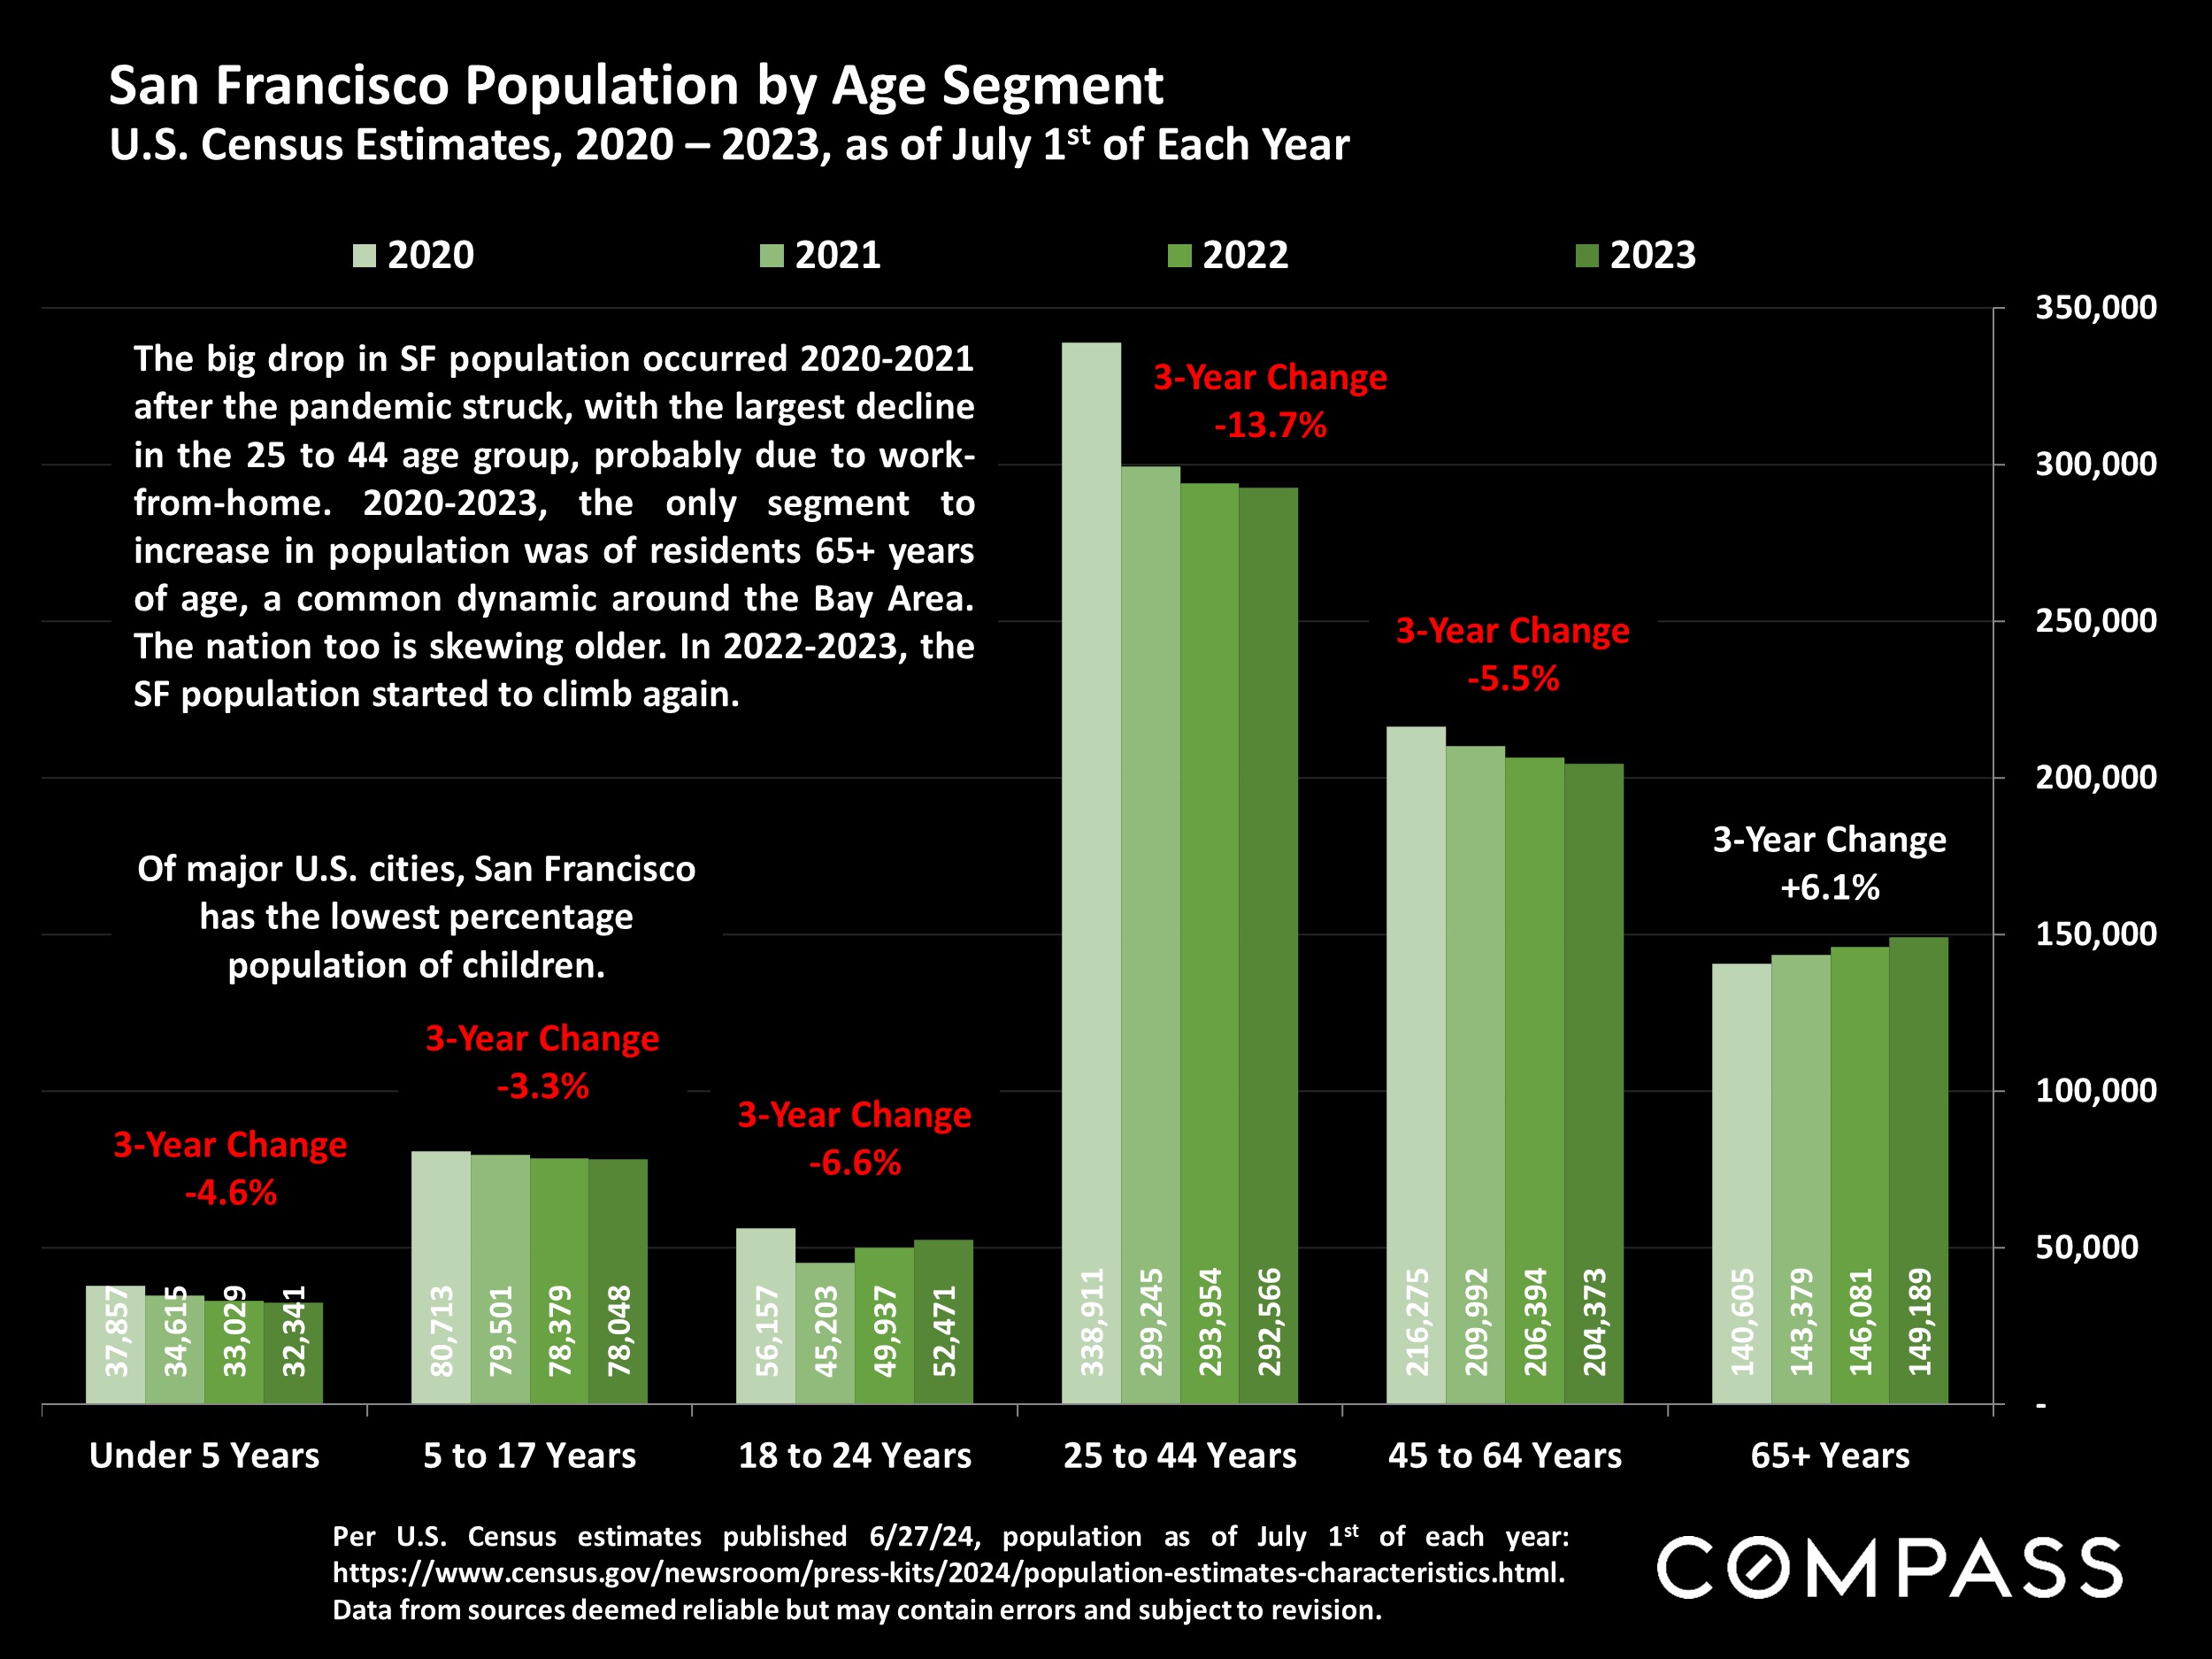
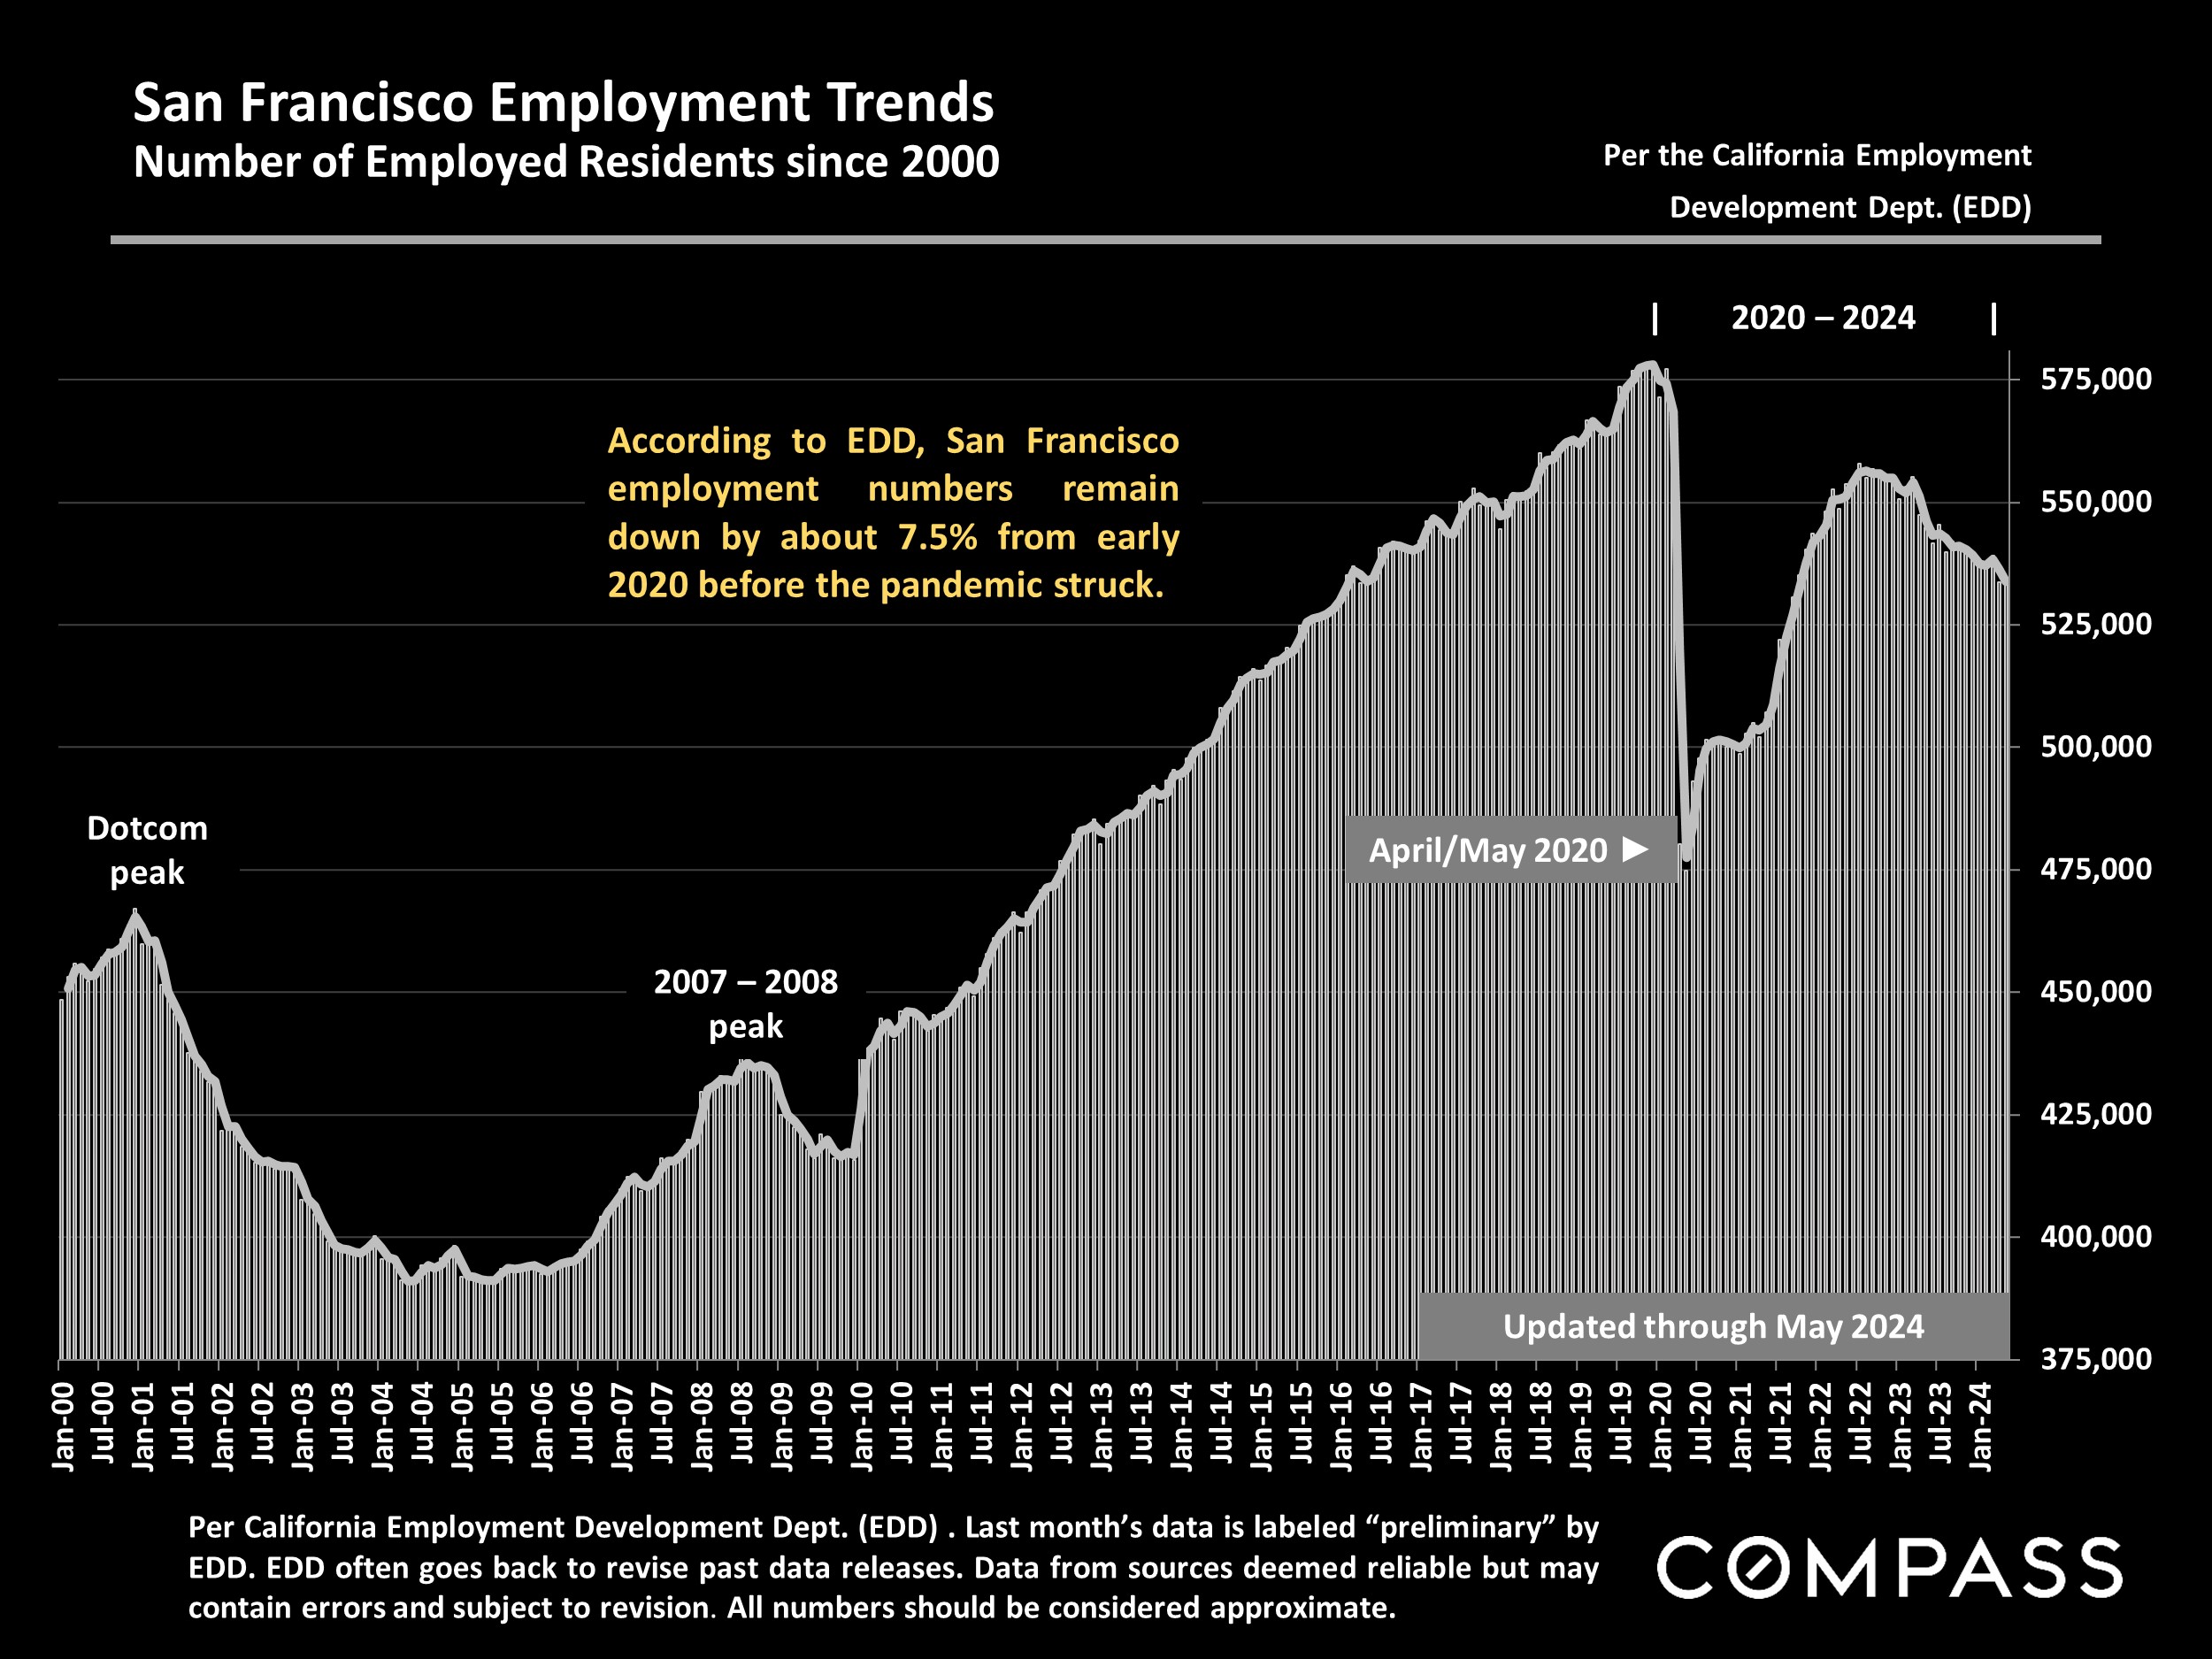
As of early July, mortgage rates continue to hover around 7%, though hopes remain for at least one reduction in the Fed's benchmark rate in 2024. Stock markets have sustained their extraordinary rise. The homeowner's insurance situation remains challenging, with policies often difficult to locate and increasingly expensive. The latest Census estimates revealed the Bay Area is growing older, with fewer children and a rising number of residents aged 65+.

Mortgage Interest Rates since Early 2023 30-Year Fixed-Rate Loans, Daily Average Readings*Nasdaq Composite Index January 1995 to 2024 YTDSan Francisco House Price Trends. Median House Sales Prices, 2012 - Present, by QuarterSan Francisco Condo Price Appreciation. Median Condo Sales Prices, 2012 - Present, by QuarterSan Francisco CONDO Prices: Downtown vs. Non-Downtown 6-Month-Rolling, Median Condo Sales Prices since 2005*San Francisco Value Trends since 2005 3-Month-Rolling, Median Dollar per Square Foot Values*Annual Median HOUSE Sales Prices since 2012. San Francisco Median Sales Prices in Selected Realtor DistrictsAnnual Median HOUSE Sales Prices since 2012 San Francisco Median Sales Prices in Selected Realtor DistrictsAnnual Median CONDO Sales Prices since 2012 San Francisco Median Sales Prices in Selected Realtor DistrictsSan Francisco Home Sales Trends, 2021-2024 Year-over-Year, Year-to-Date Sales by Property Type*Percentage of Sales Over List Price San Francisco Market Dynamics by QuarterAvg. Sales Price to Original List Price Percentage (SP/LP %) San Francisco Market Dynamics since 2018, by QuarterNew Listings Coming on Market San Francisco Market Dynamics & SeasonalitySan Francisco Homes Market Active & Coming-Soon Listings on 1st of Month*Listings Accepting Offers (Going into Contract) San Francisco Market Dynamics & SeasonalityPercentage of Listings Accepting Offers San Francisco Market Dynamics by QuarterMonthly Home Sales Volume San Francisco Market Dynamics & SeasonalitySan Francisco: Number of Home Sales 12-Month-Rolling Totals since 2005*San Francisco Higher-Price Home Sales since 2018 Houses - $3 Milliont, Condos - $2 Milliont, by QuarterSan Francisco Luxury Home Sales* Homes Selling for $5 Million & Above by MonthAverage Days on Market - Speed of Sale San Francisco Market Dynamics by QuarterPrice Reductions on Active Listings San Francisco Market Dynamics & SeasonalitySan Francisco Population by Age Segment U.S. Census Estimates, 2020 - 2023, as of July 1st of Each YearSan Francisco Employment Trends Number of Employed Residents since 2000

Want to learn more about Bay Area market trends?

Let’s connect! With relationships and networks across the city, there are a variety of ways I can help you make informed real estate decisions. Call, email, or text – I’m here to help.


Contact