Feature image for SF: March 2025 Market Stats

April 4, 2025

SF: March 2025 Market Stats

By Compass

March 2025 Report
With Market Data Through February

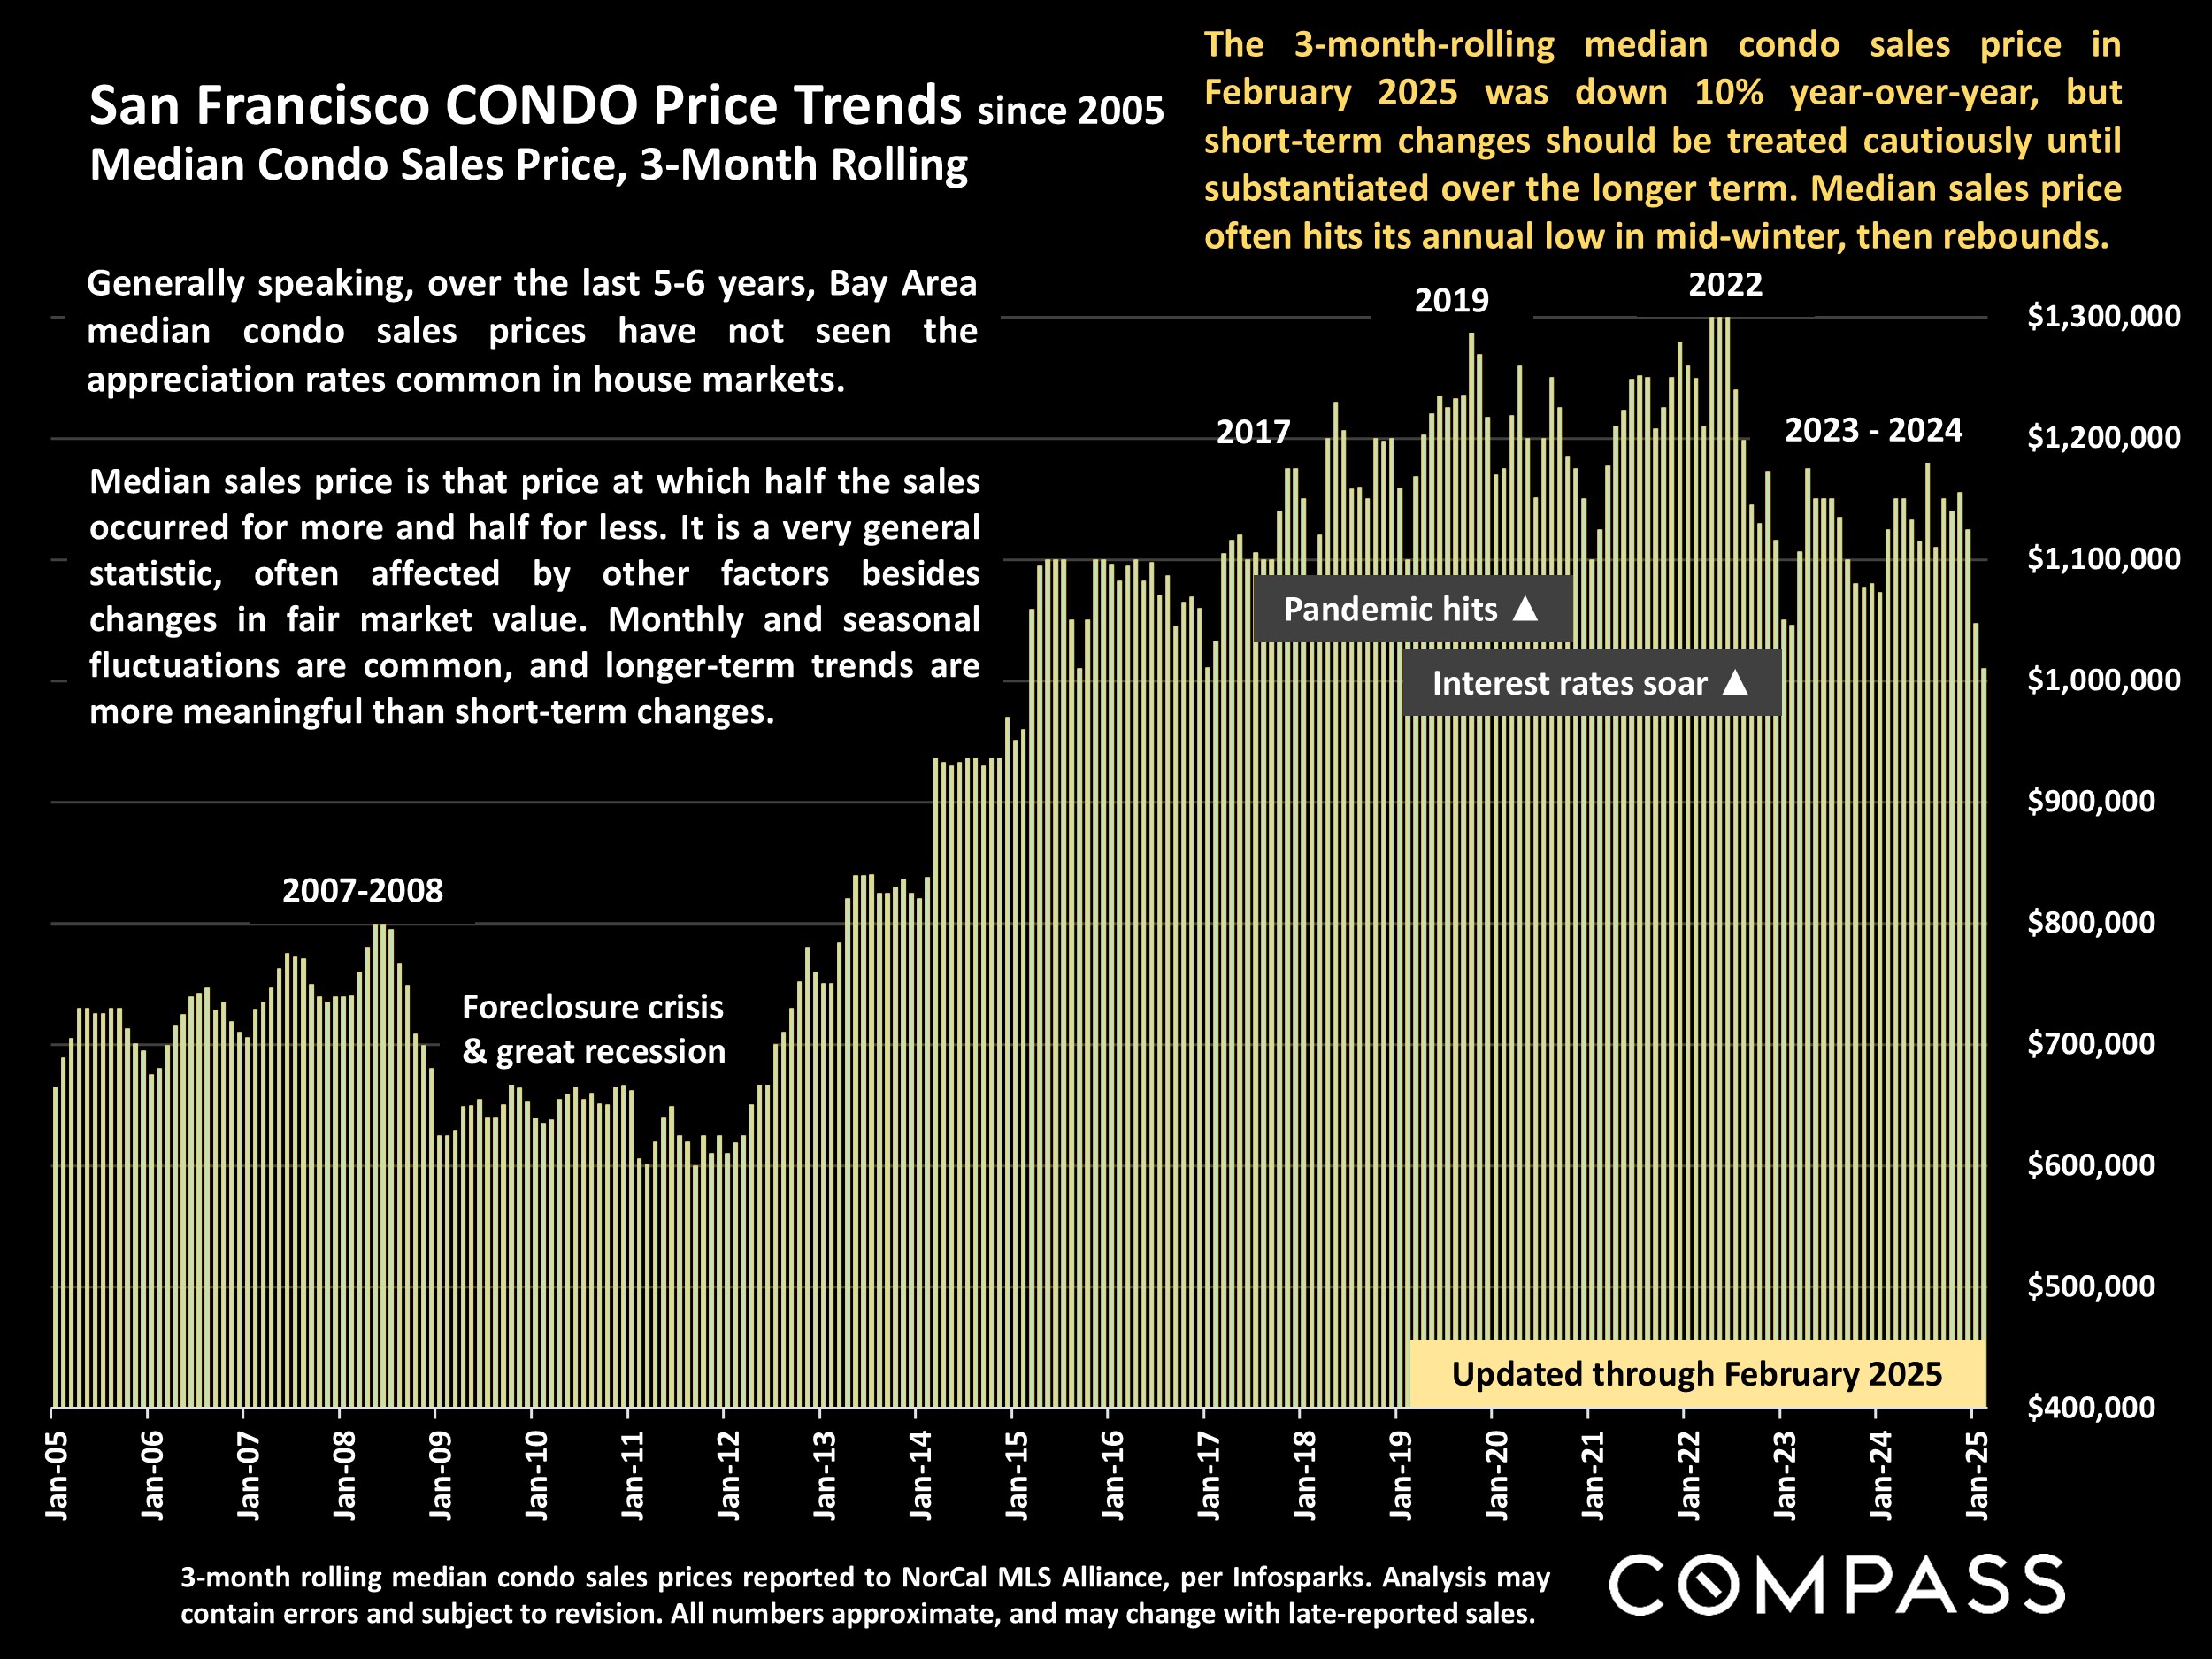
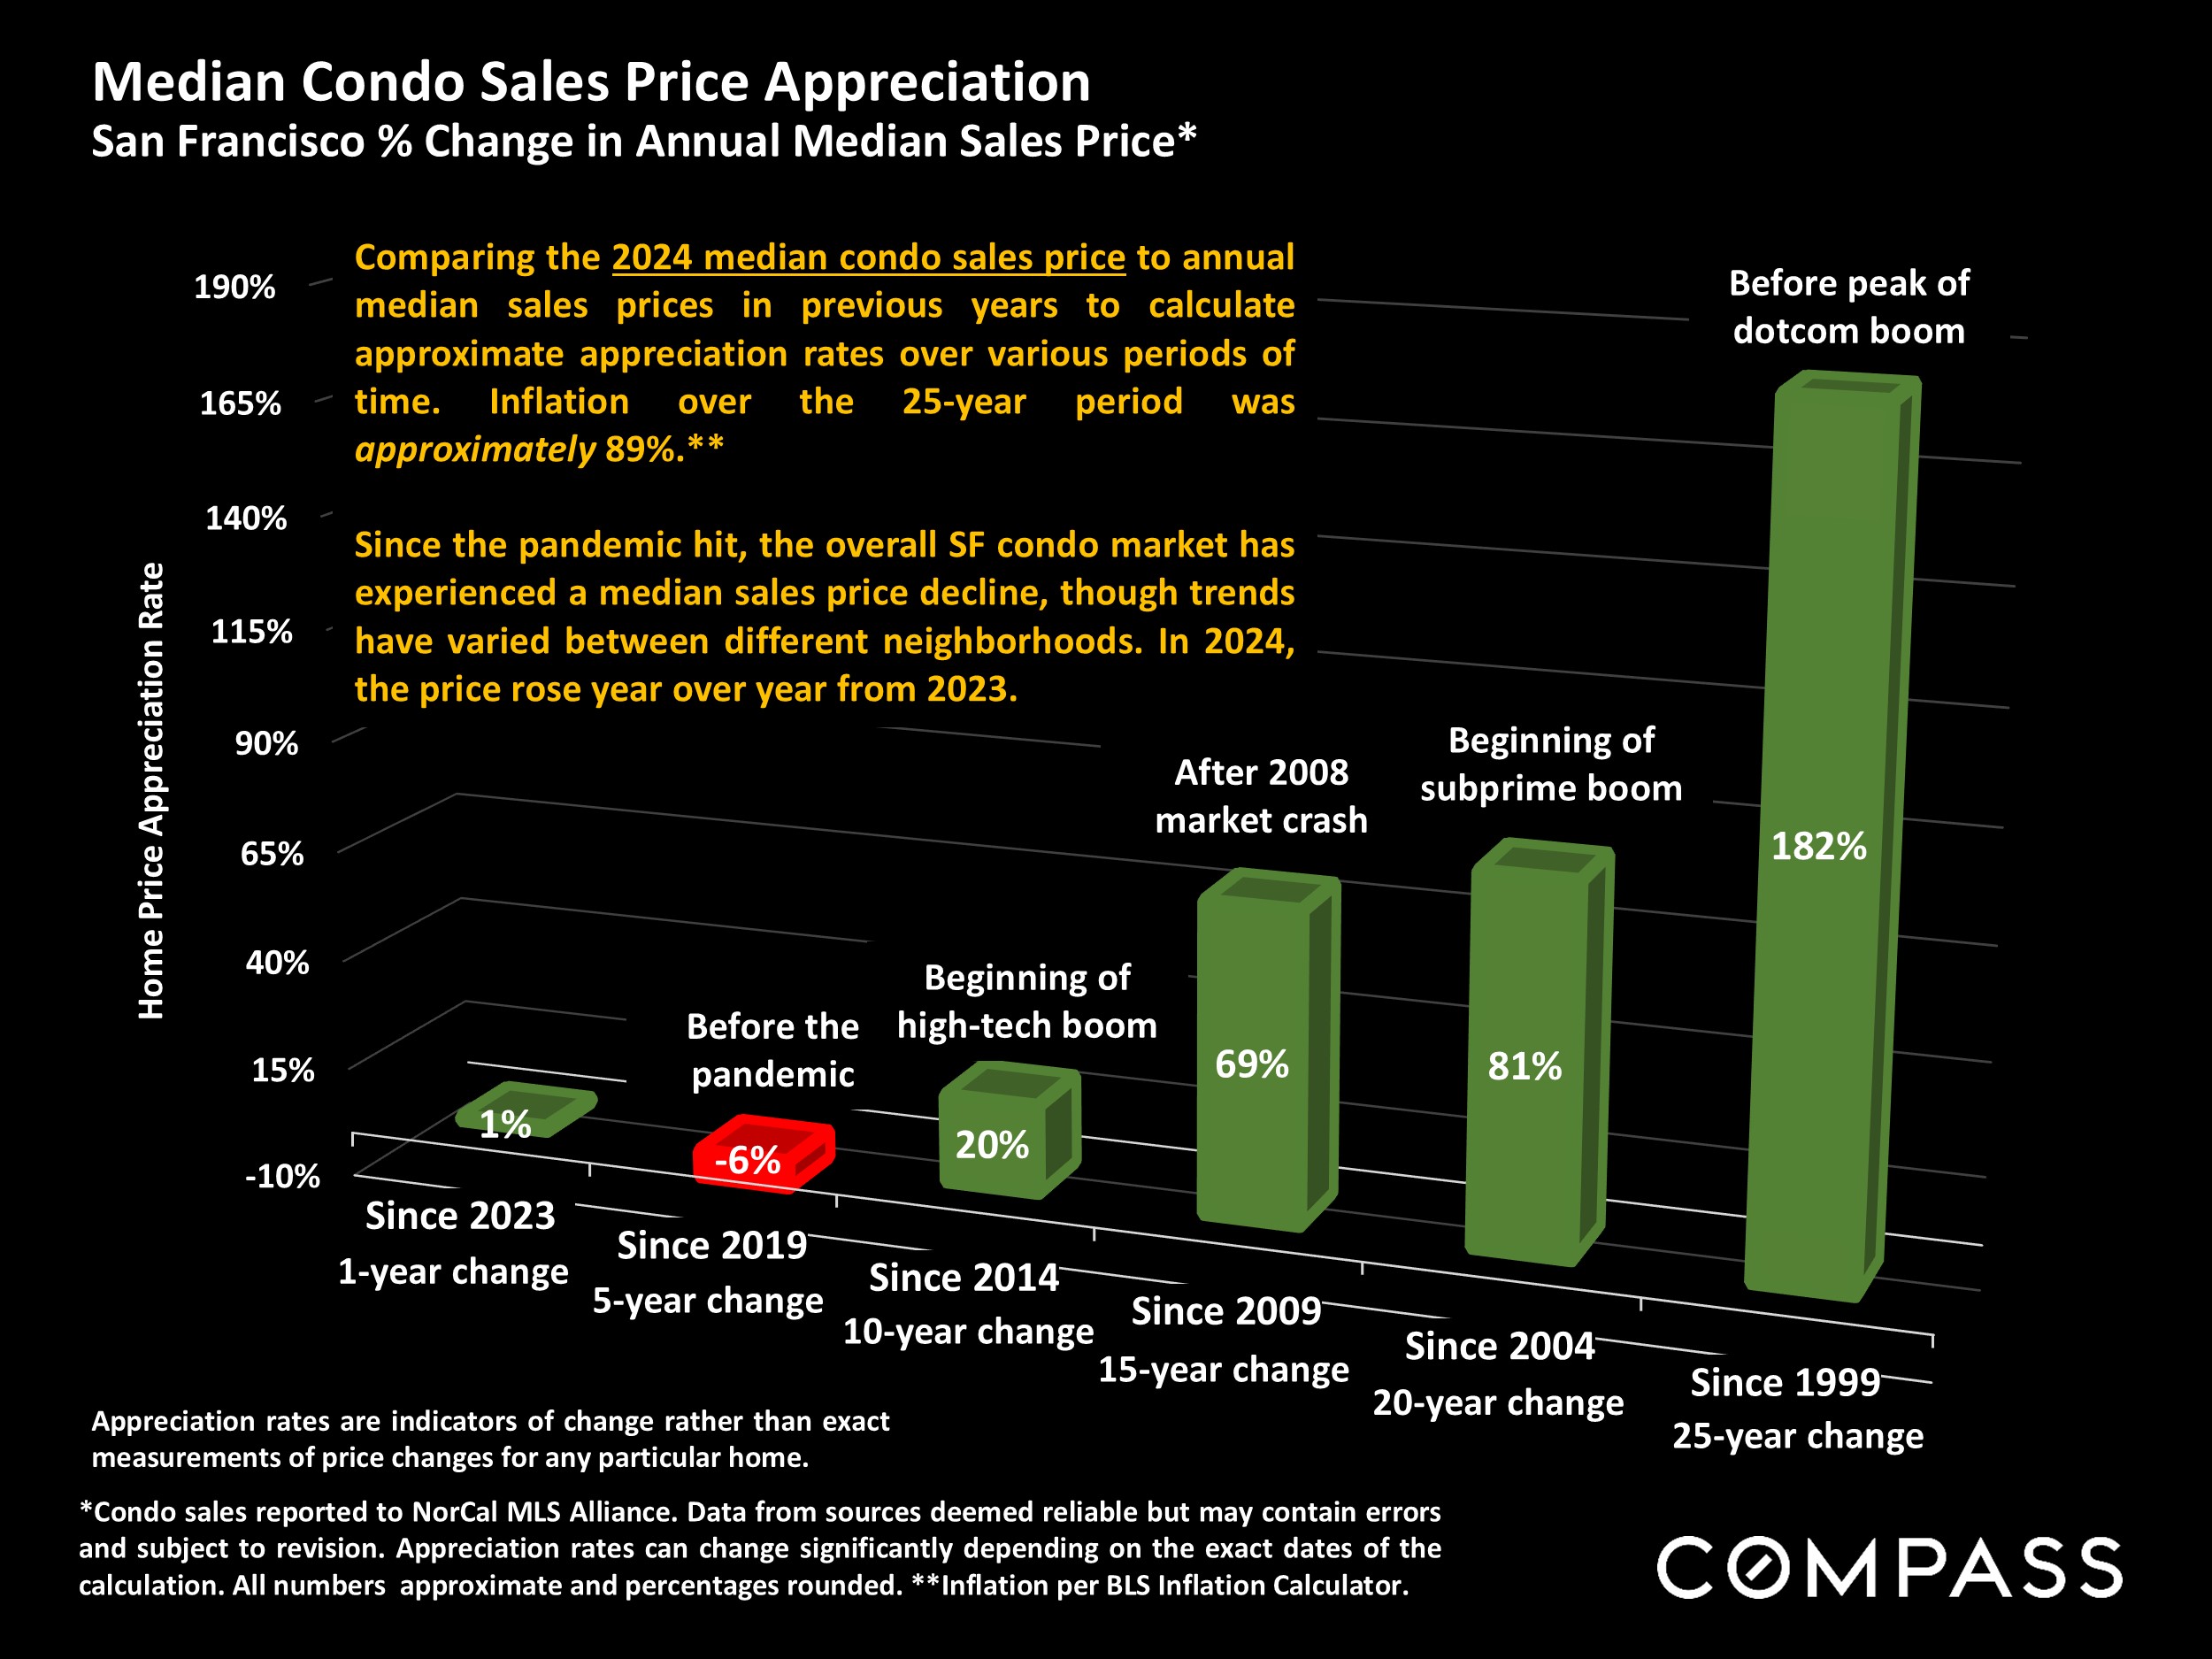
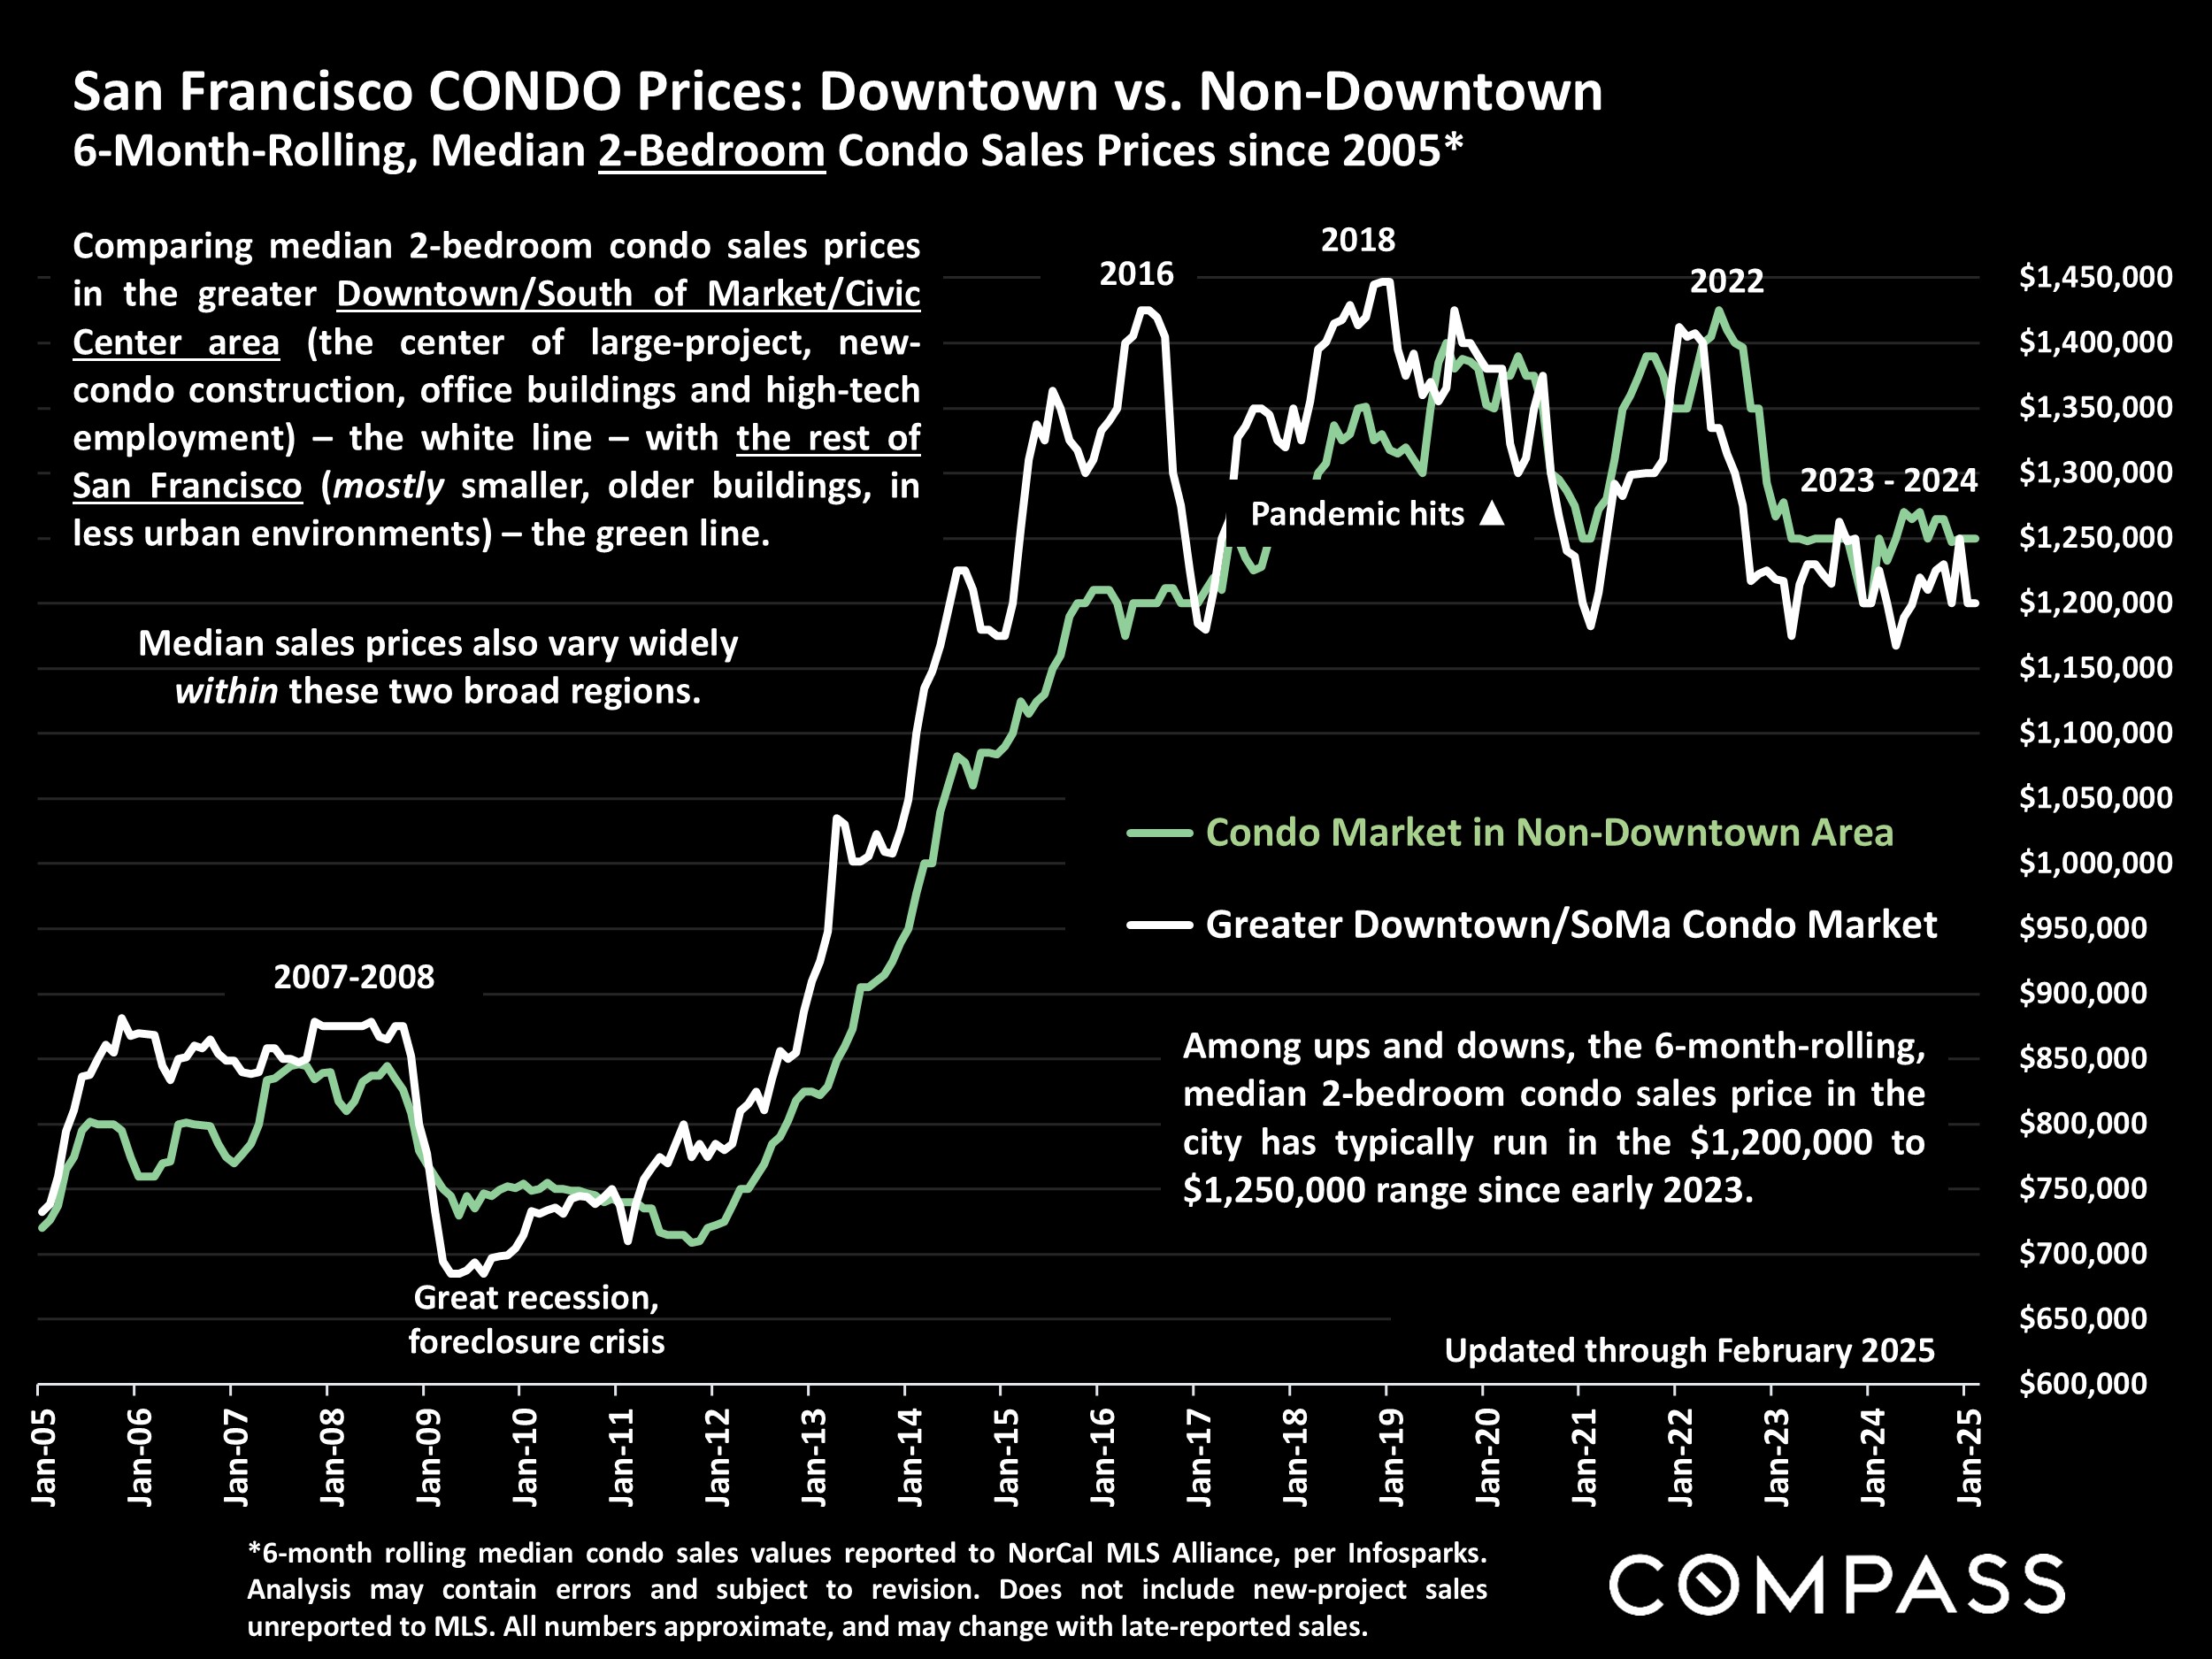
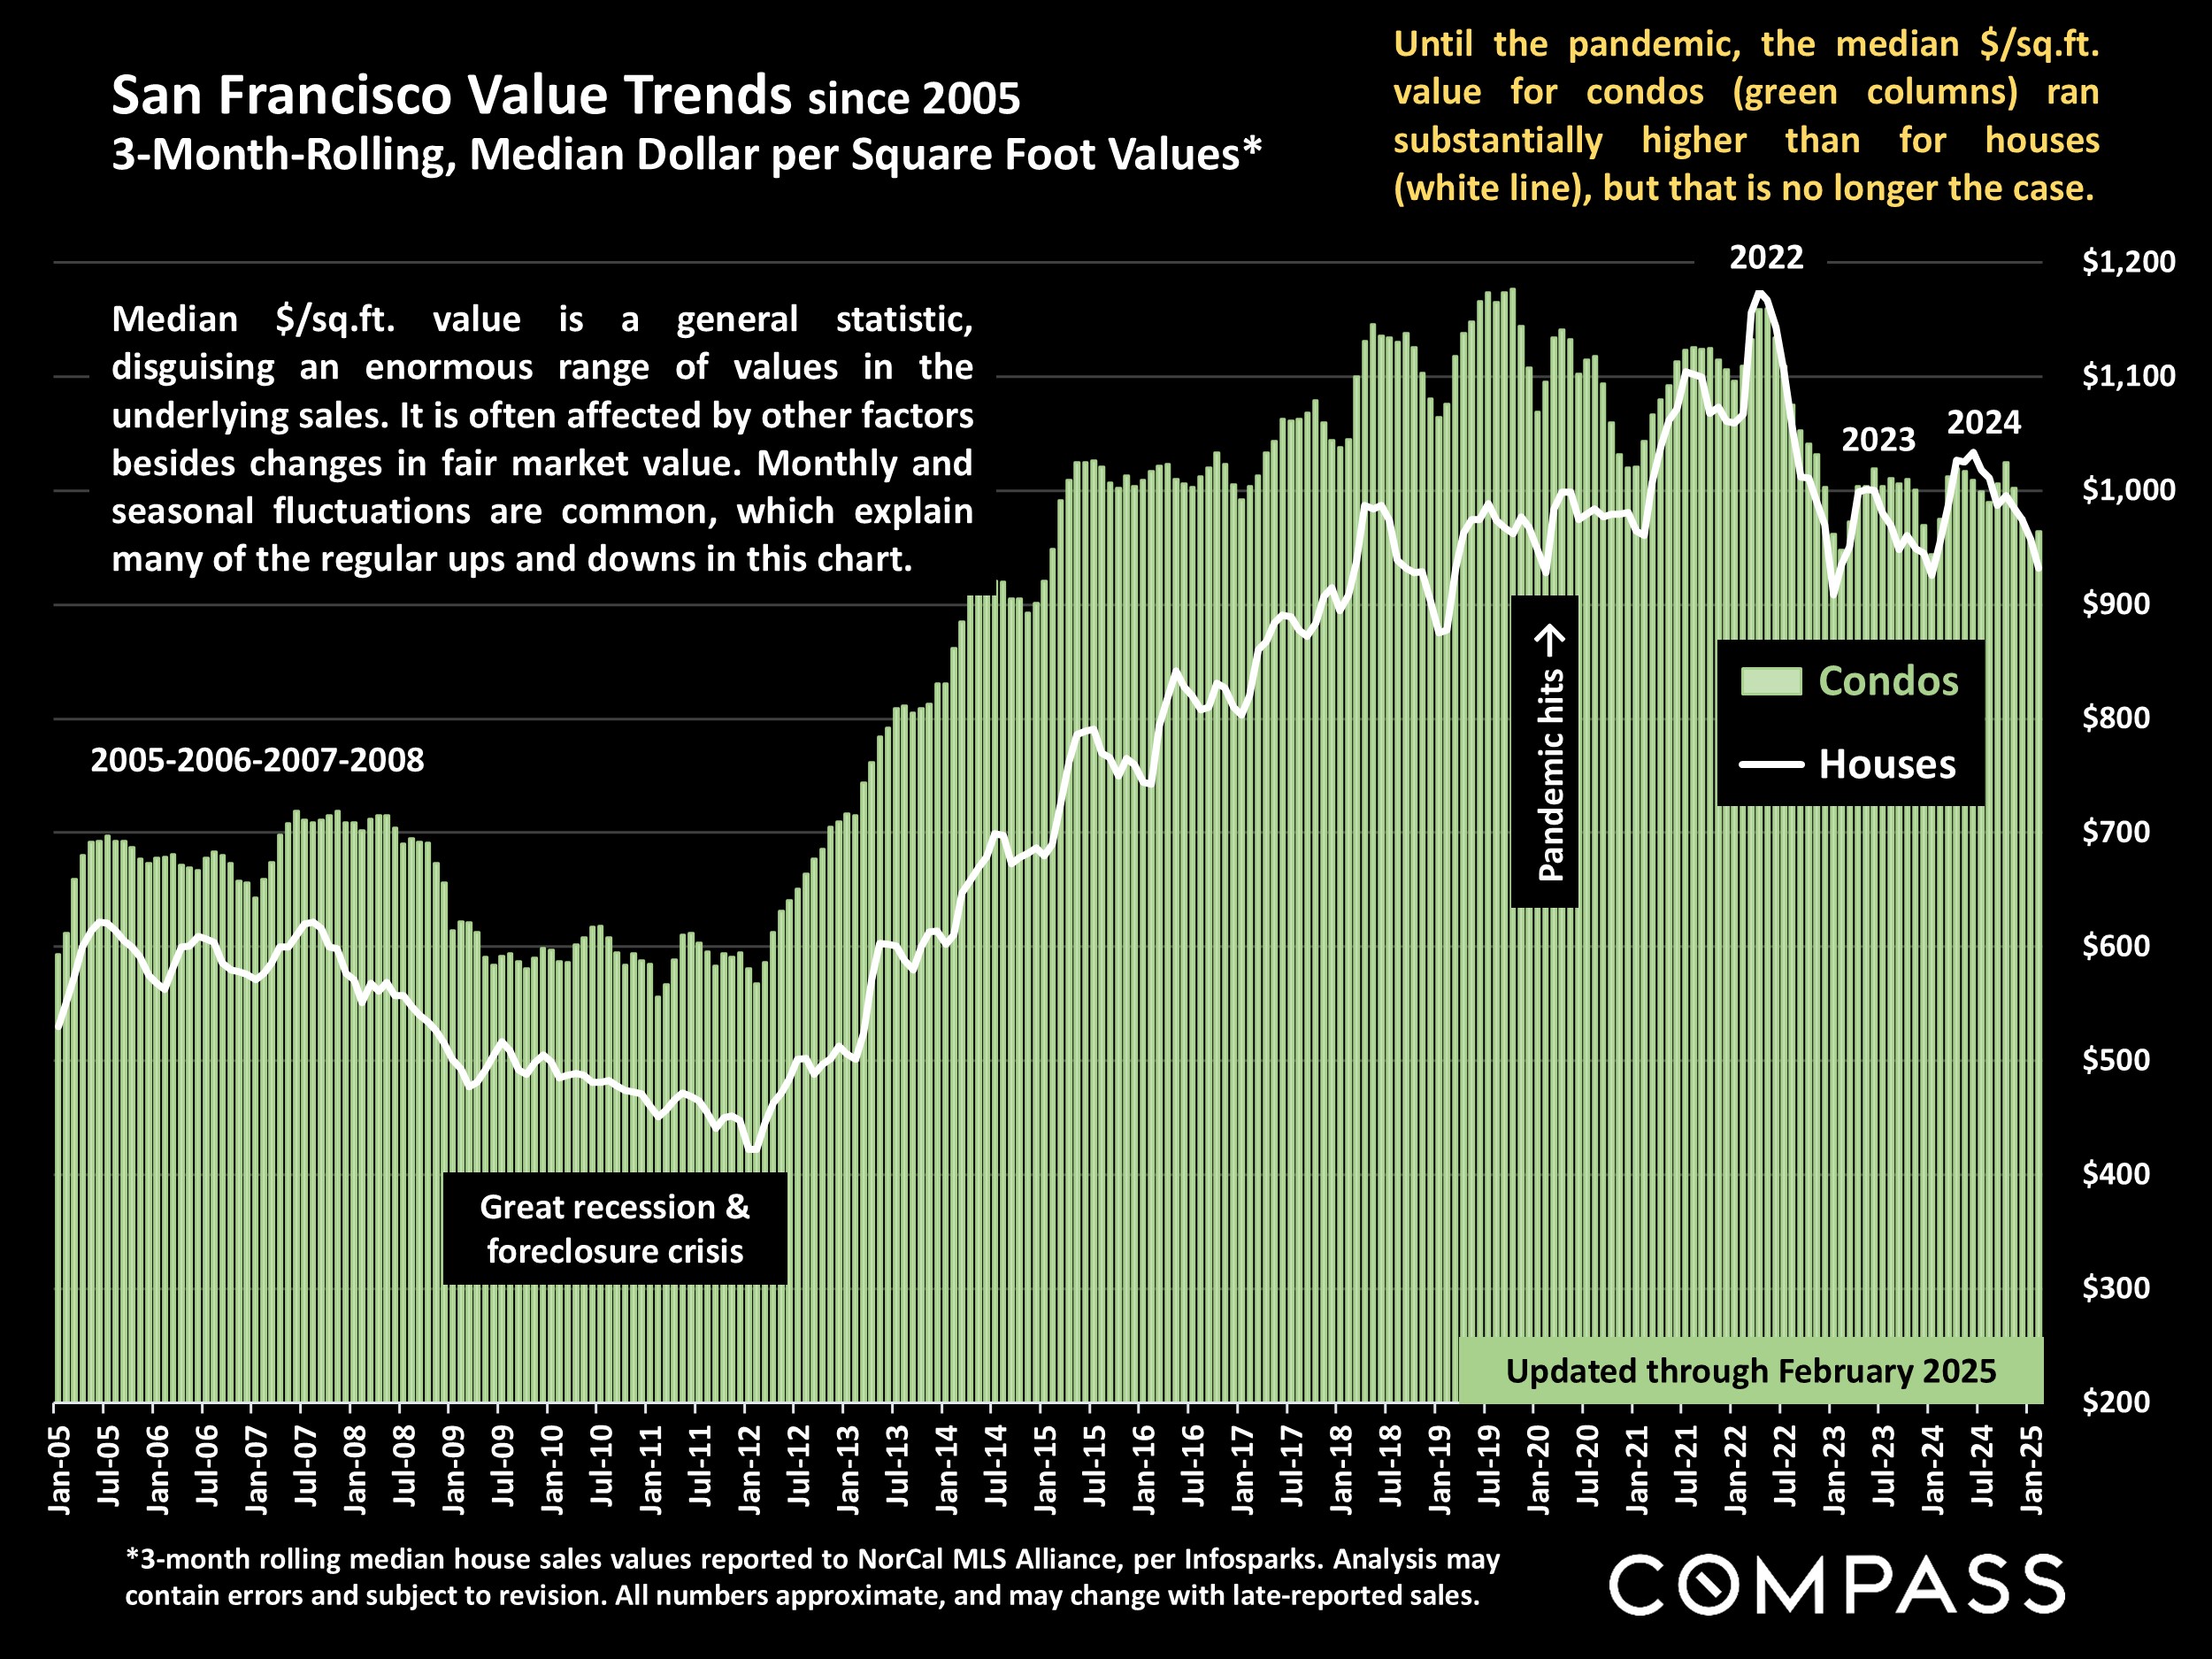
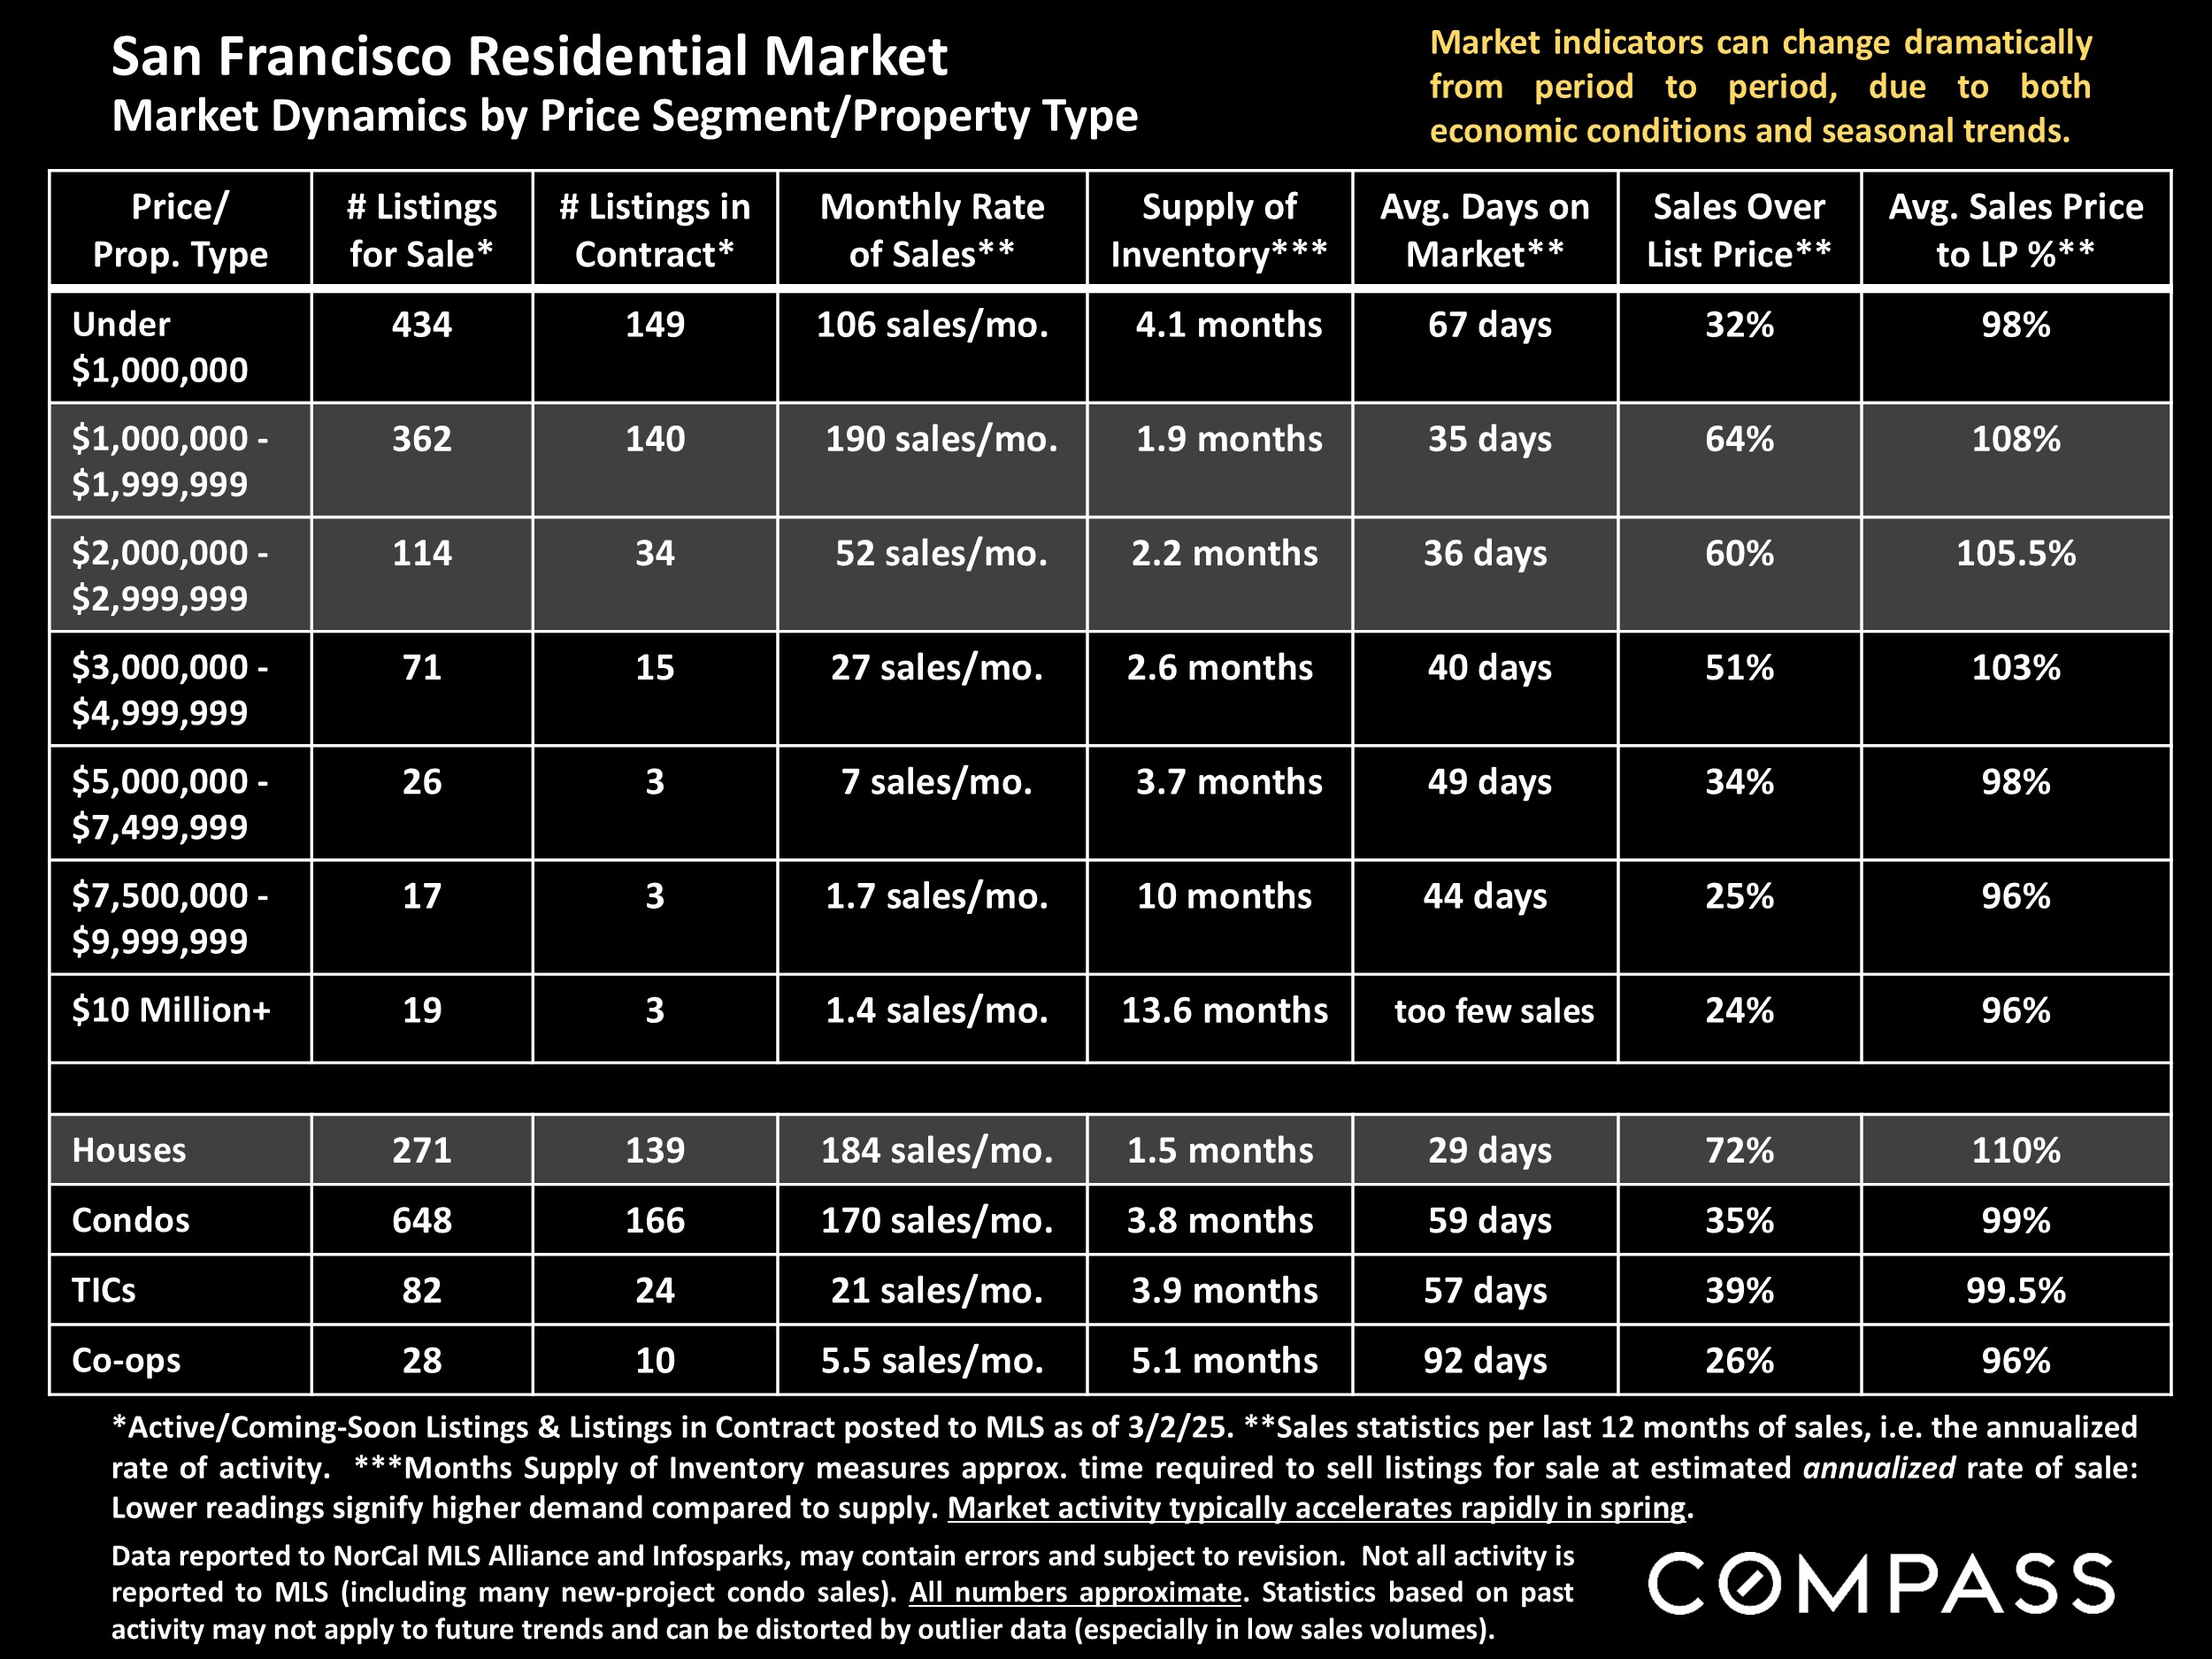
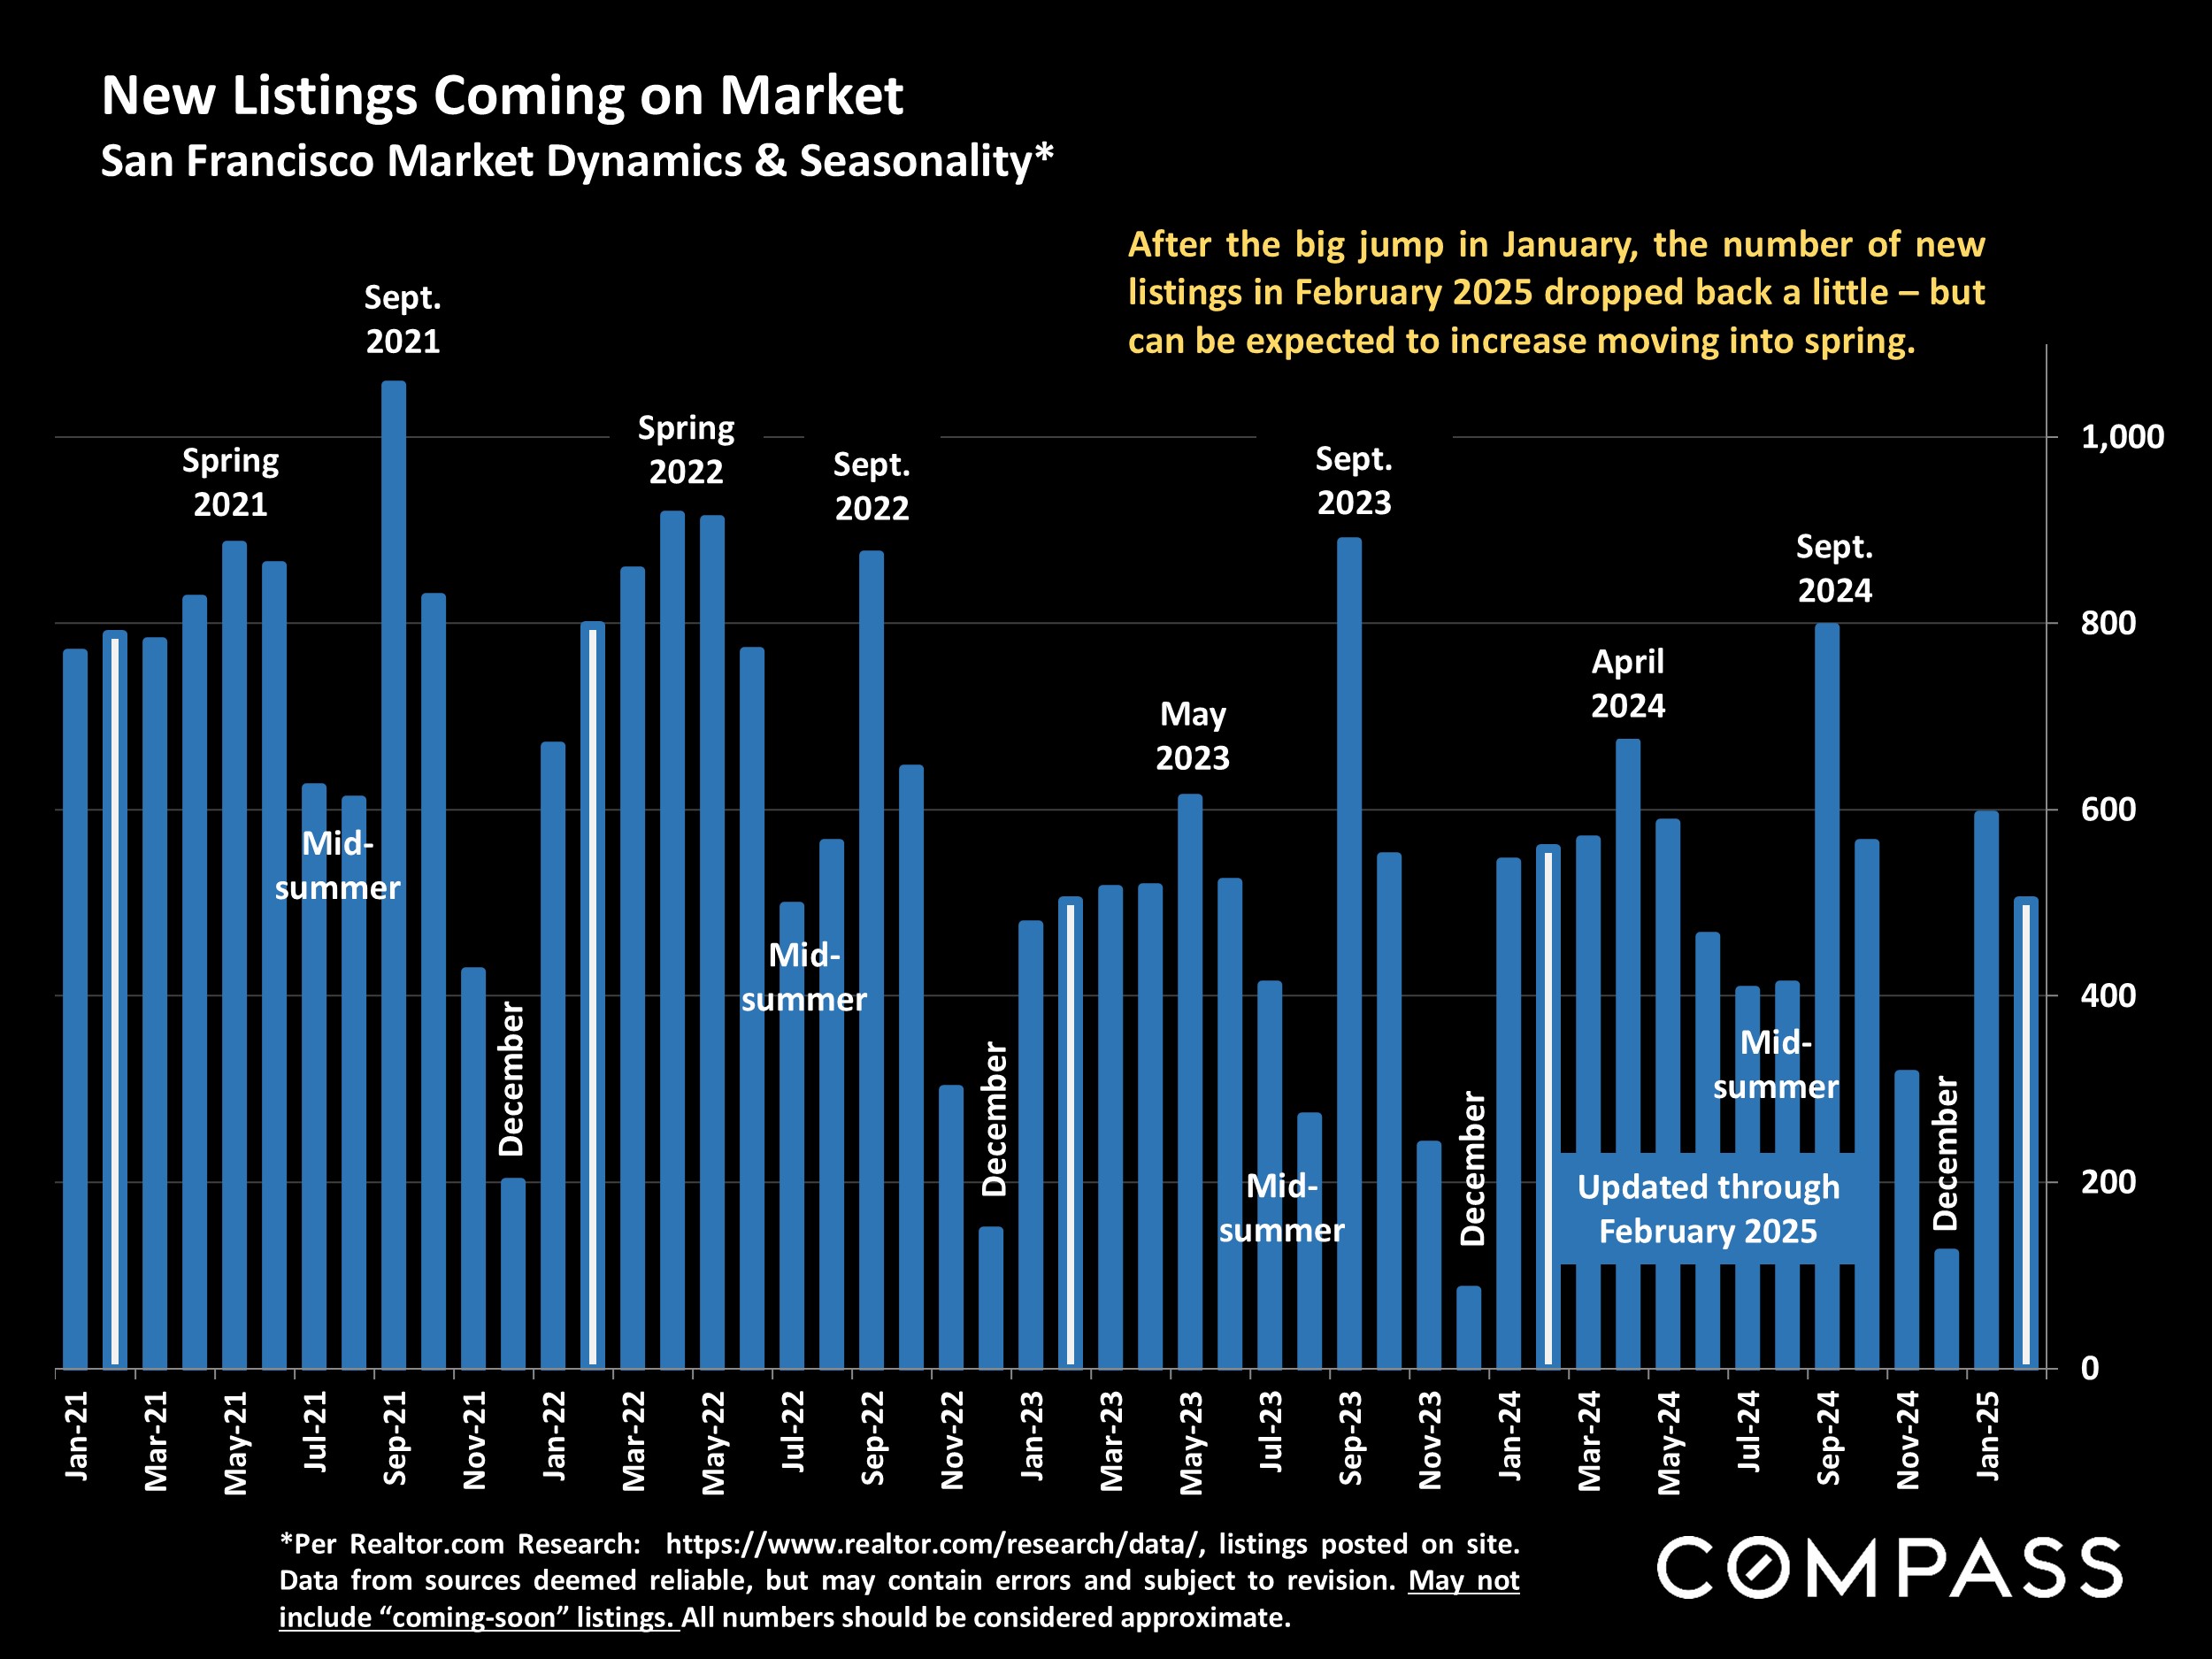
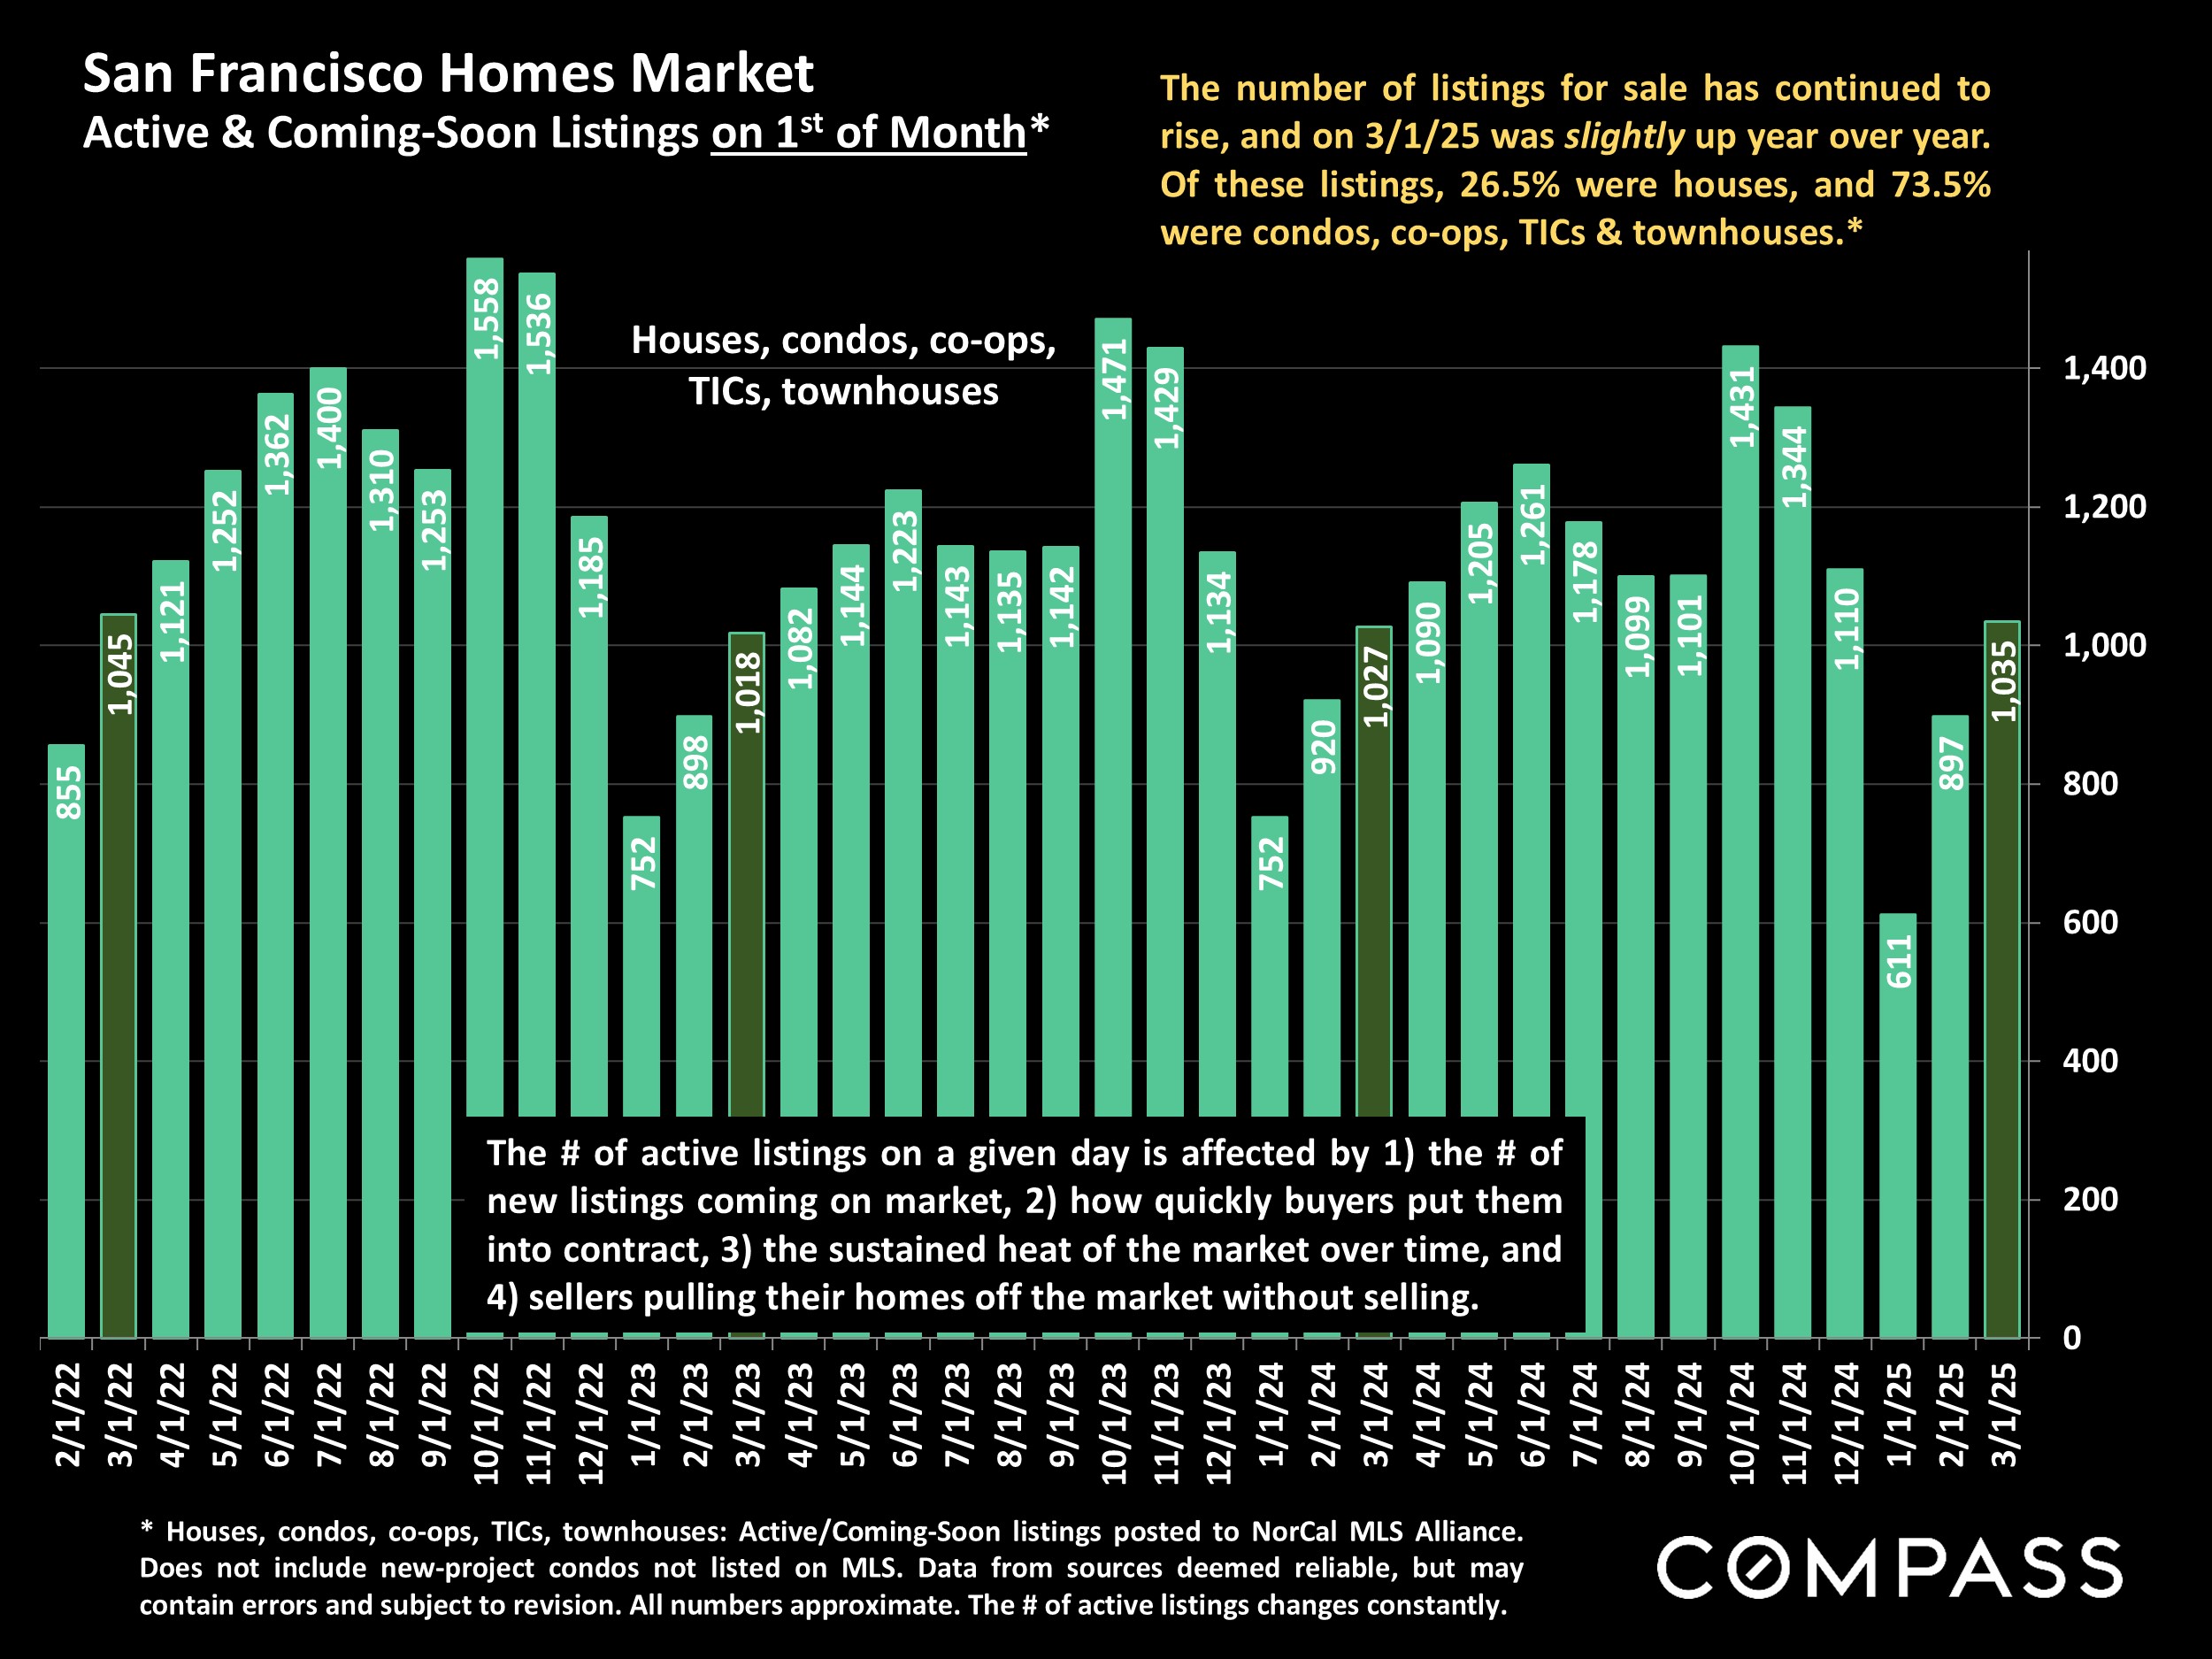
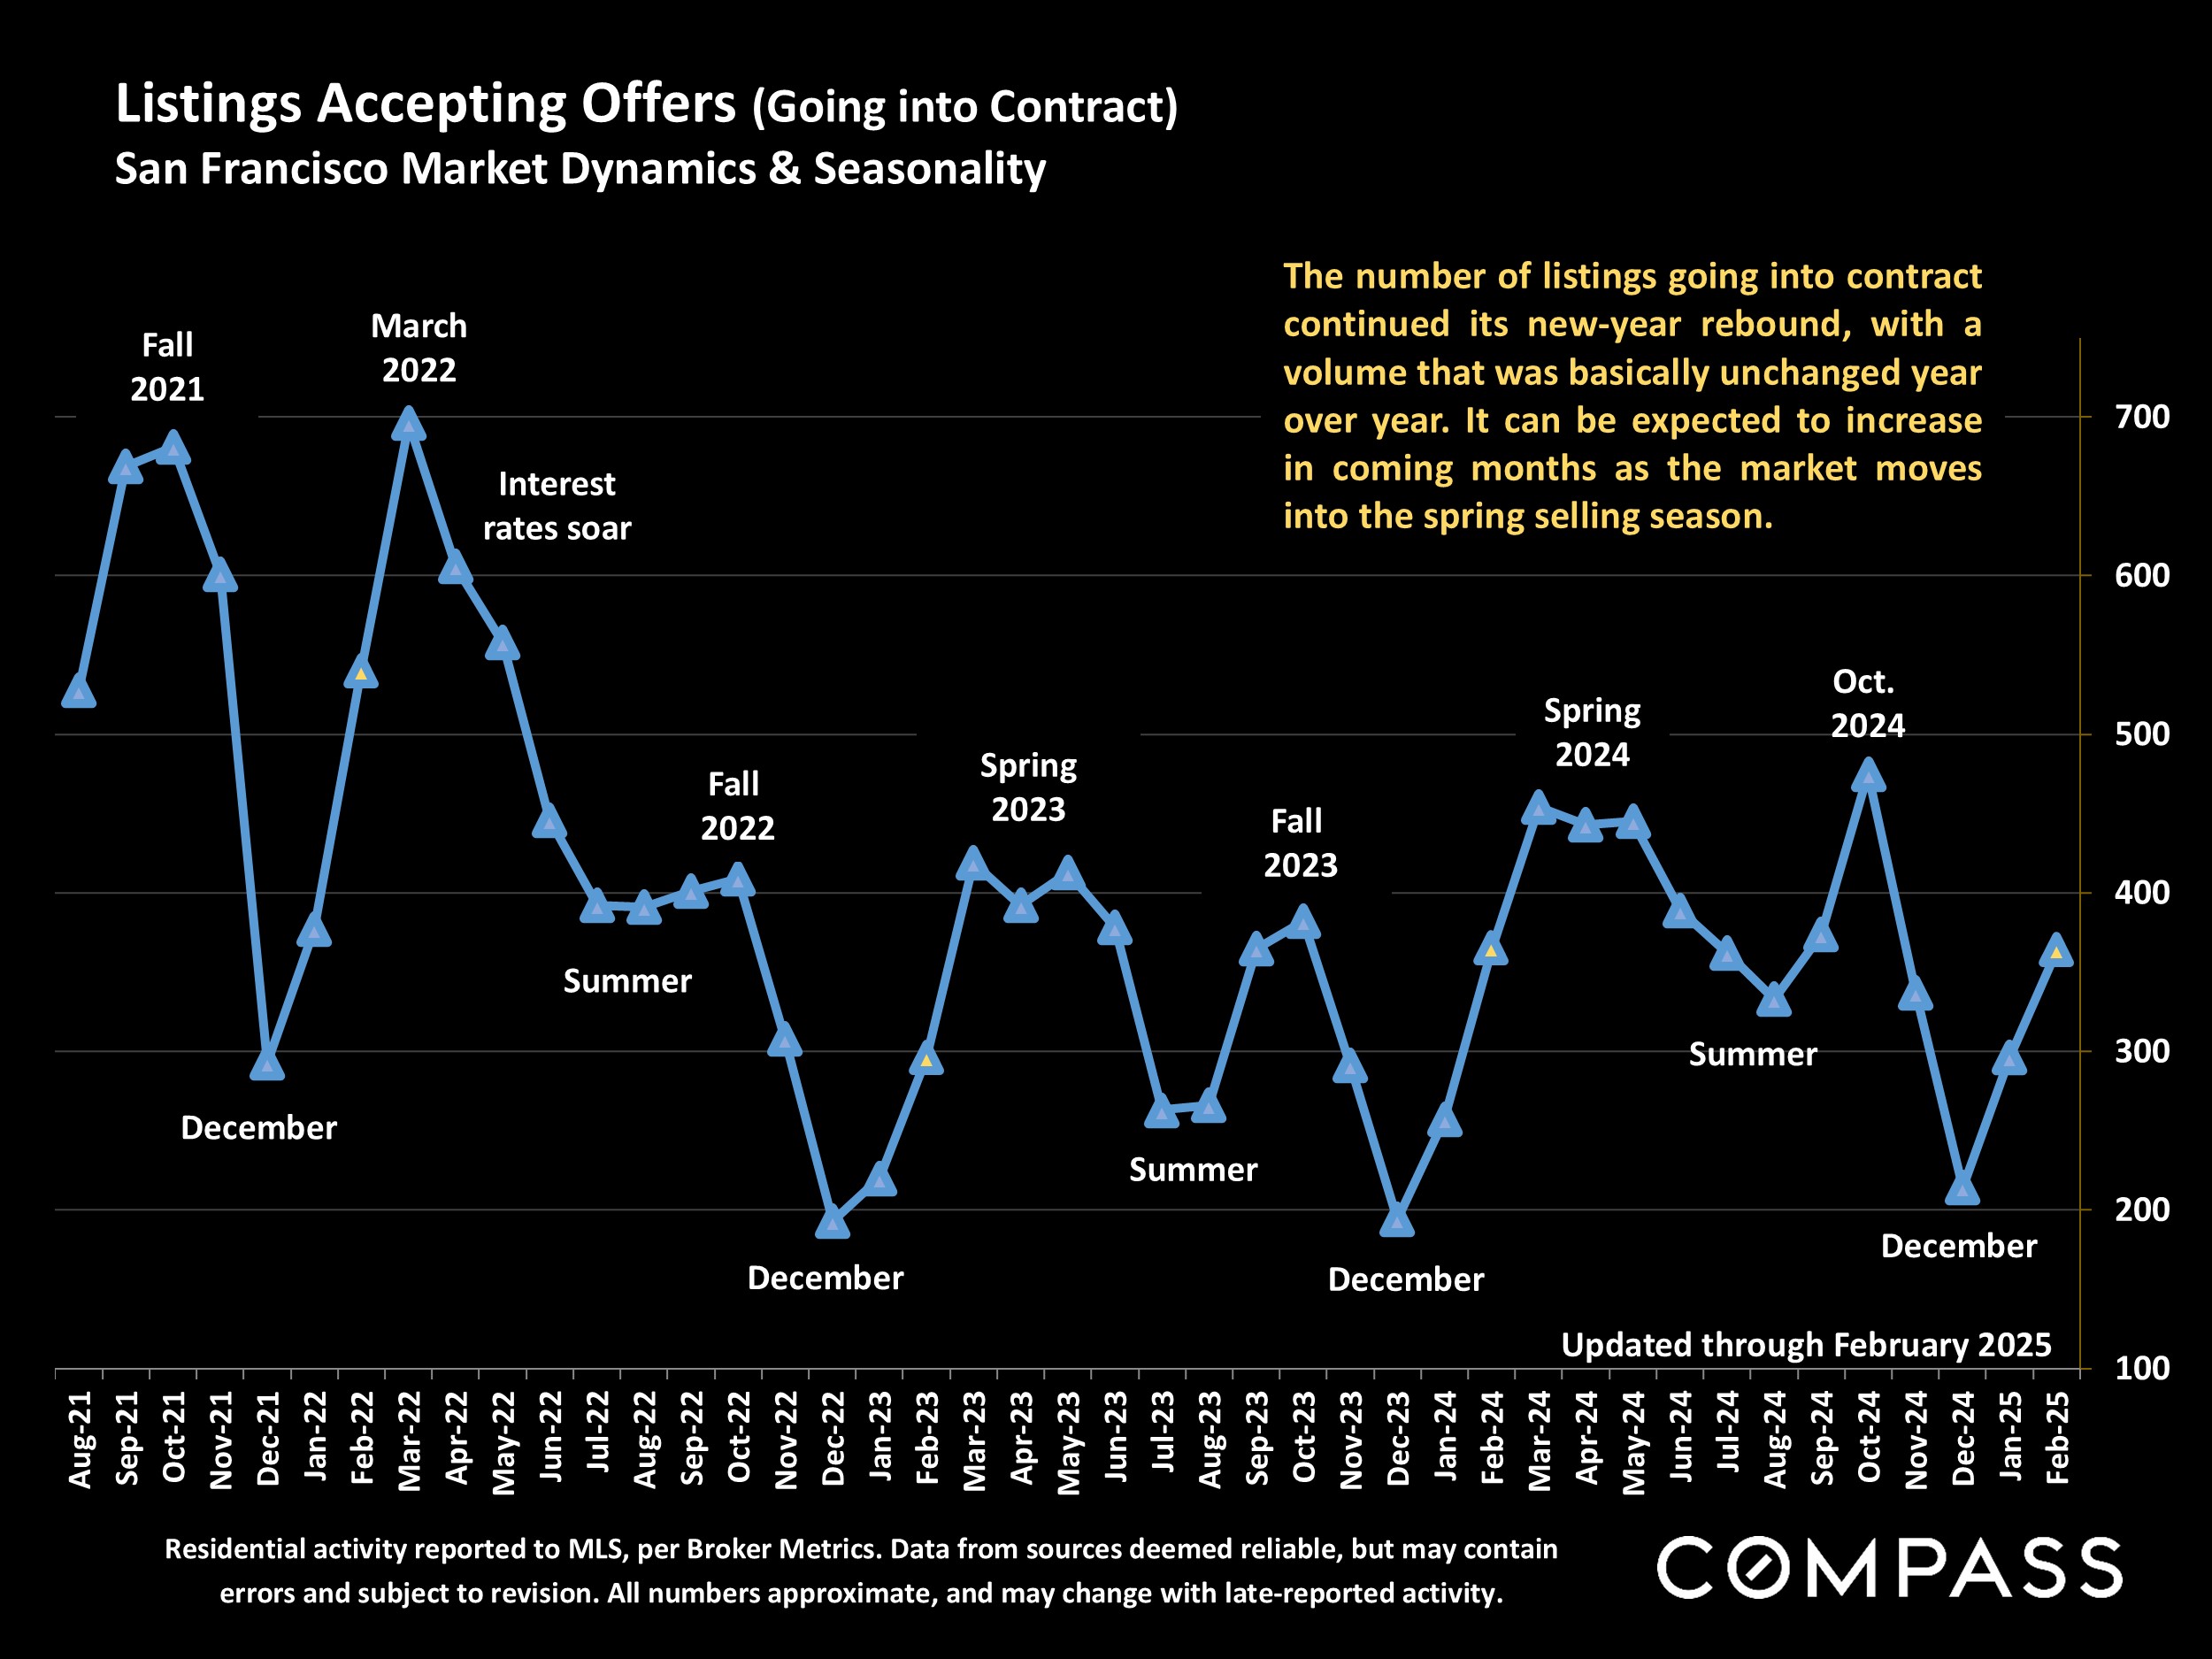
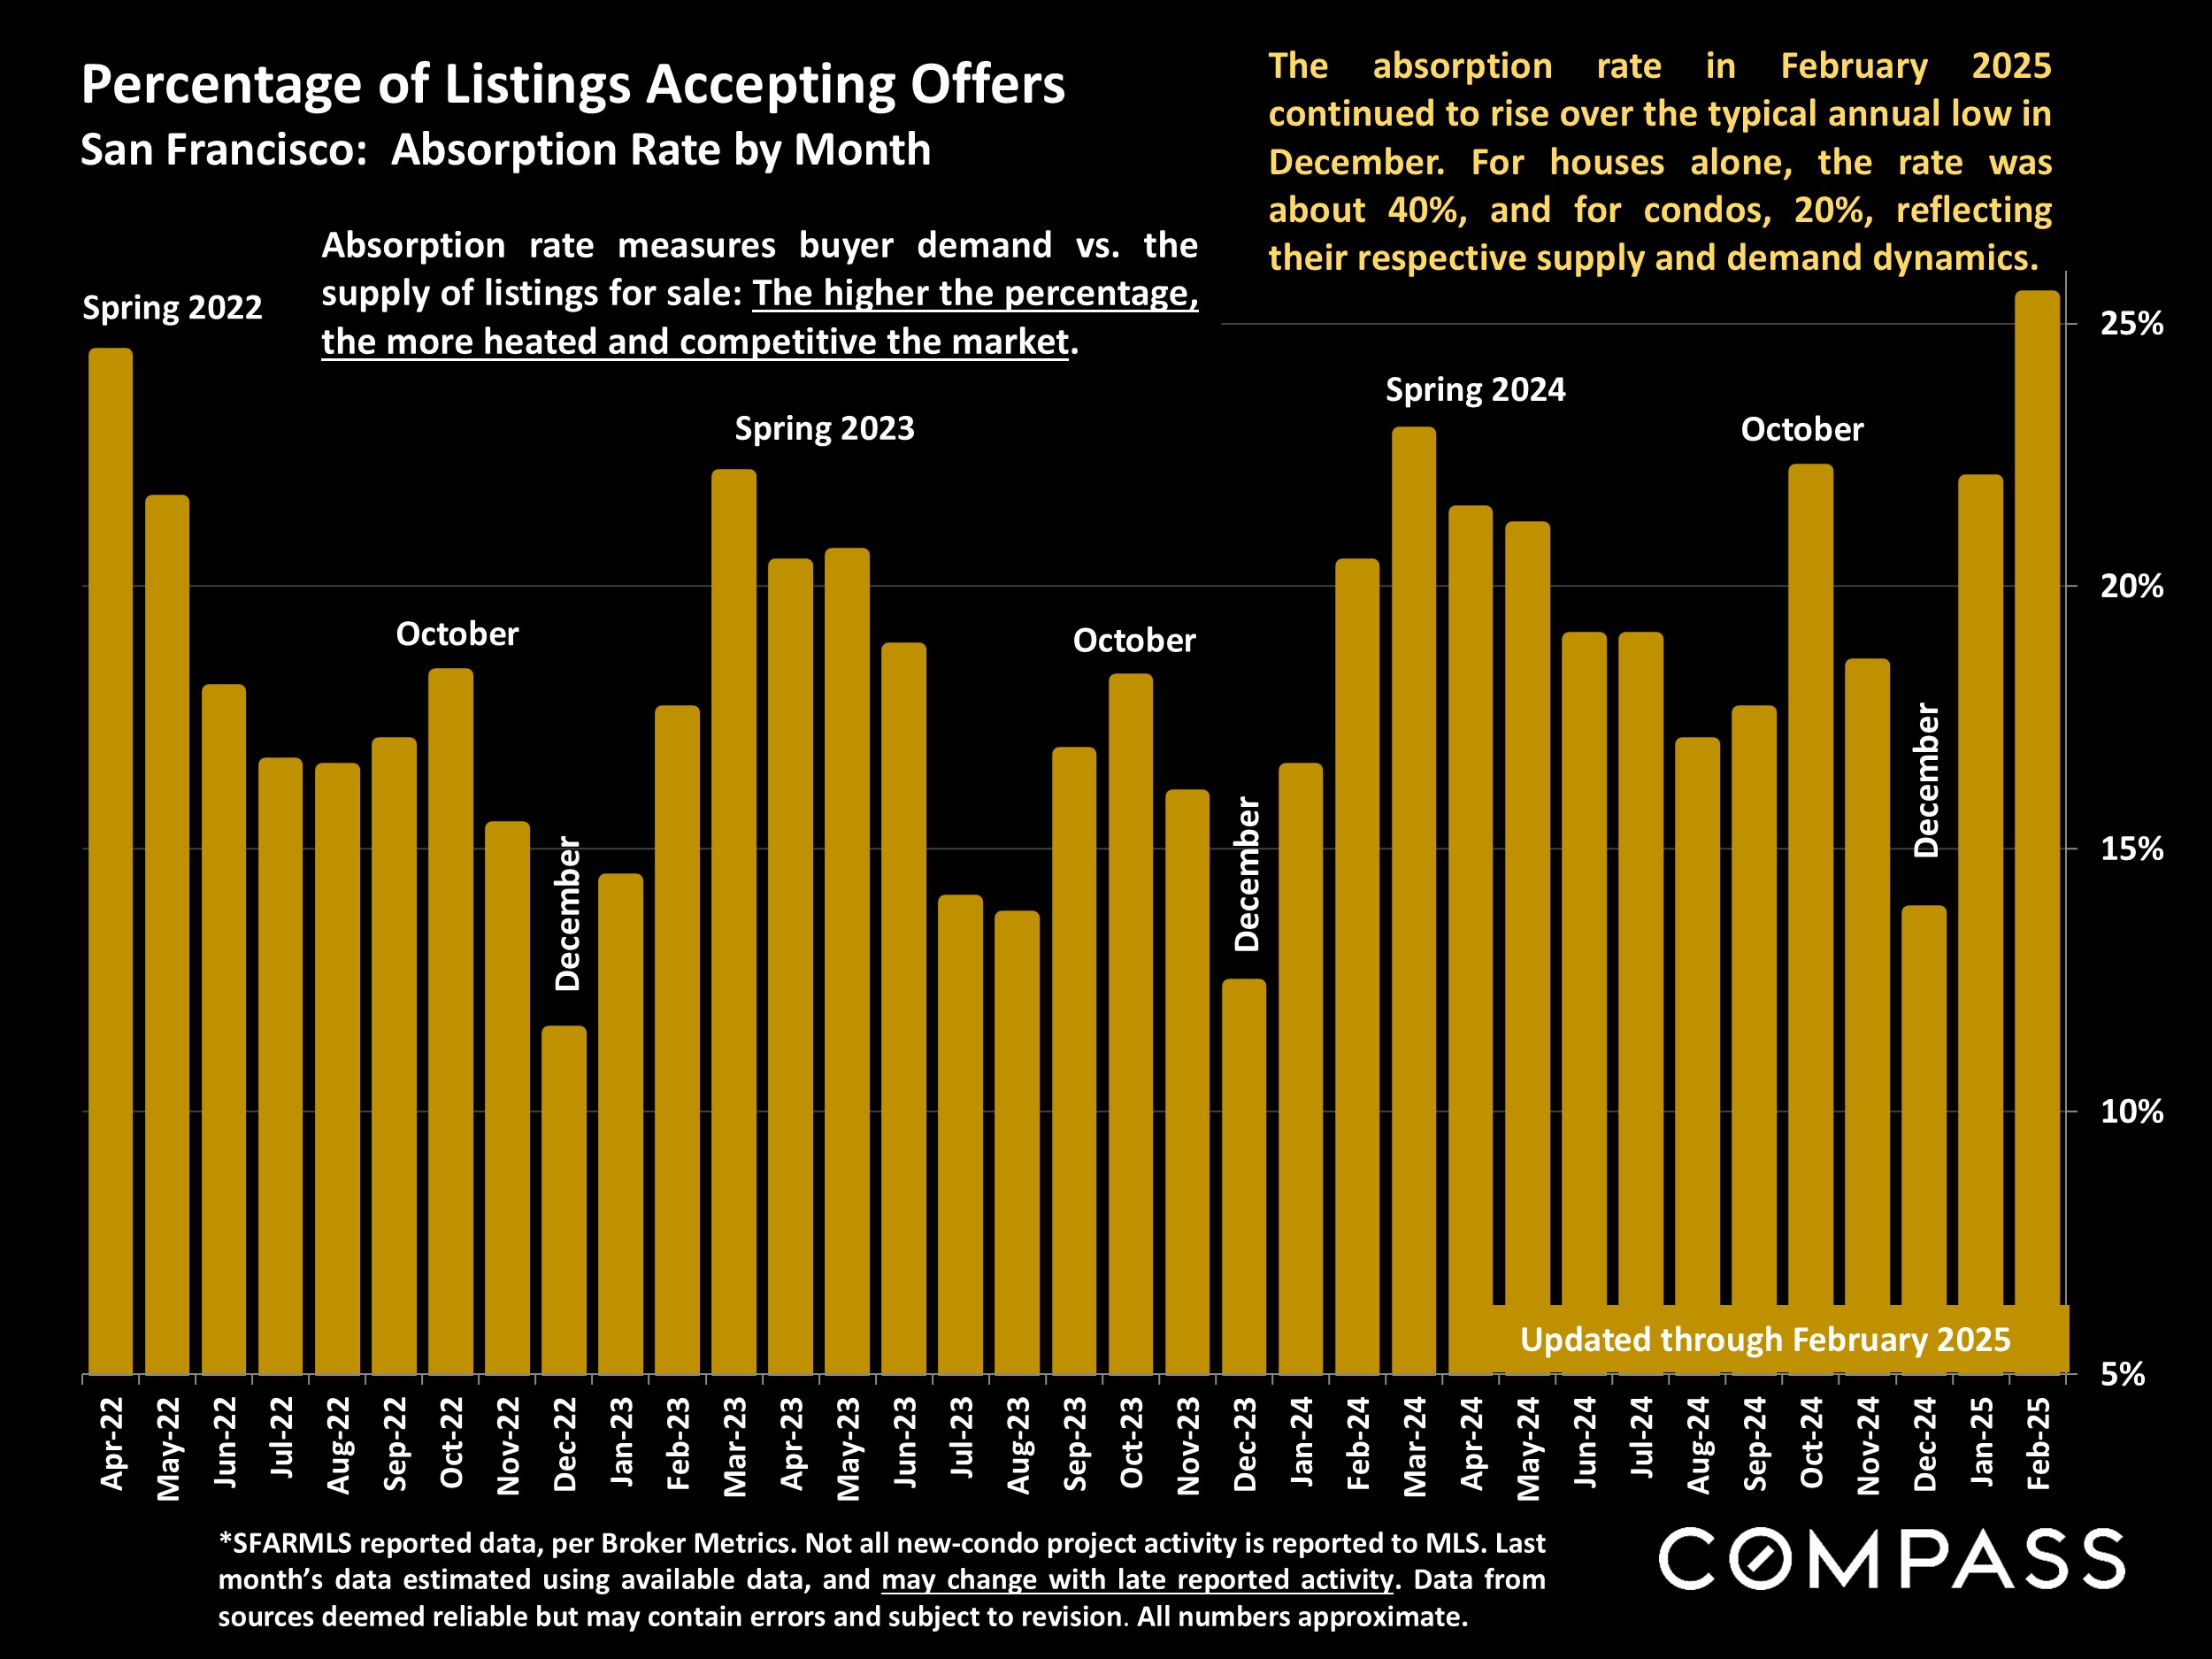
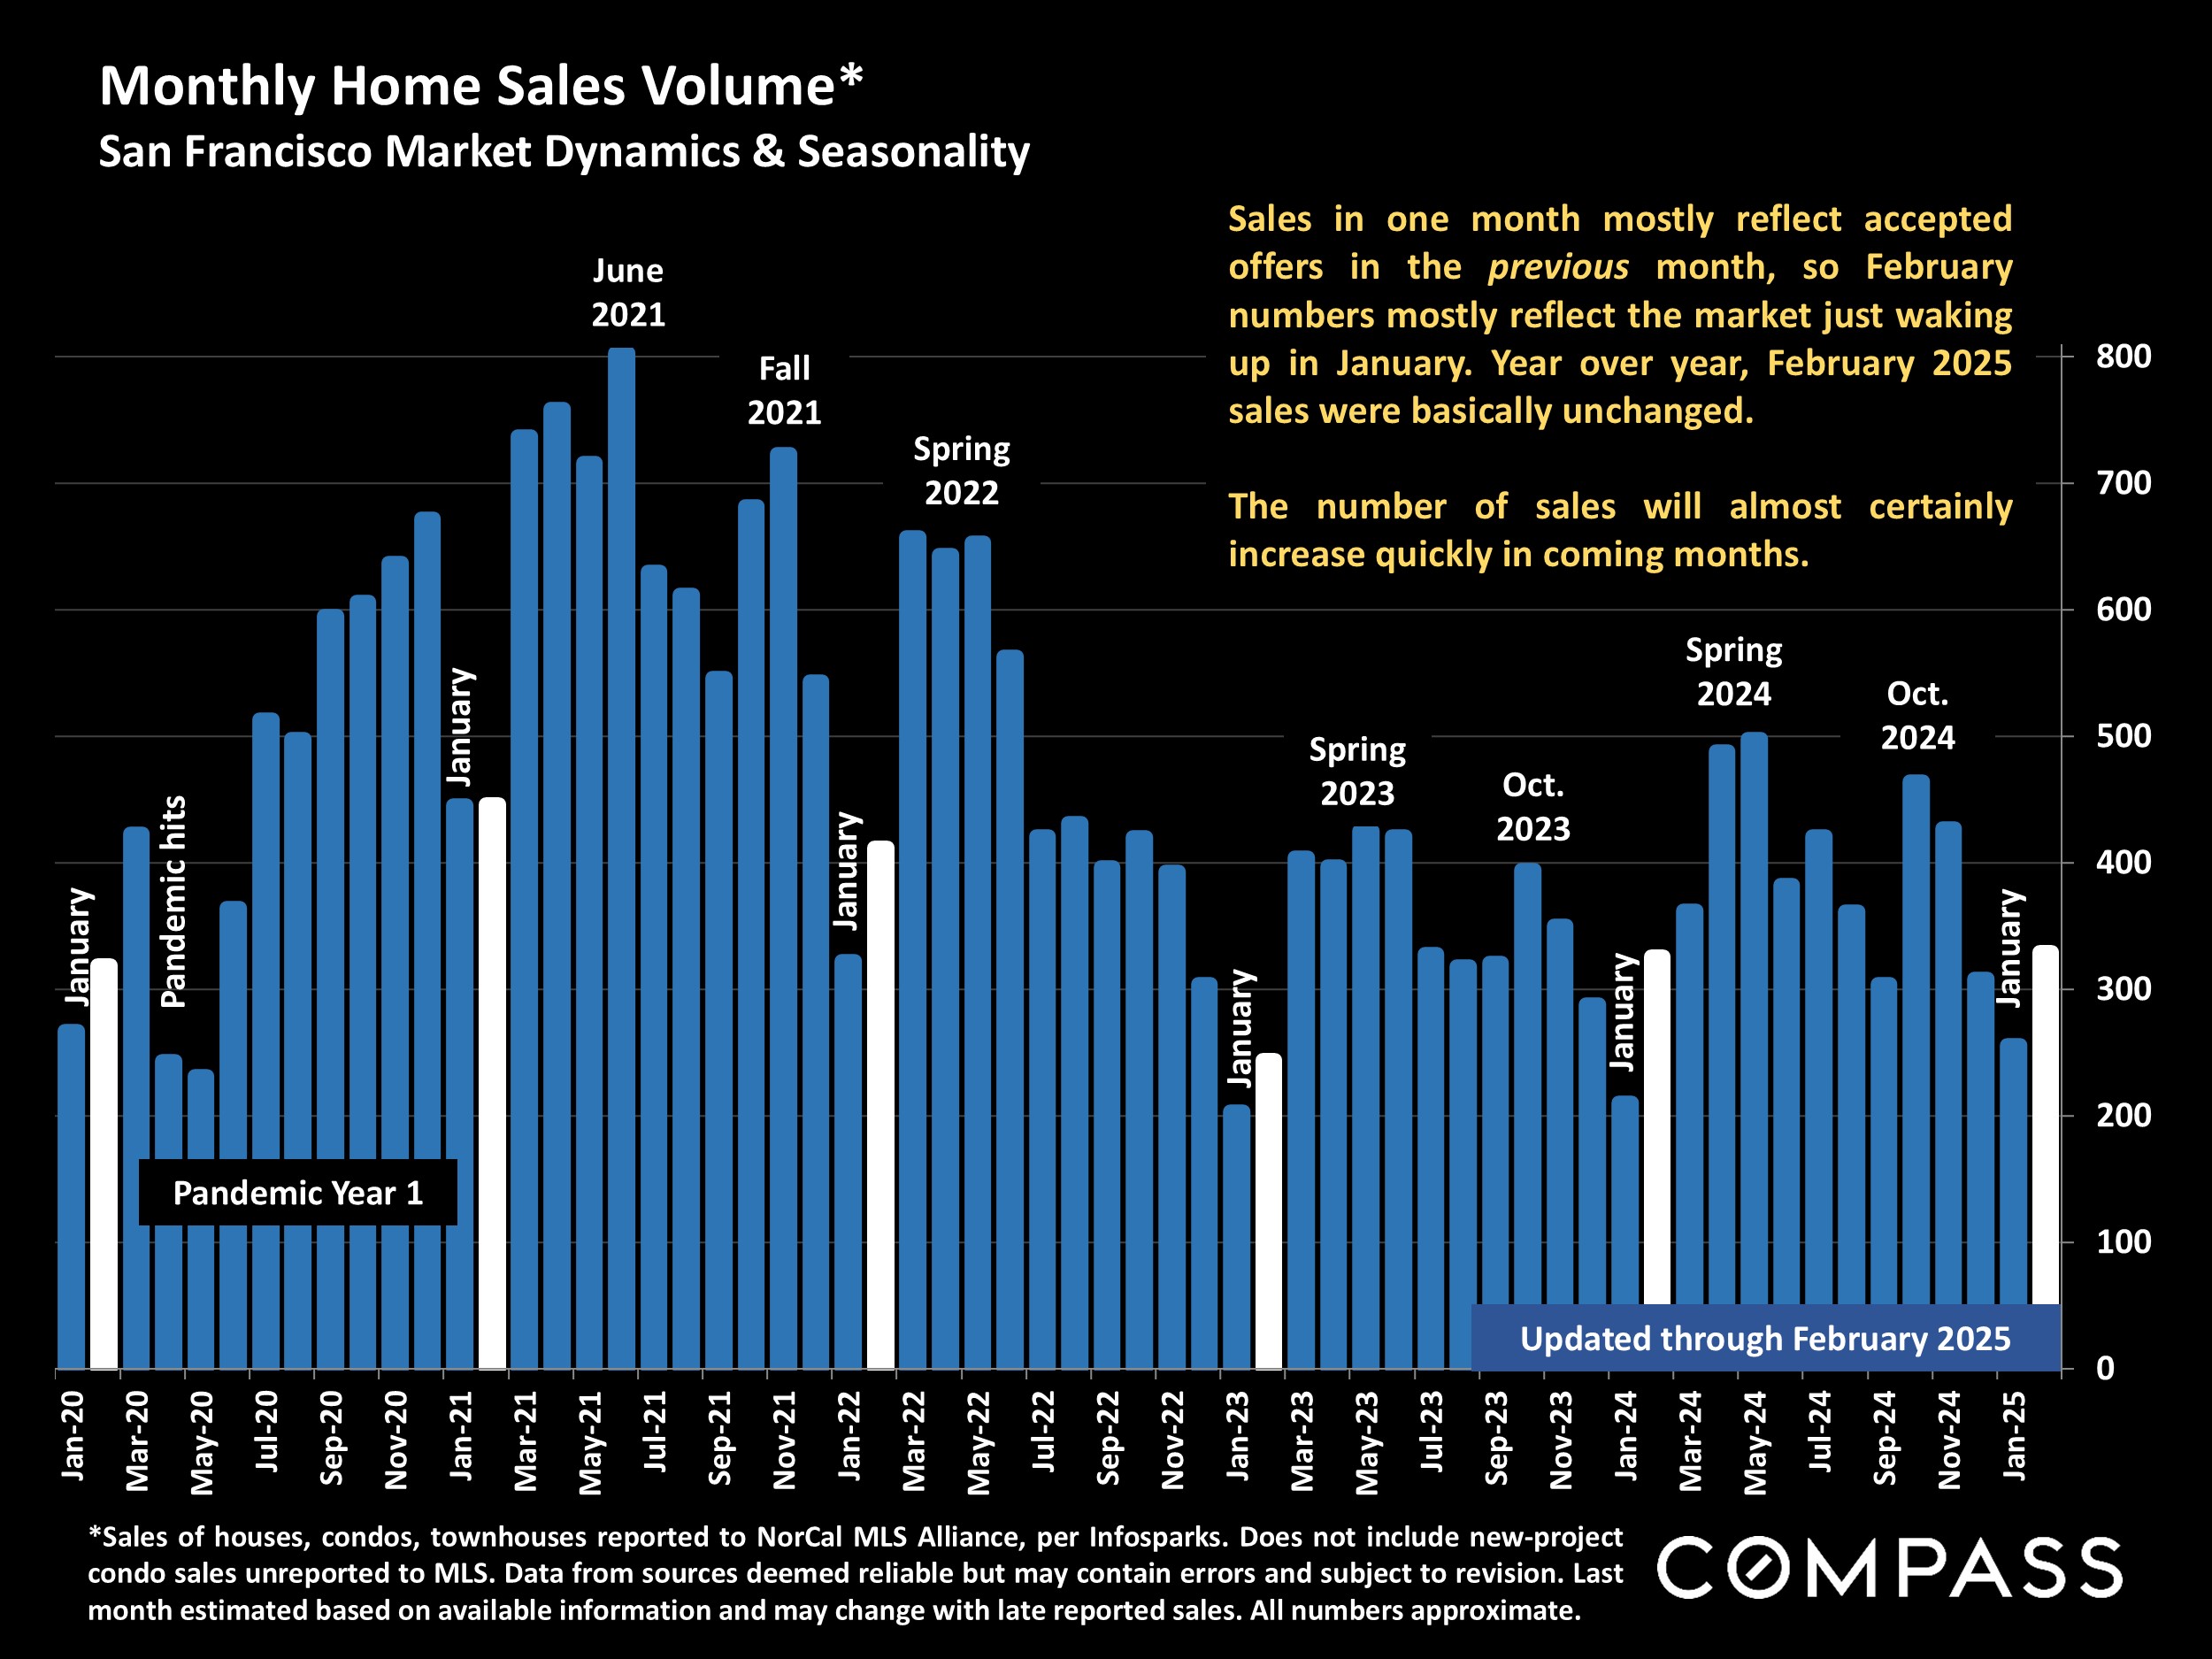
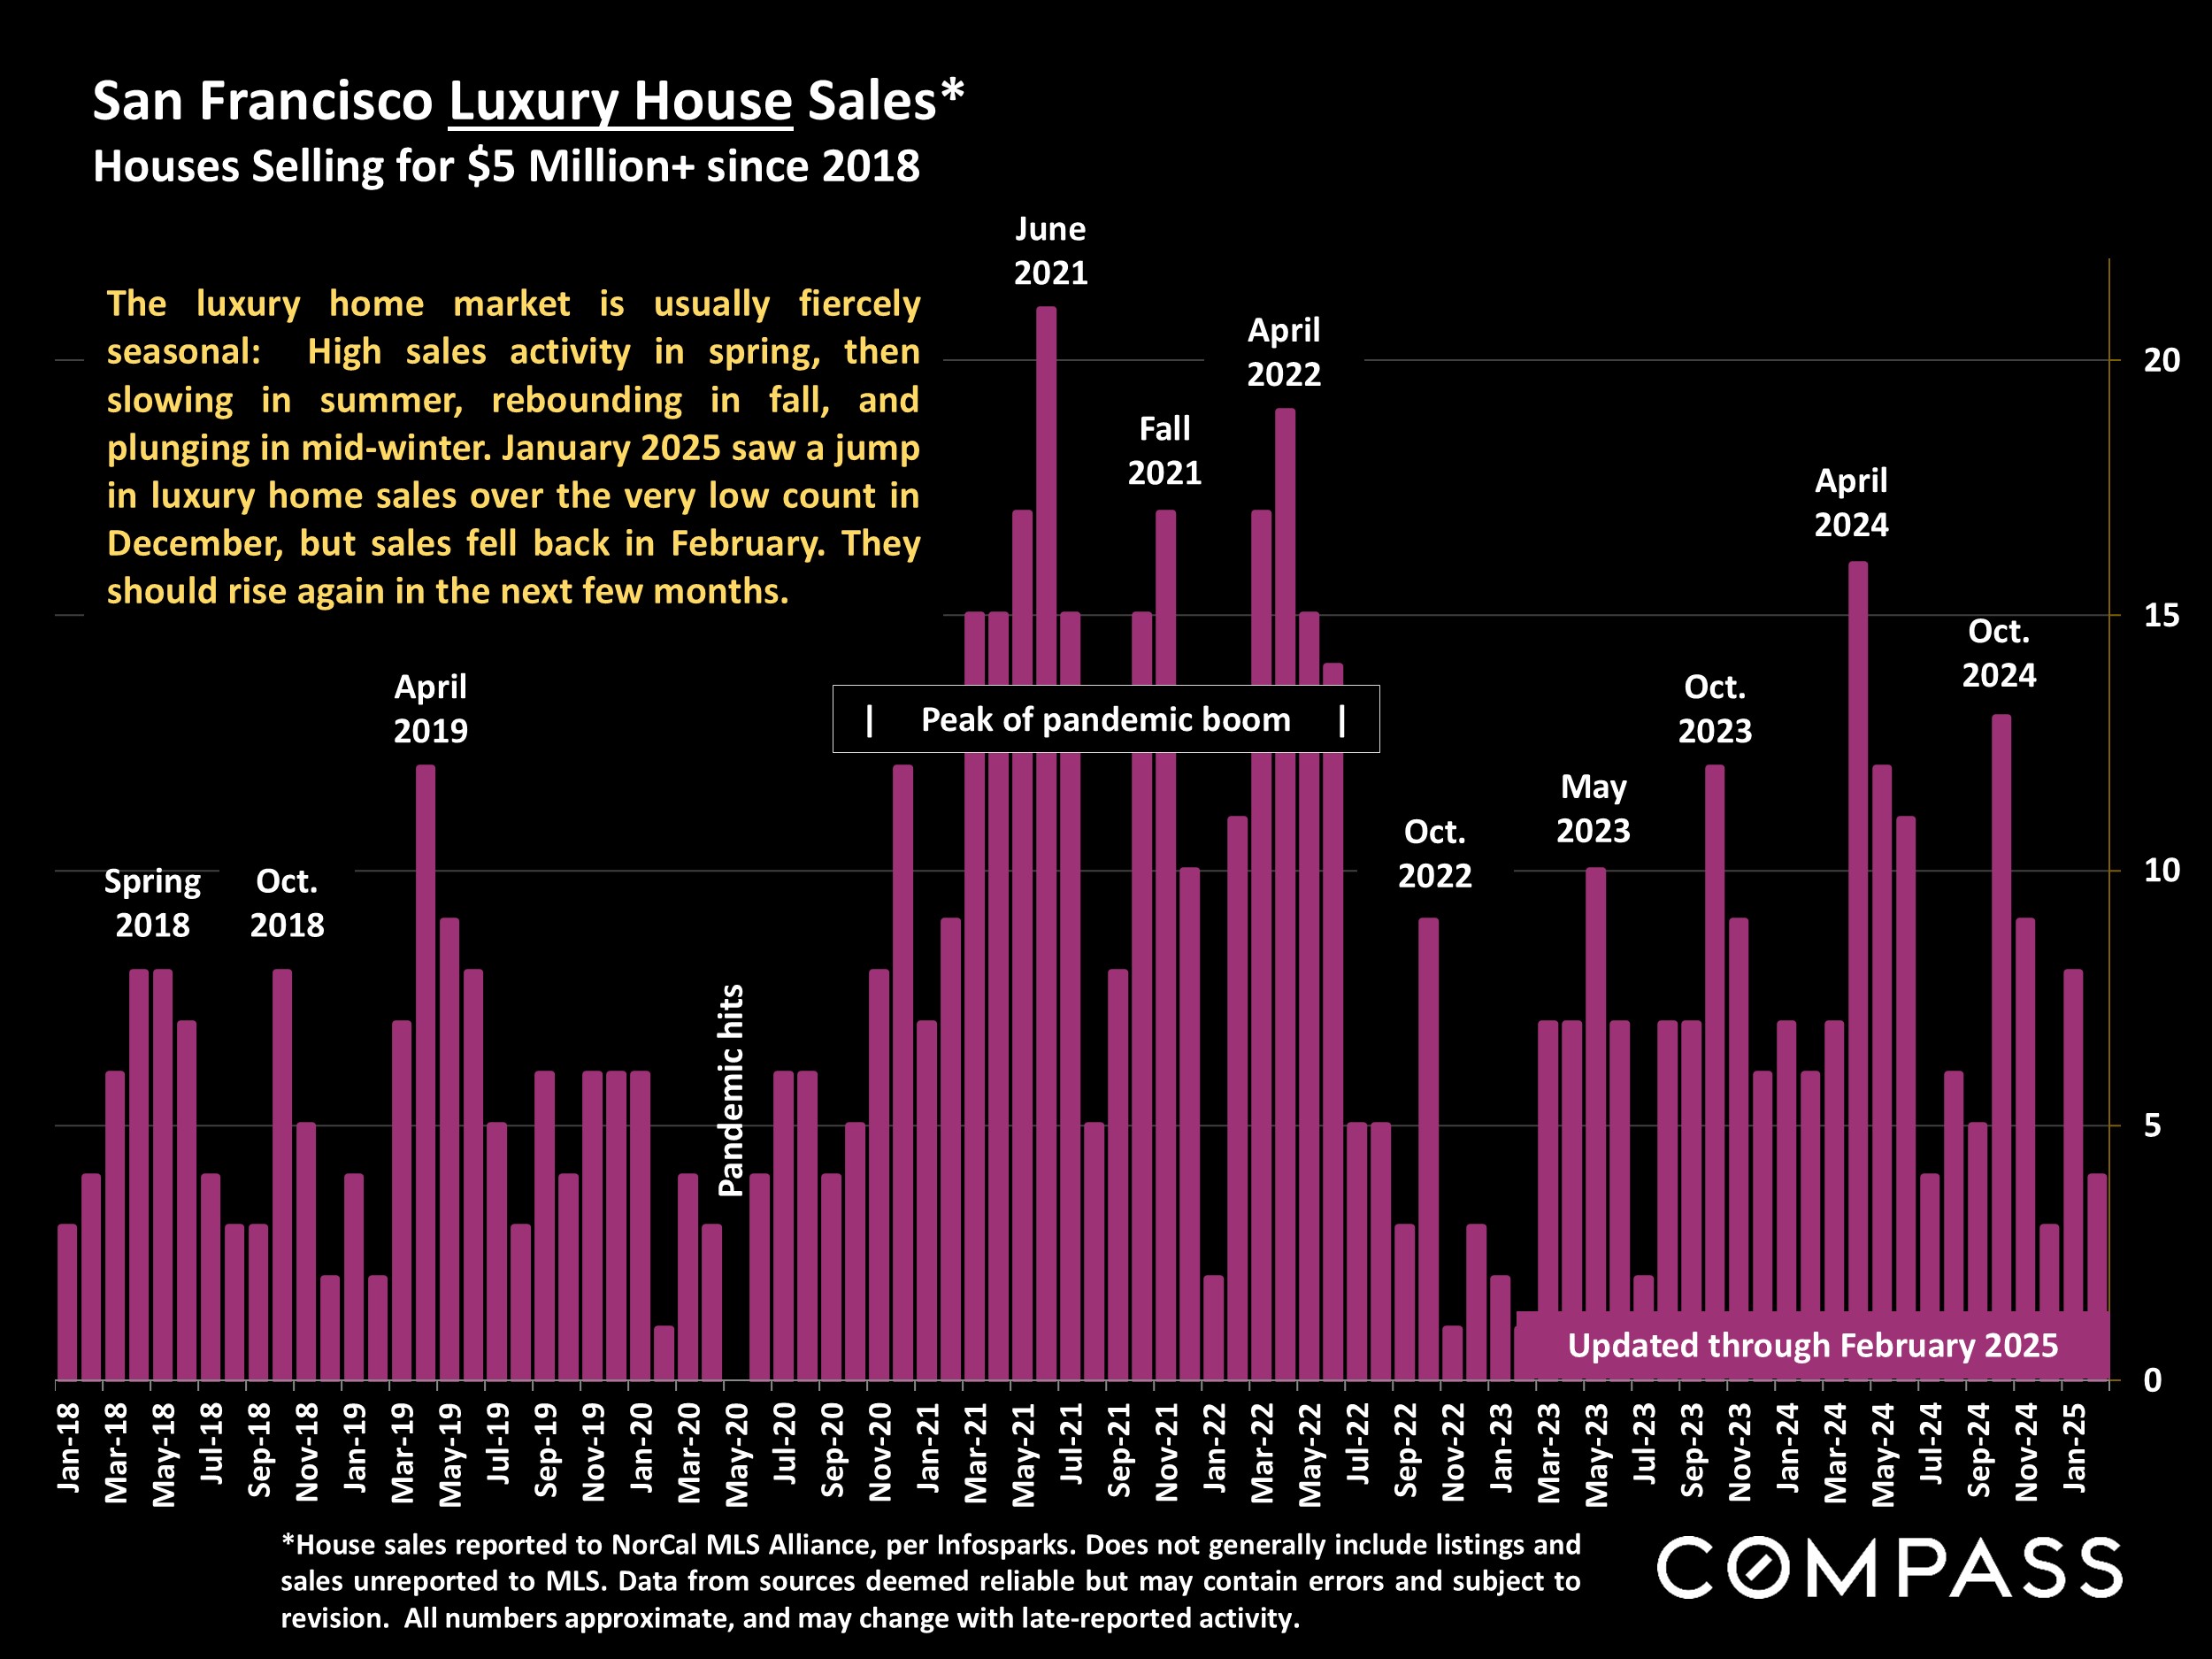
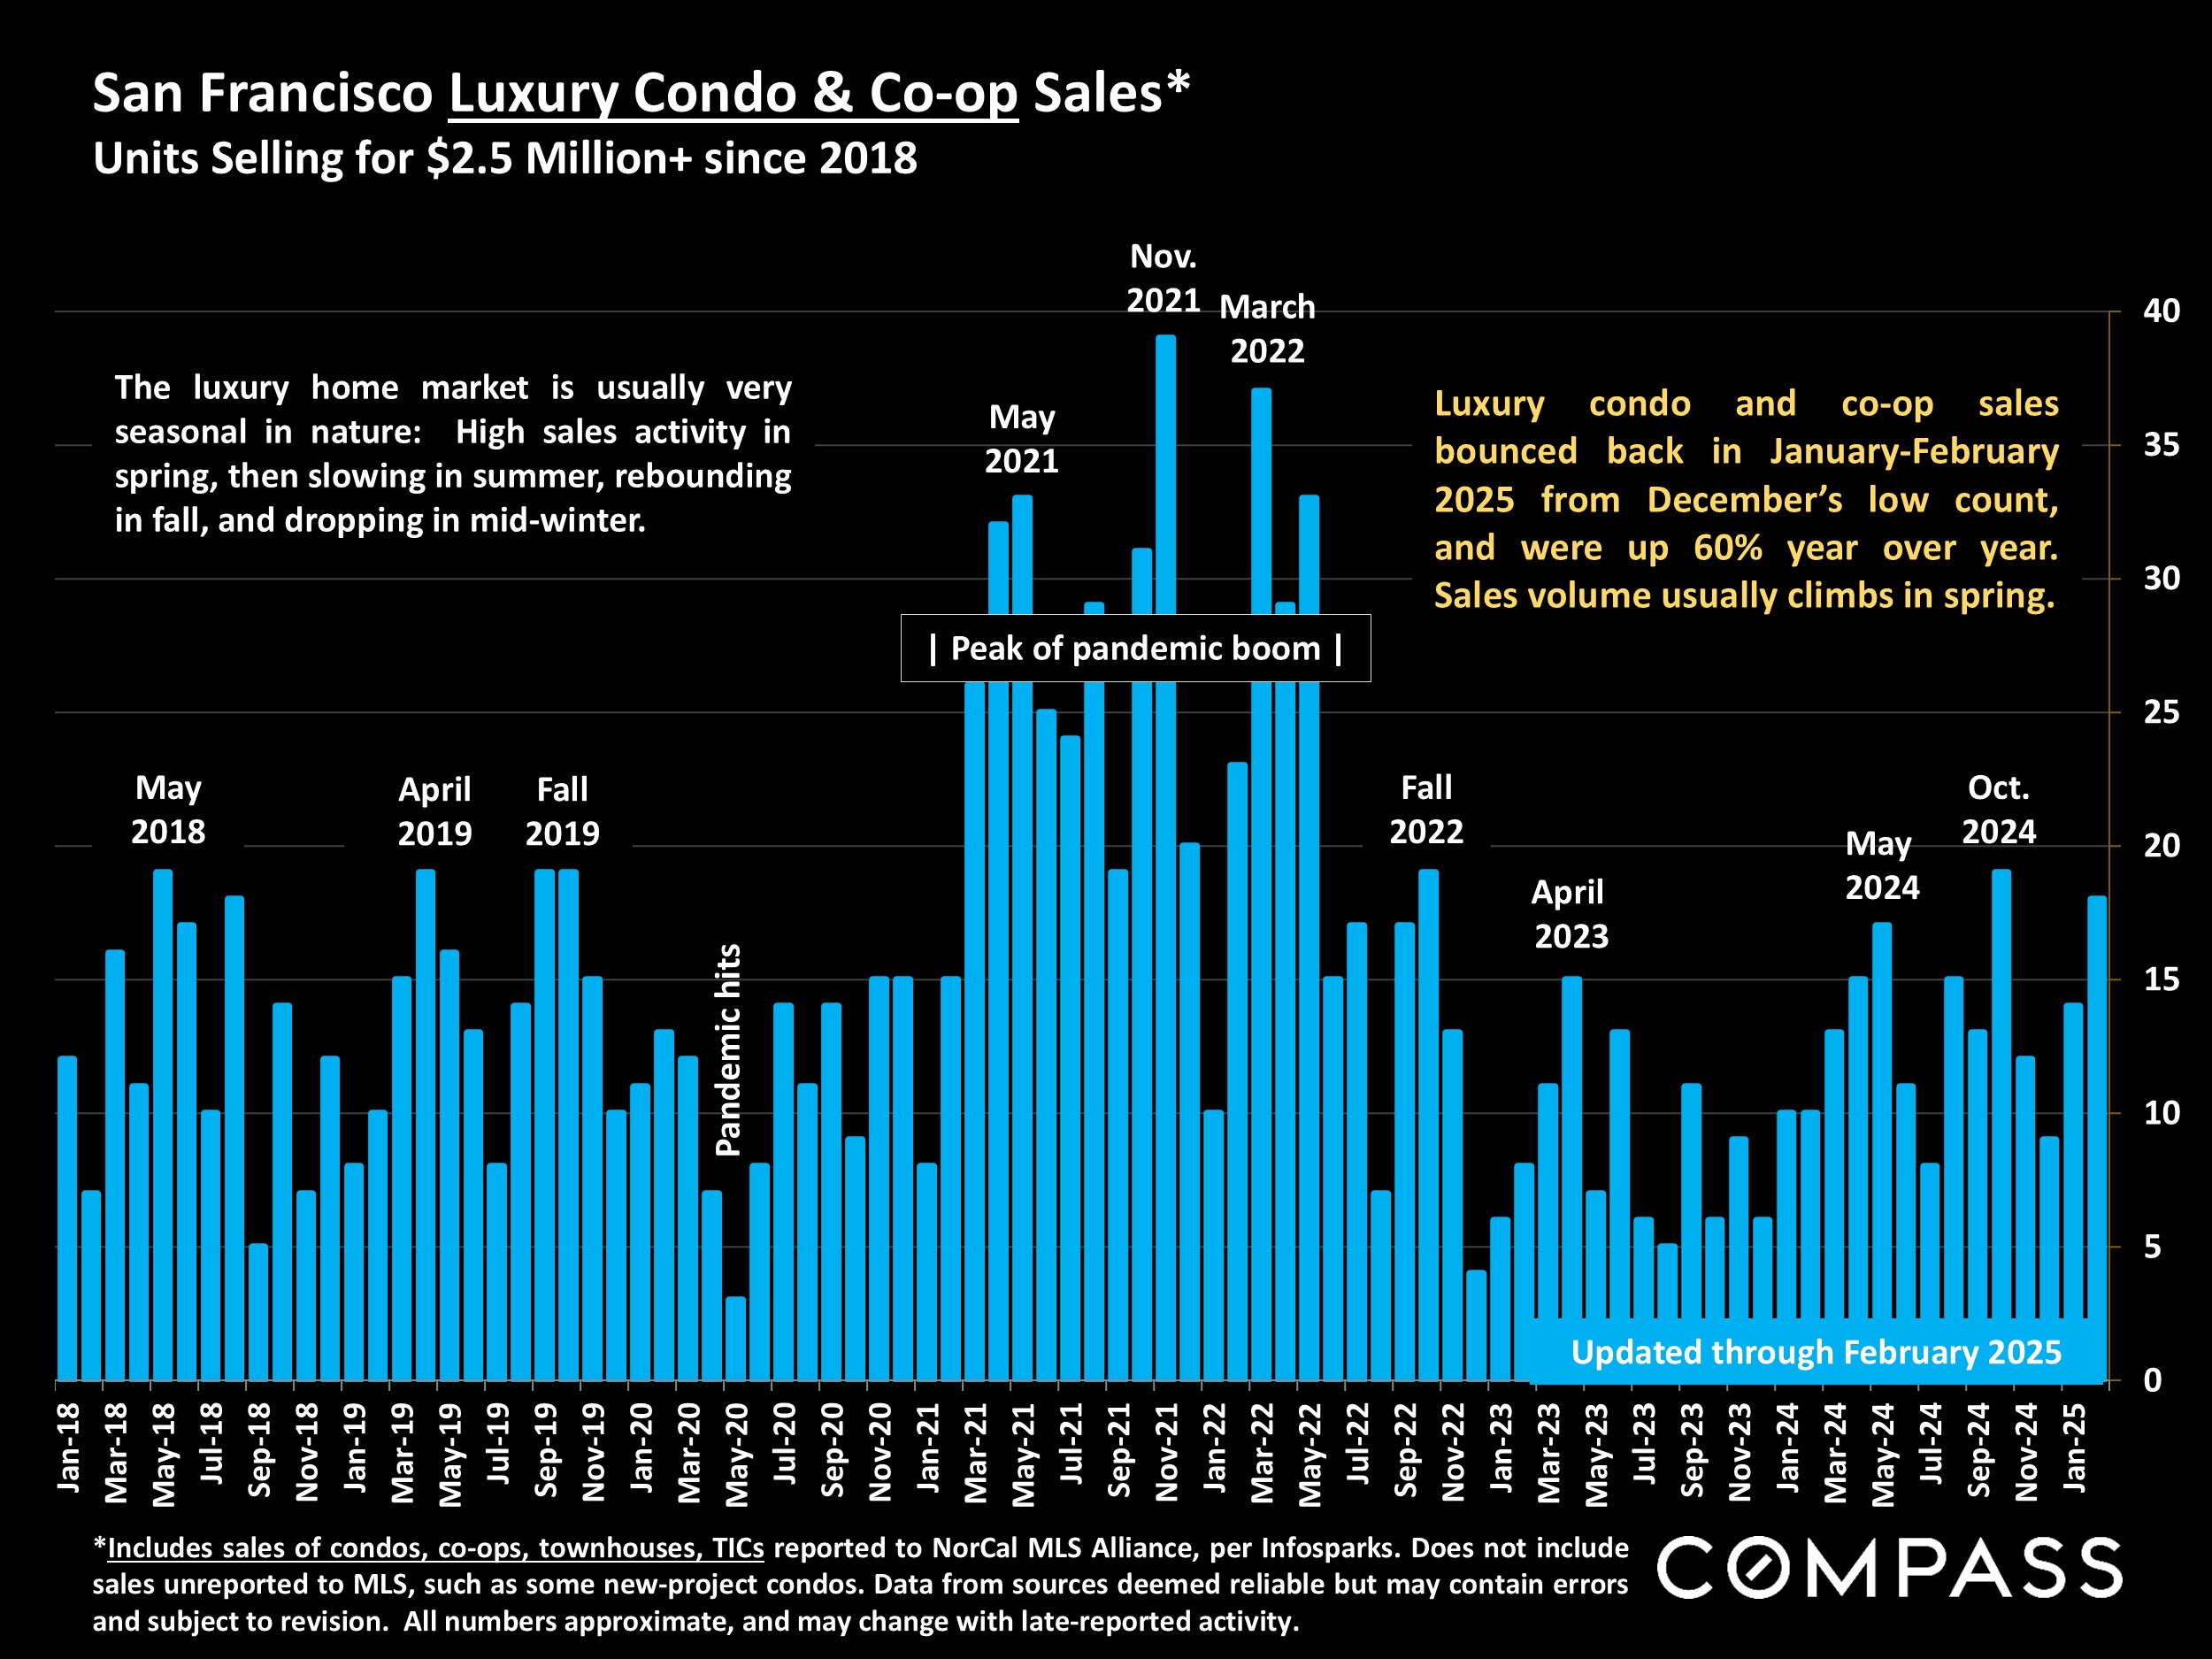
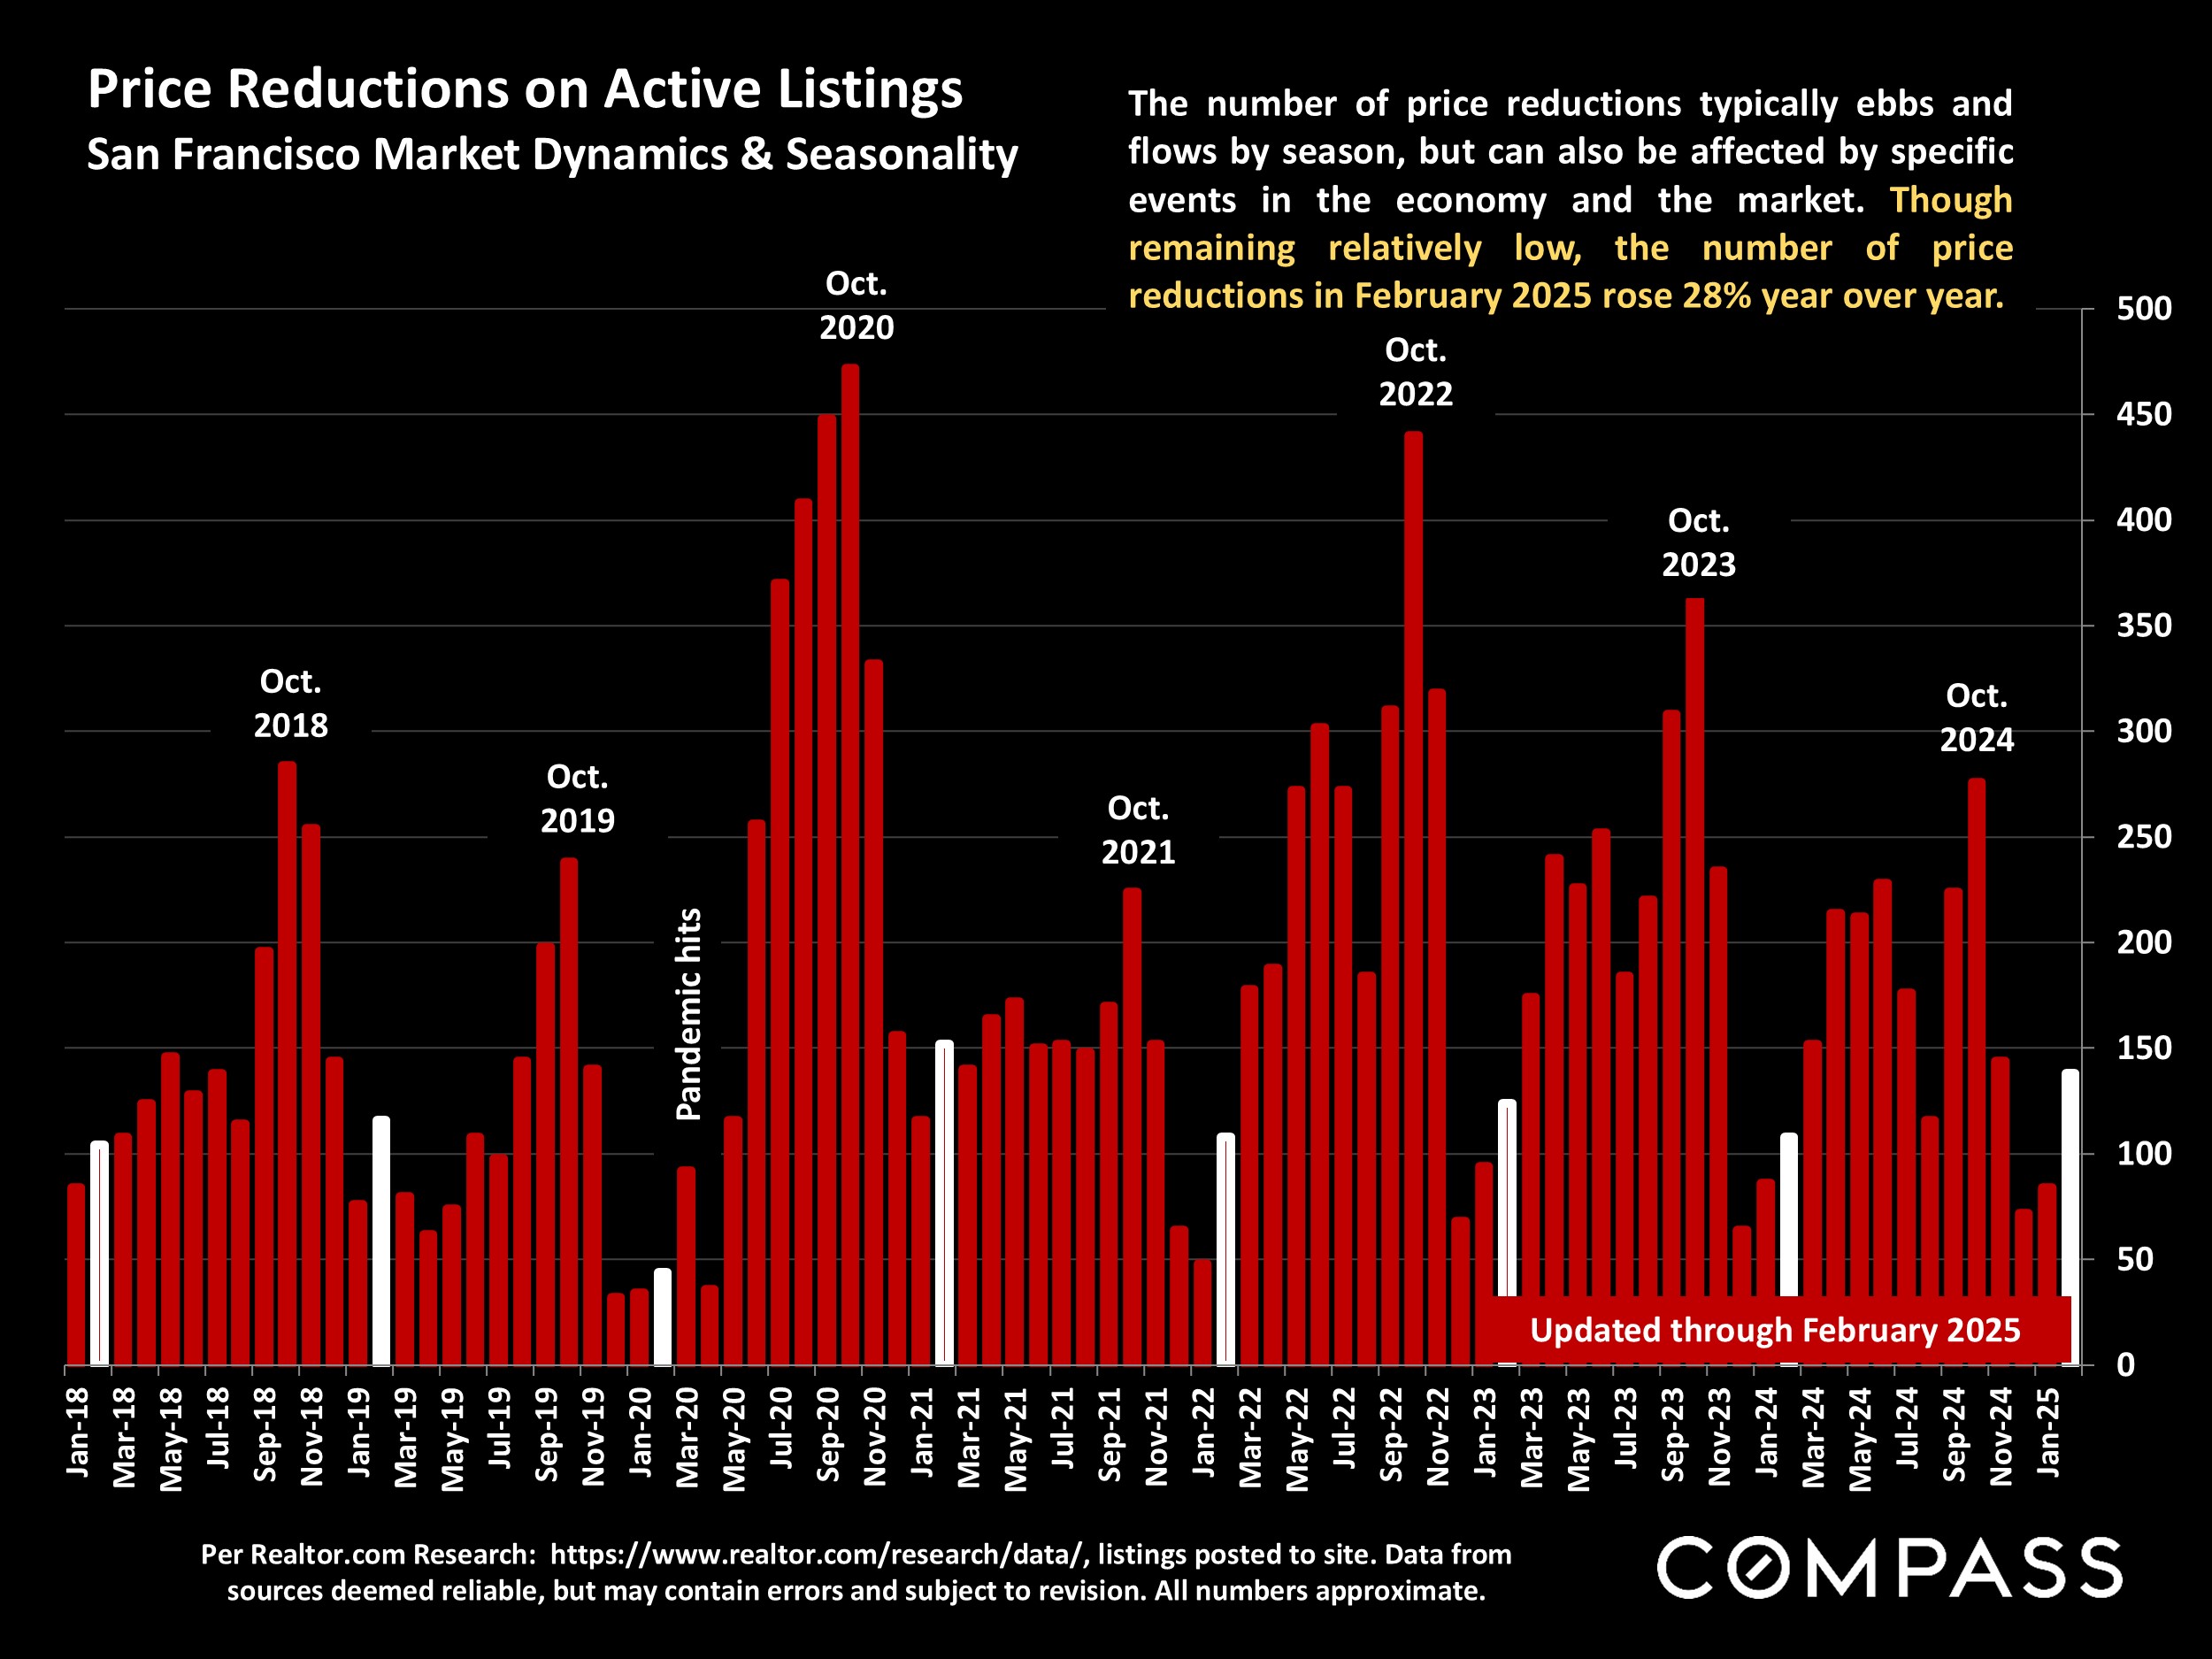
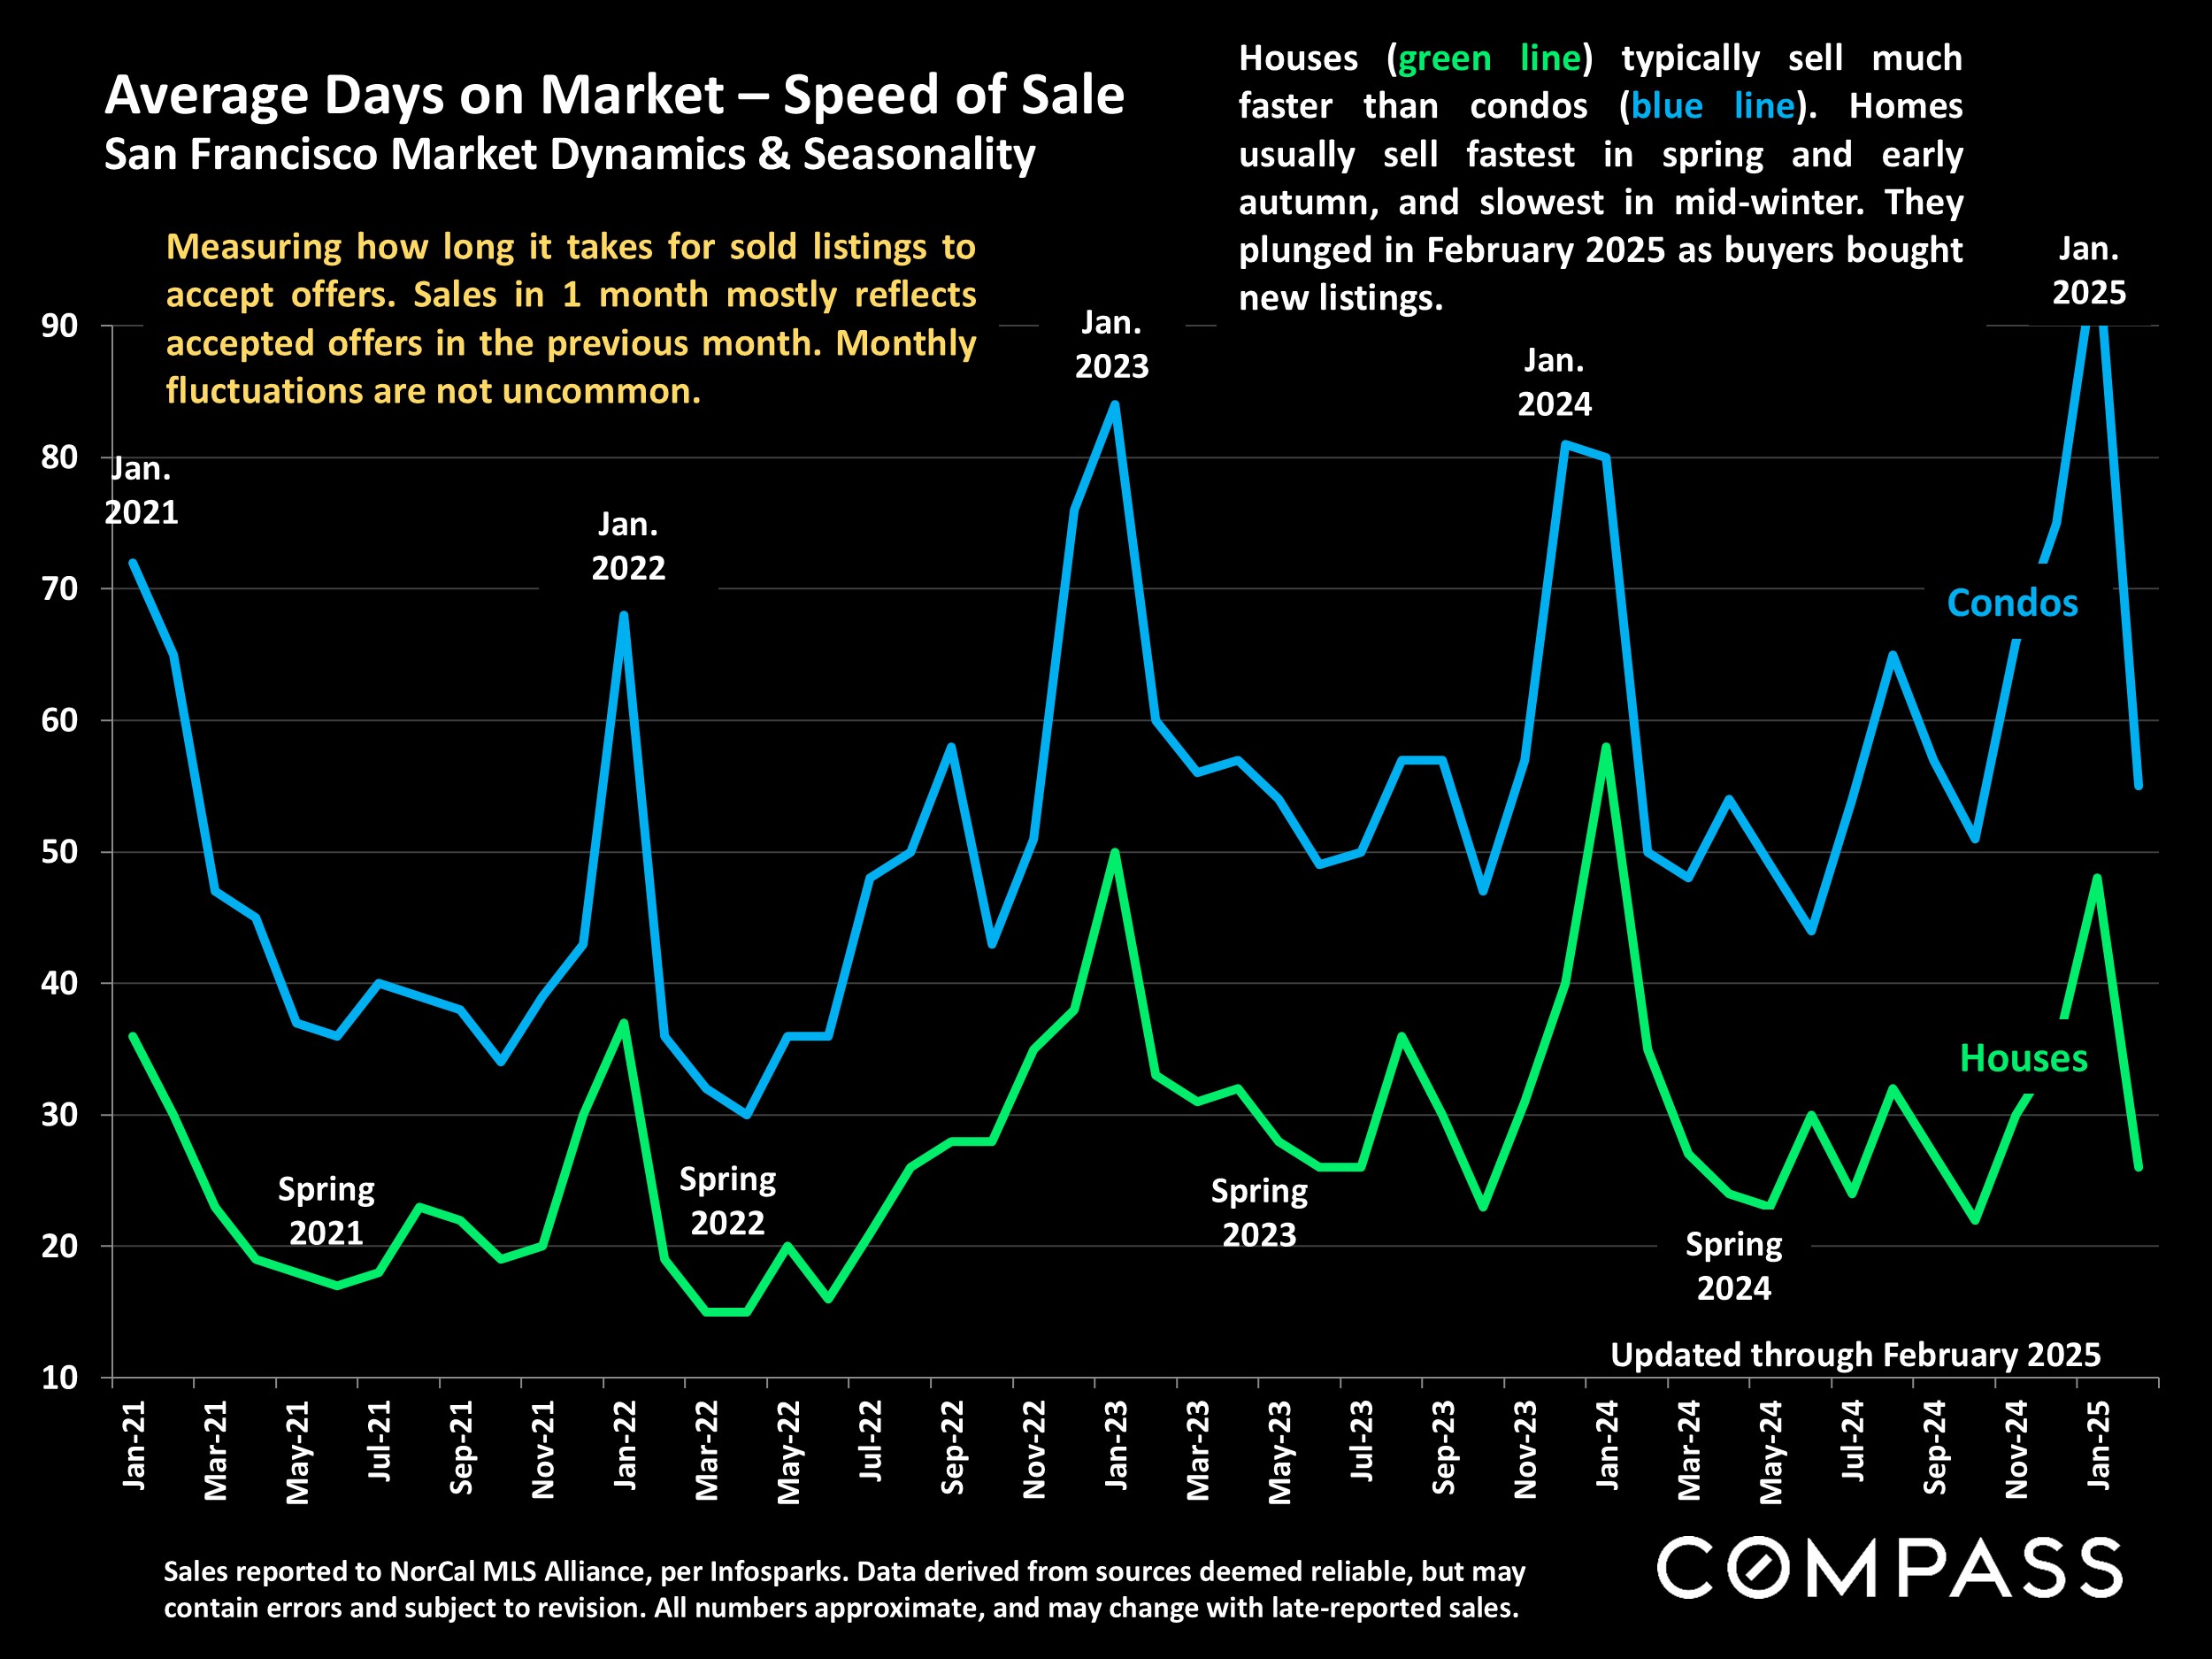
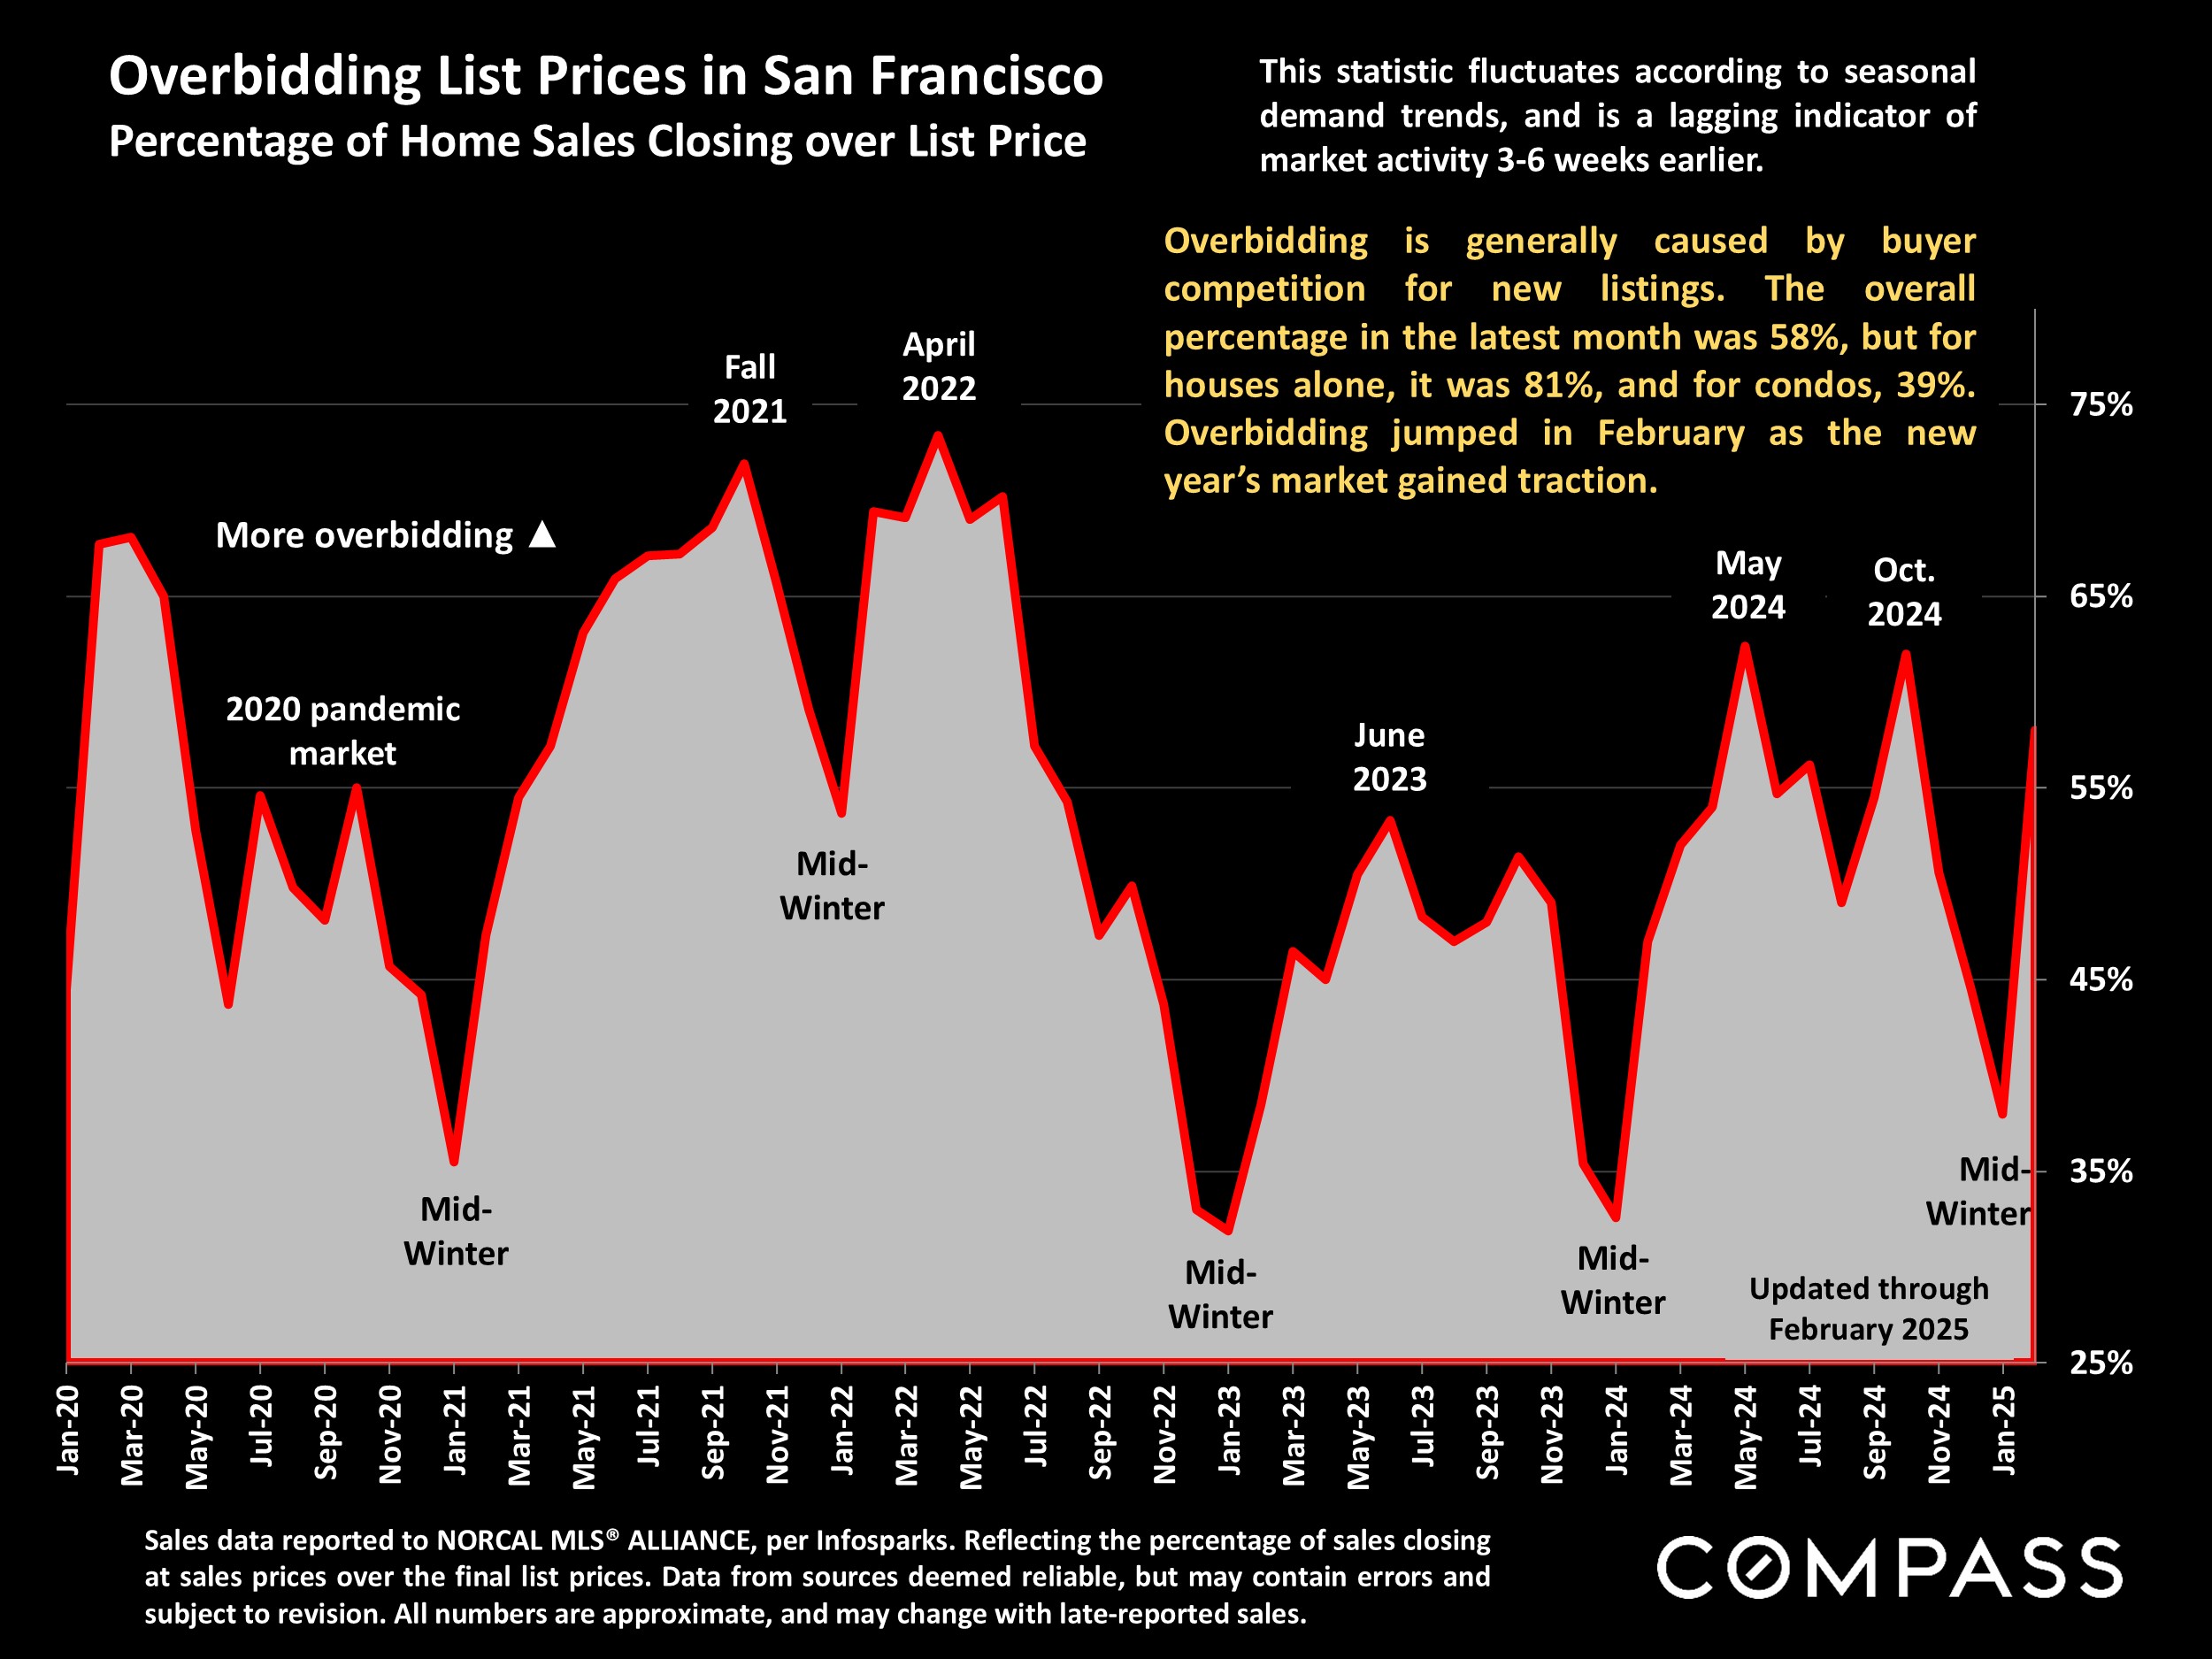
Market activity and demand - as defined by listings going into contract, speed of sale, and overbidding of list price - rose in February. Unlike other Bay Area markets, San Francisco has not seen a substantial increase in the number of homes for sale: The inventory of listings has remained relatively stable on a year-over-year basis for the past 4 years. As has been the case since the pandemic, the house market continues to be more heated than the condo market, though luxury condo/co-op sales jumped dramatically in the first 2 months of 2025.

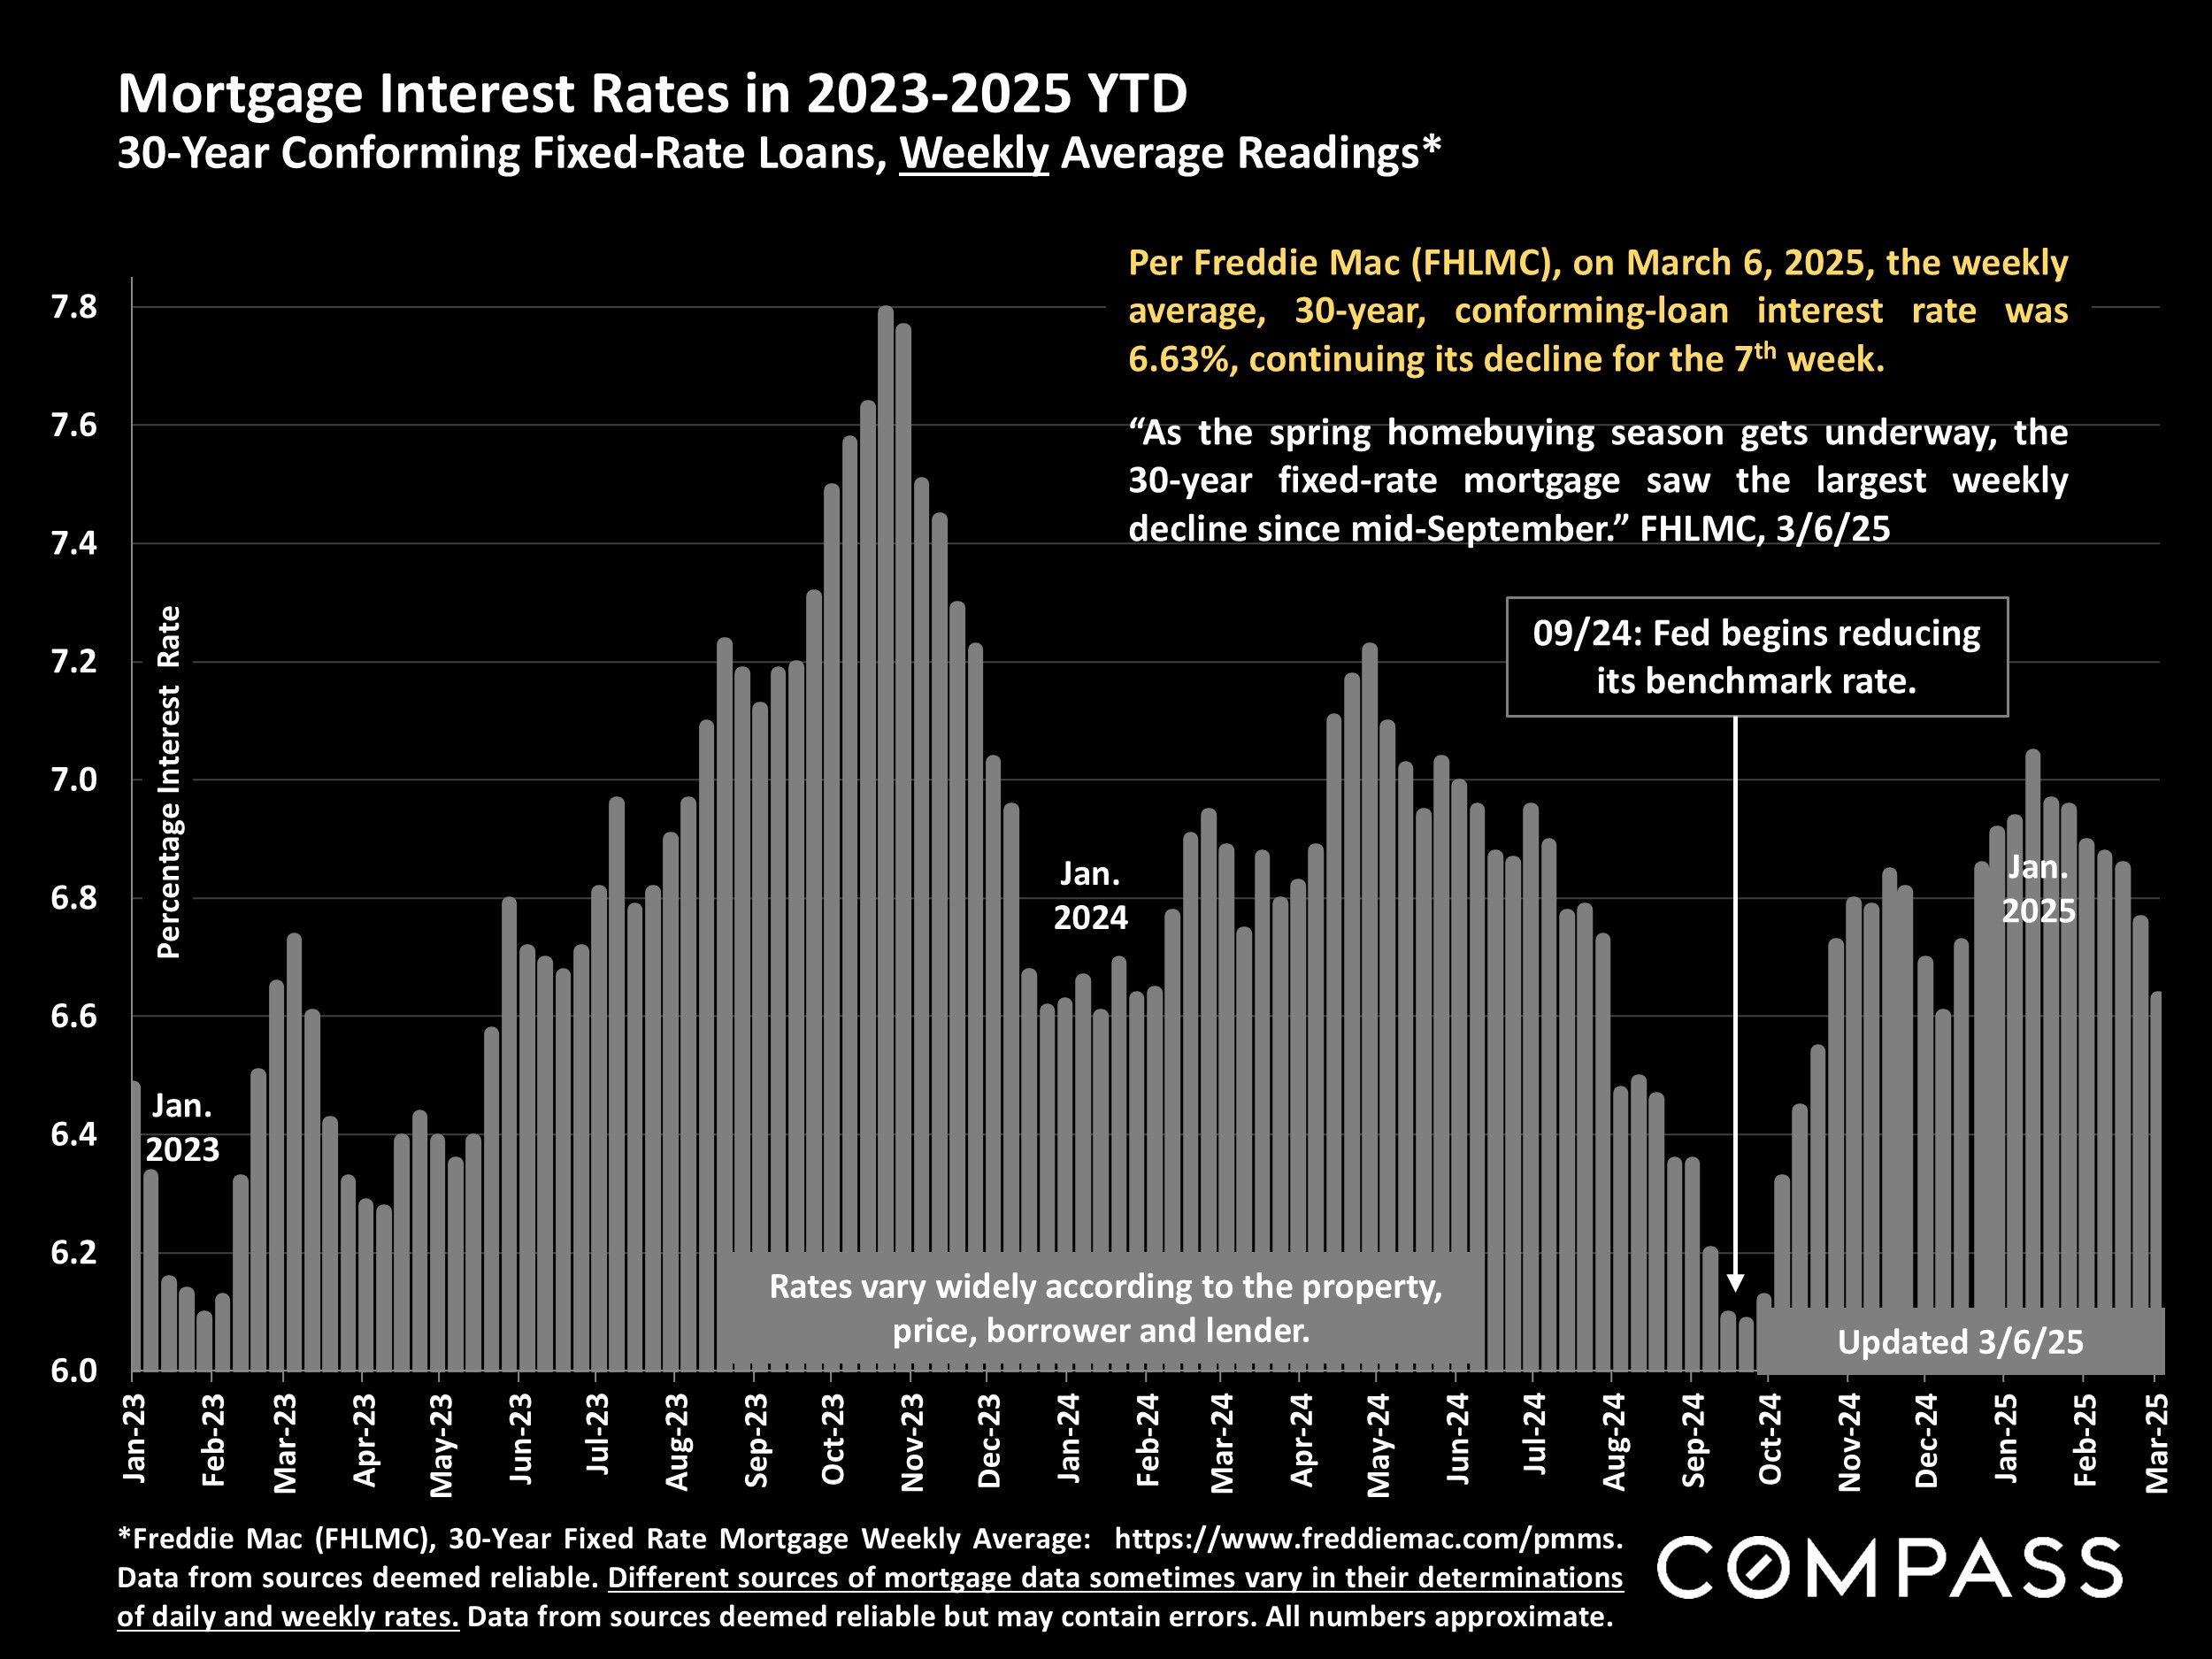
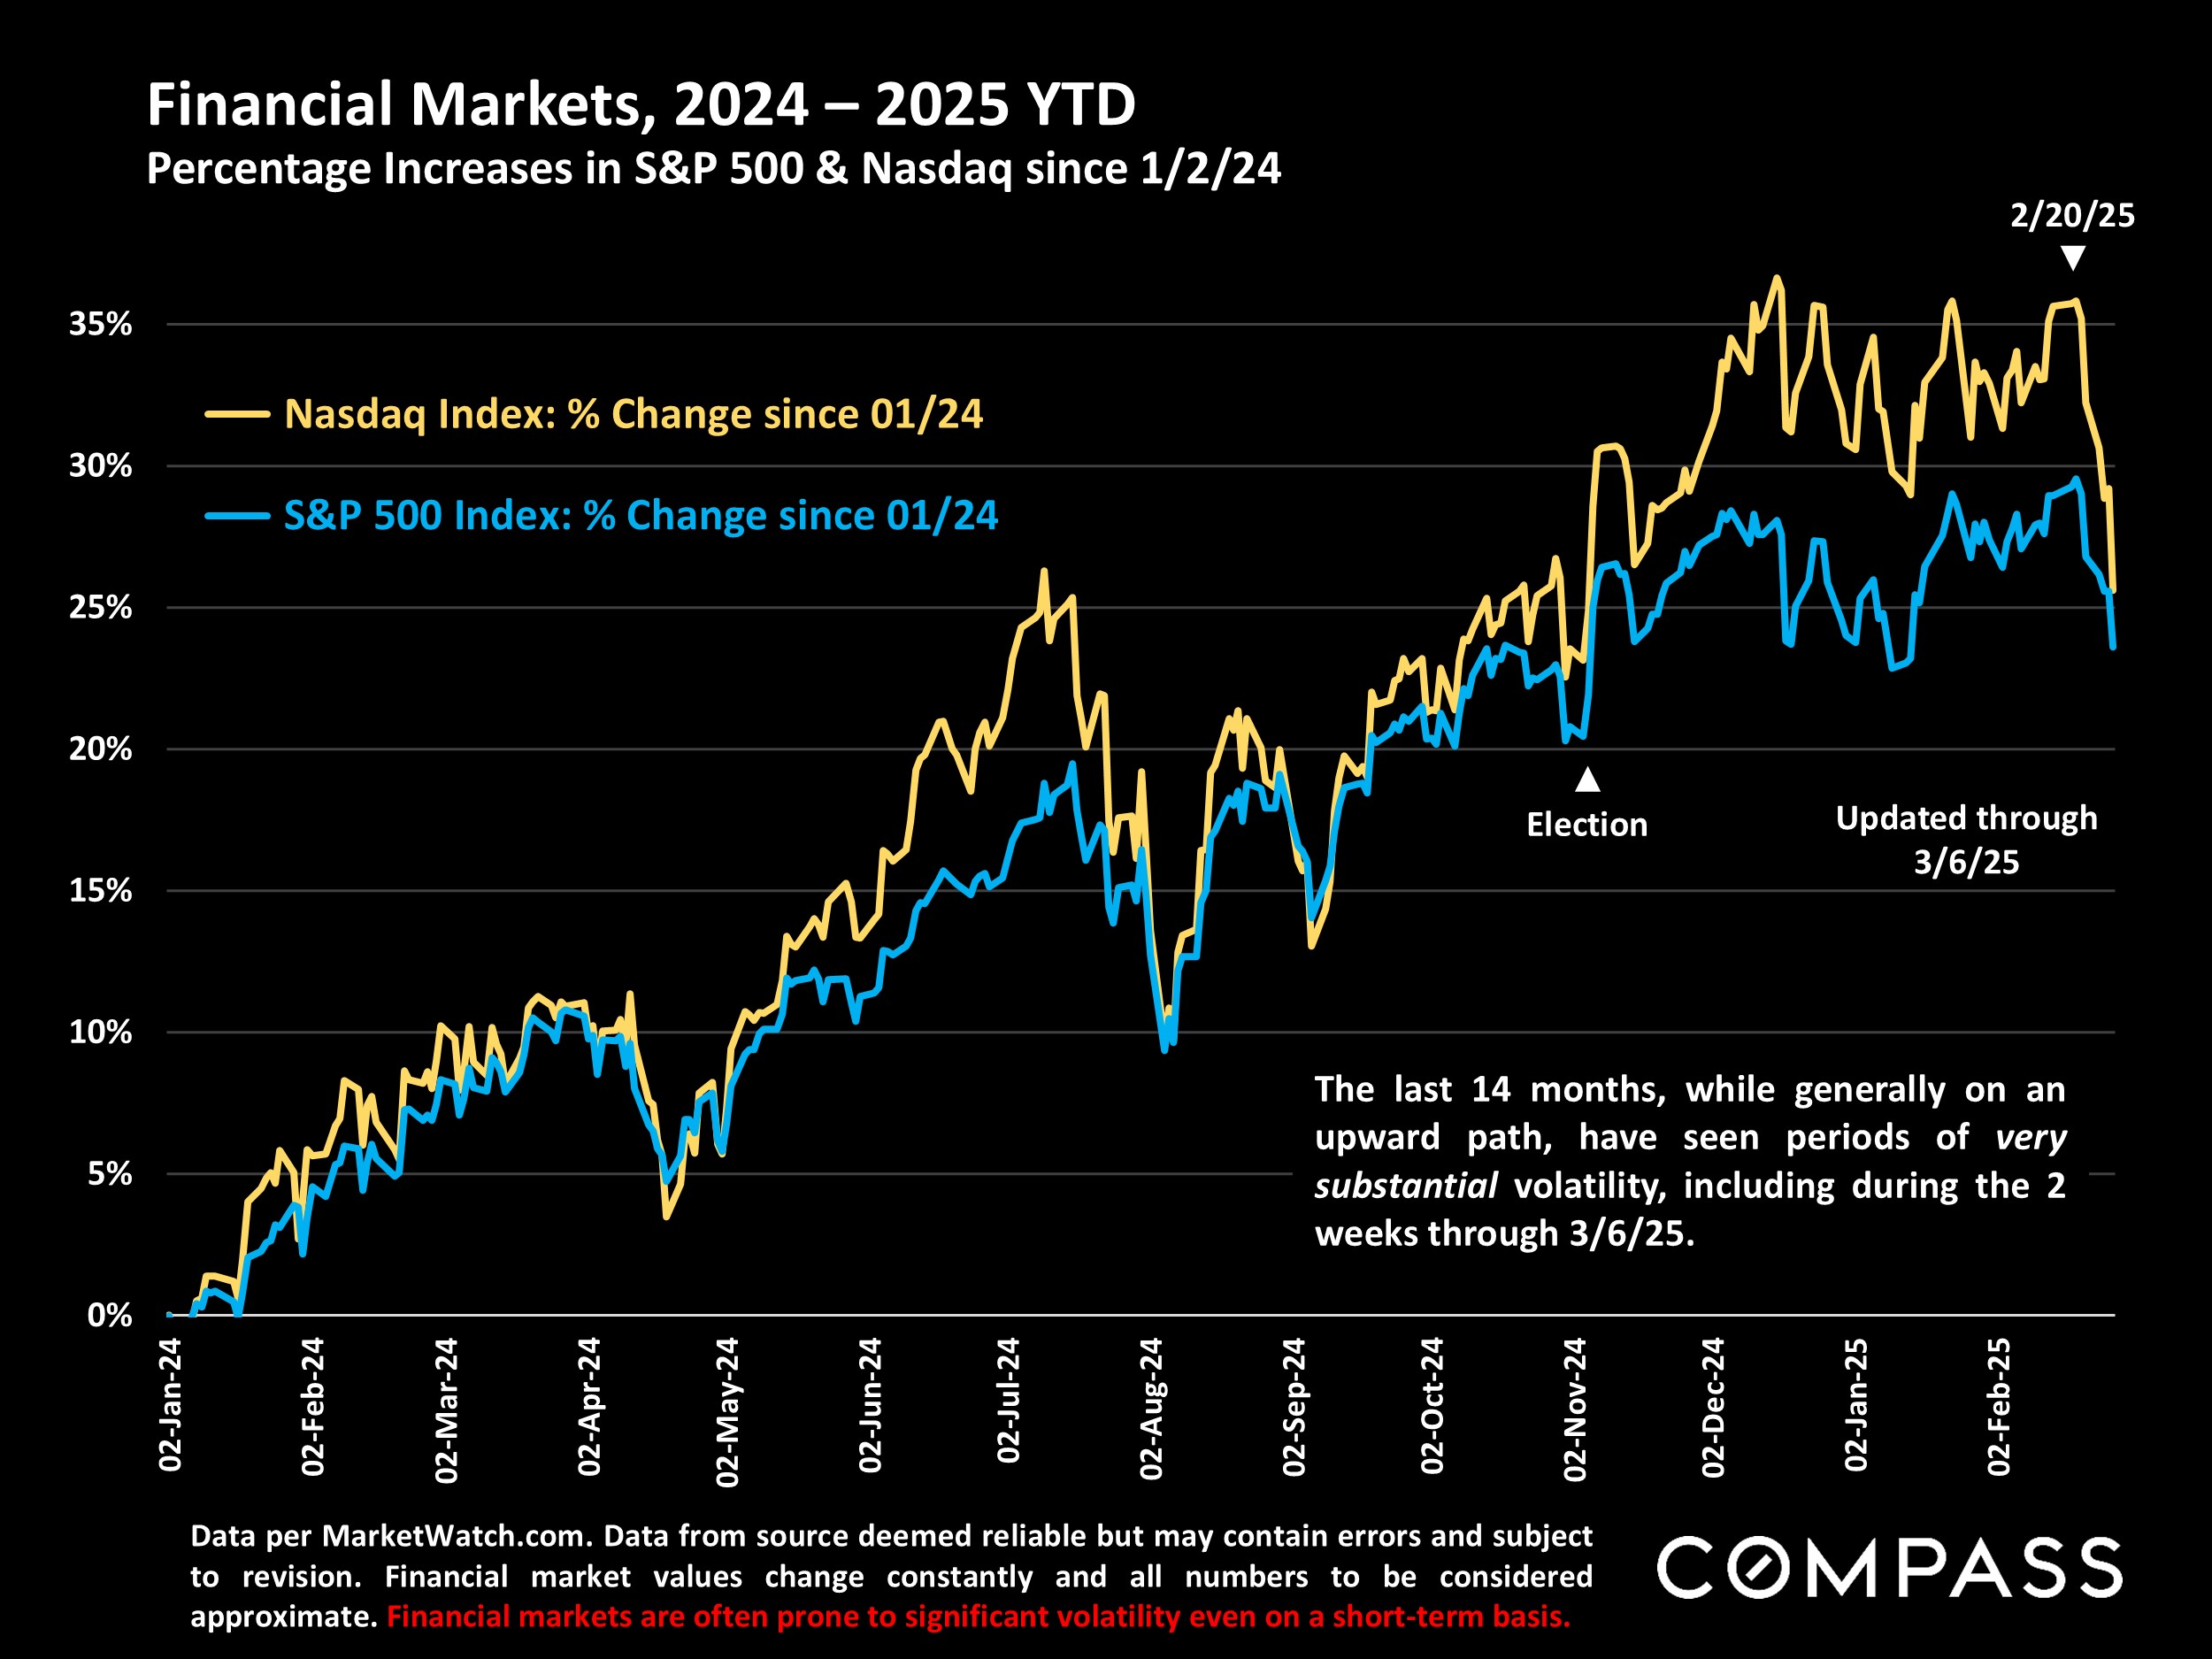
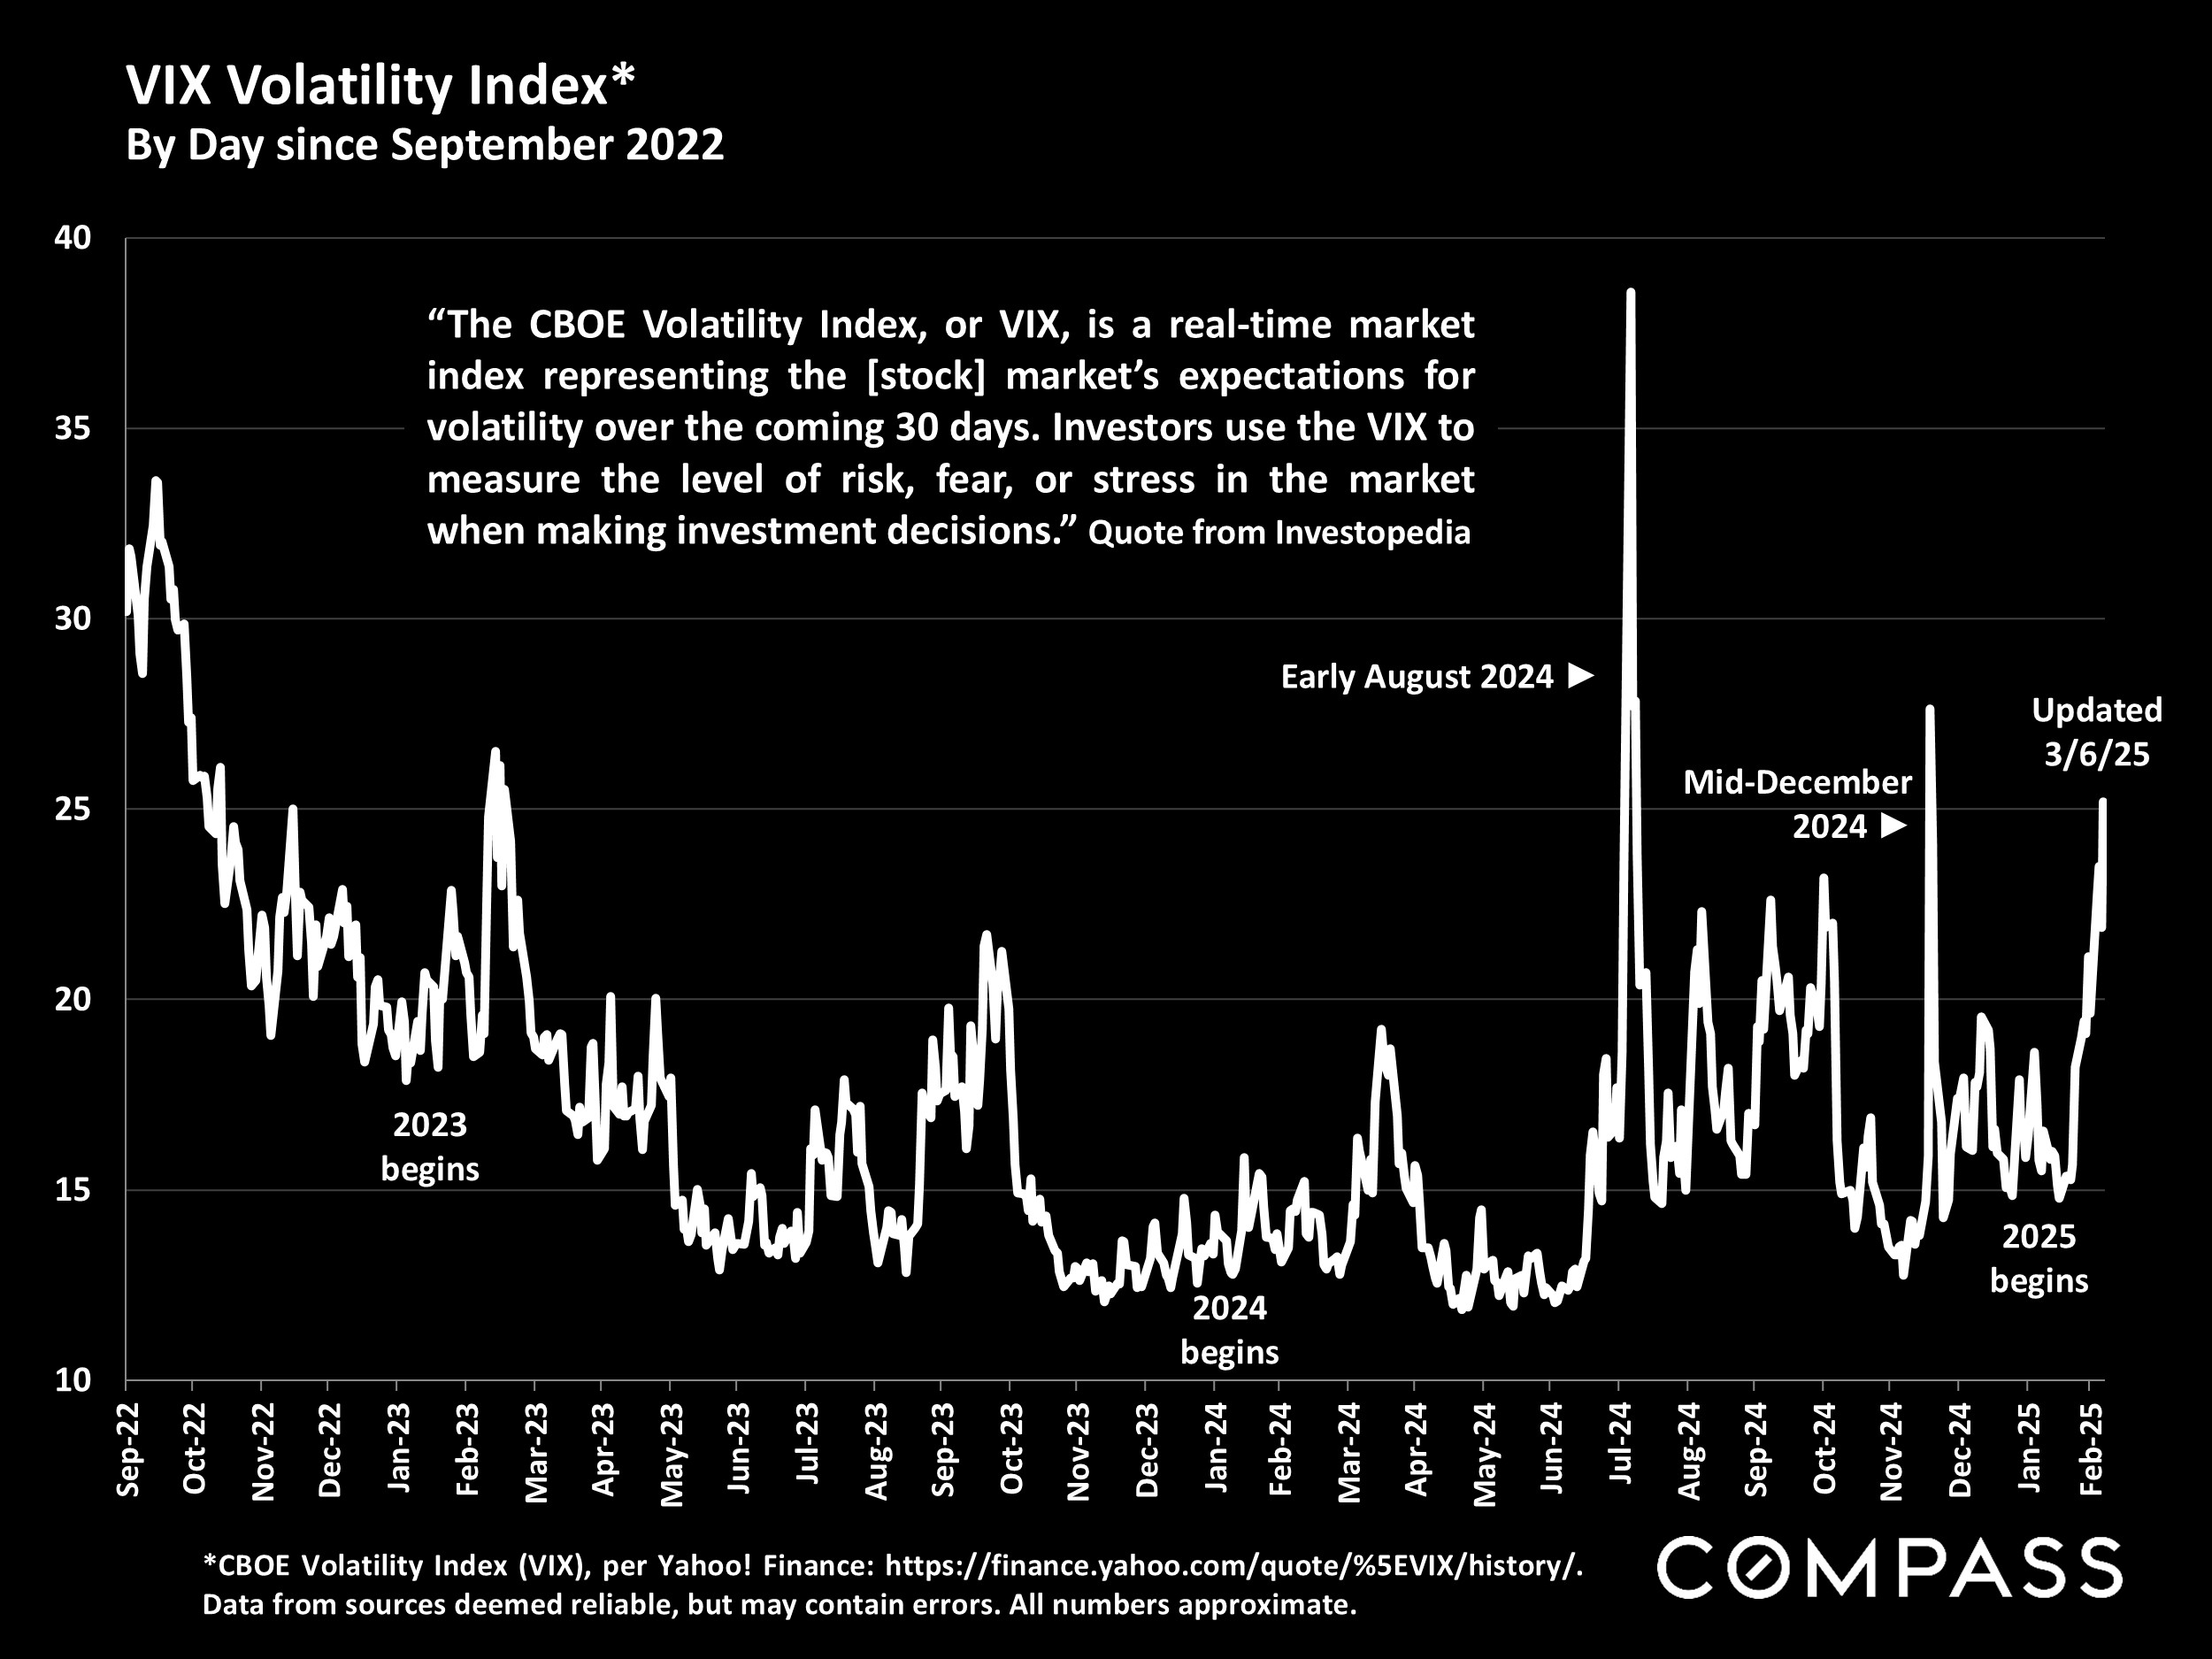
As of the first week of March, the latest inflation reading ticked up for the 4th month; the Fed kept its benchmark rate unchanged; interest rates fell for the 7th week; and stock markets saw 2 weeks of significant declines. National and international politics continue to be characterized by constant and unpredictable change and enormous uncertainty. And consumer confidence in February dropped across all age, income and wealth groups as expectations for personal finances and both short-term and long-term economic conditions all declined (per the University of Michigan's February "Surveys of Consumers").

We are now moving into the spring selling season, typically the most heated of the year, and not unusually seeing the calendar year's highest median home sales prices.

Mortgage Interest Rates in 2023-2025 YTD 30-Year Conforming Fixed-Rate Loans, Weekly Average Readings*Financial Markets, 2024 - 2025 YTD Percentage Increases in S&P 500 & Nasdaq since 1/2/24San Francisco HOUSE Price Trends since 1990 Monthly Median House Sales Prices, 3-Month RollingMedian House Sales Price Appreciation San Francisco % Change in Annual Median Sales Price*San Francisco House Sales Percentage of Sales by Era of ConstructionSan Francisco CONDO Price Trends since 2005 Median Condo Sales Price, 3-Month RollingMedian Condo Sales Price Appreciation San Francisco % Change in Annual Median Sales Price*San Francisco CONDO Prices: Downtown vs. Non-Downtown 6-Month-Rolling, Median 2-Bedroom Condo Sales Prices since 2005*San Francisco Value Trends since 2005 3-Month-Rolling, Median Dollar per Square Foot Values*San Francisco Residential Market Market Dynamics by Price Segment/Property TypeNew Listings Coming on Market San Francisco Market Dynamics & Seasonality*San Francisco Homes Market Active & Coming-Soon Listings on 1st of Month*Listings Accepting Offers (Going into Contract) San Francisco Market Dynamics & SeasonalityPercentage of Listings Accepting Offers San Francisco: Absorption Rate by MonthMonthly Home Sales Volume* San Francisco Market Dynamics & SeasonalitySan Francisco Luxury House Sales* Houses Selling for $5 Million+ since 2018San Francisco Luxury Condo & Co-op Sales* Units Selling for $2.5 Million+ since 2018Price Reductions on Active Listings San Francisco Market Dynamics & SeasonalityAverage Days on Market - Speed of Sale San Francisco Market Dynamics & SeasonalityOverbidding List Prices in San Francisco Percentage of Home Sales Closing over List PriceAverage Sales Price to Original List Price Percentage San Francisco Over/Under Bidding: Market Dynamics & SeasonalityVIX Volatility Index* By Day since September 2022

Want to learn more about Bay Area market trends?

Let’s connect! With relationships and networks across the city, there are a variety of ways I can help you make informed real estate decisions. Call, email, or text – I’m here to help.


Contact