Feature image for SF: November 2024 Market Stats

November 8, 2024

SF: November 2024 Market Stats

By Compass

A Substantial Rebound in Market Activity

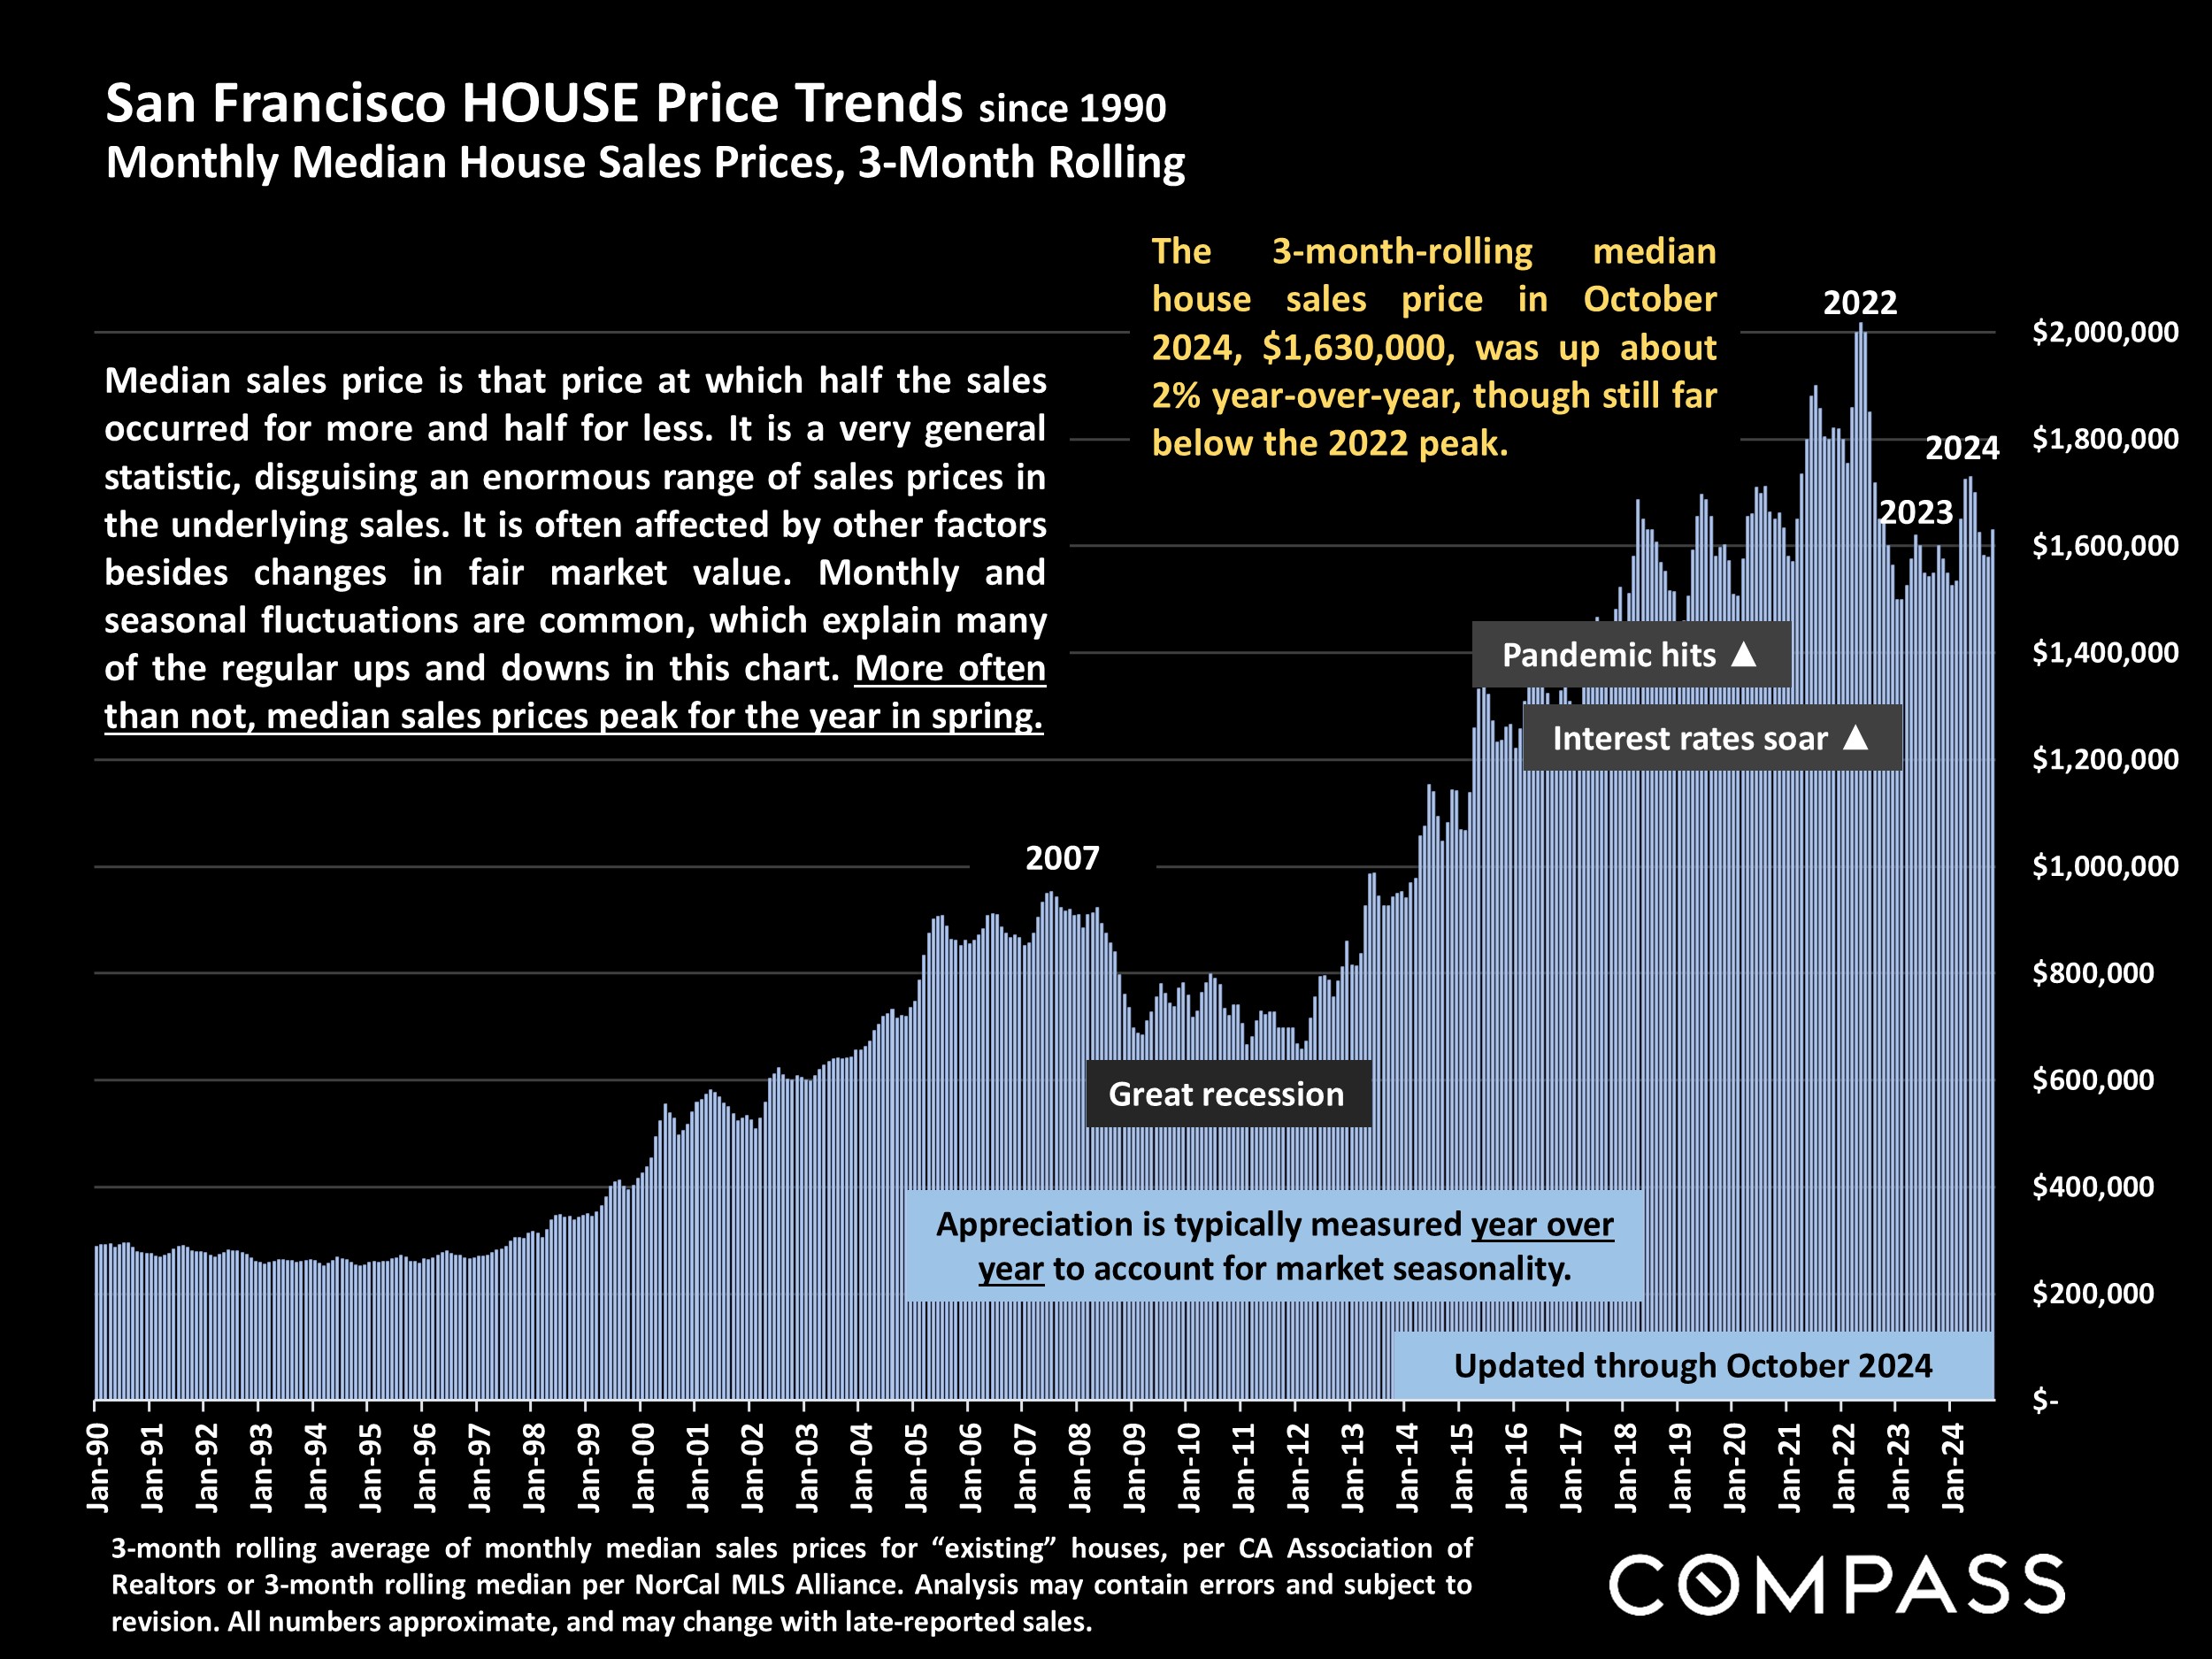
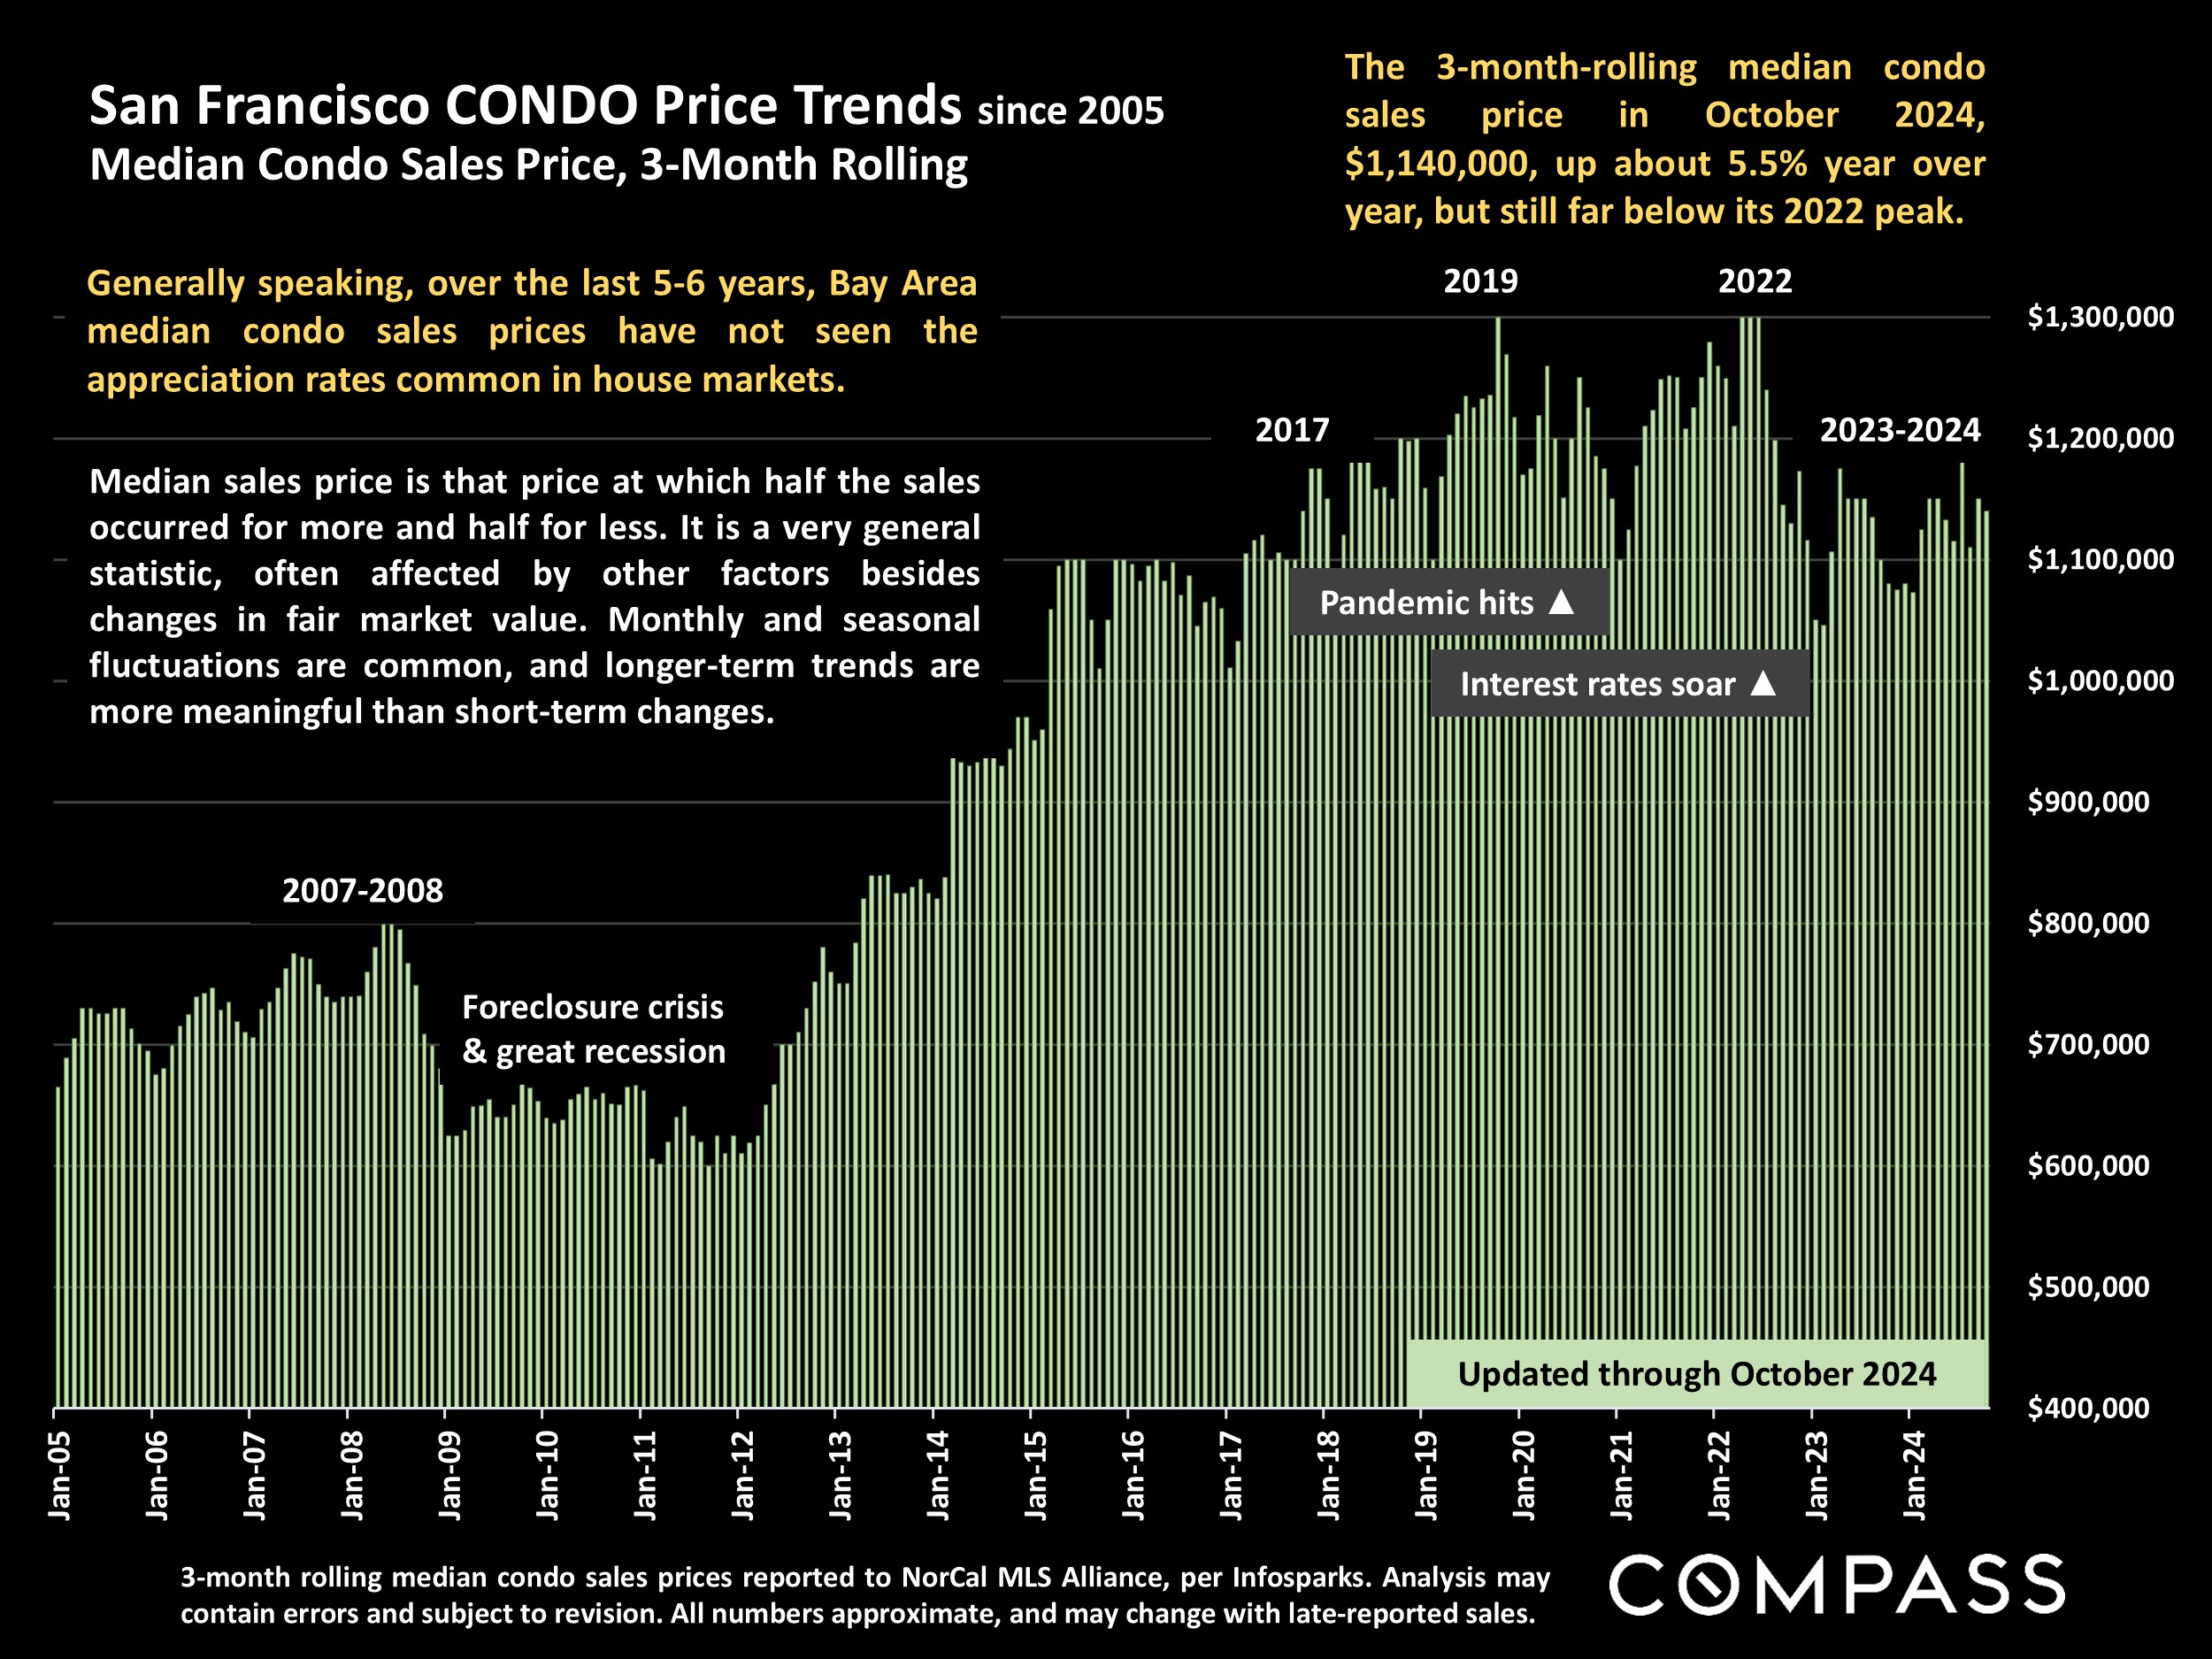
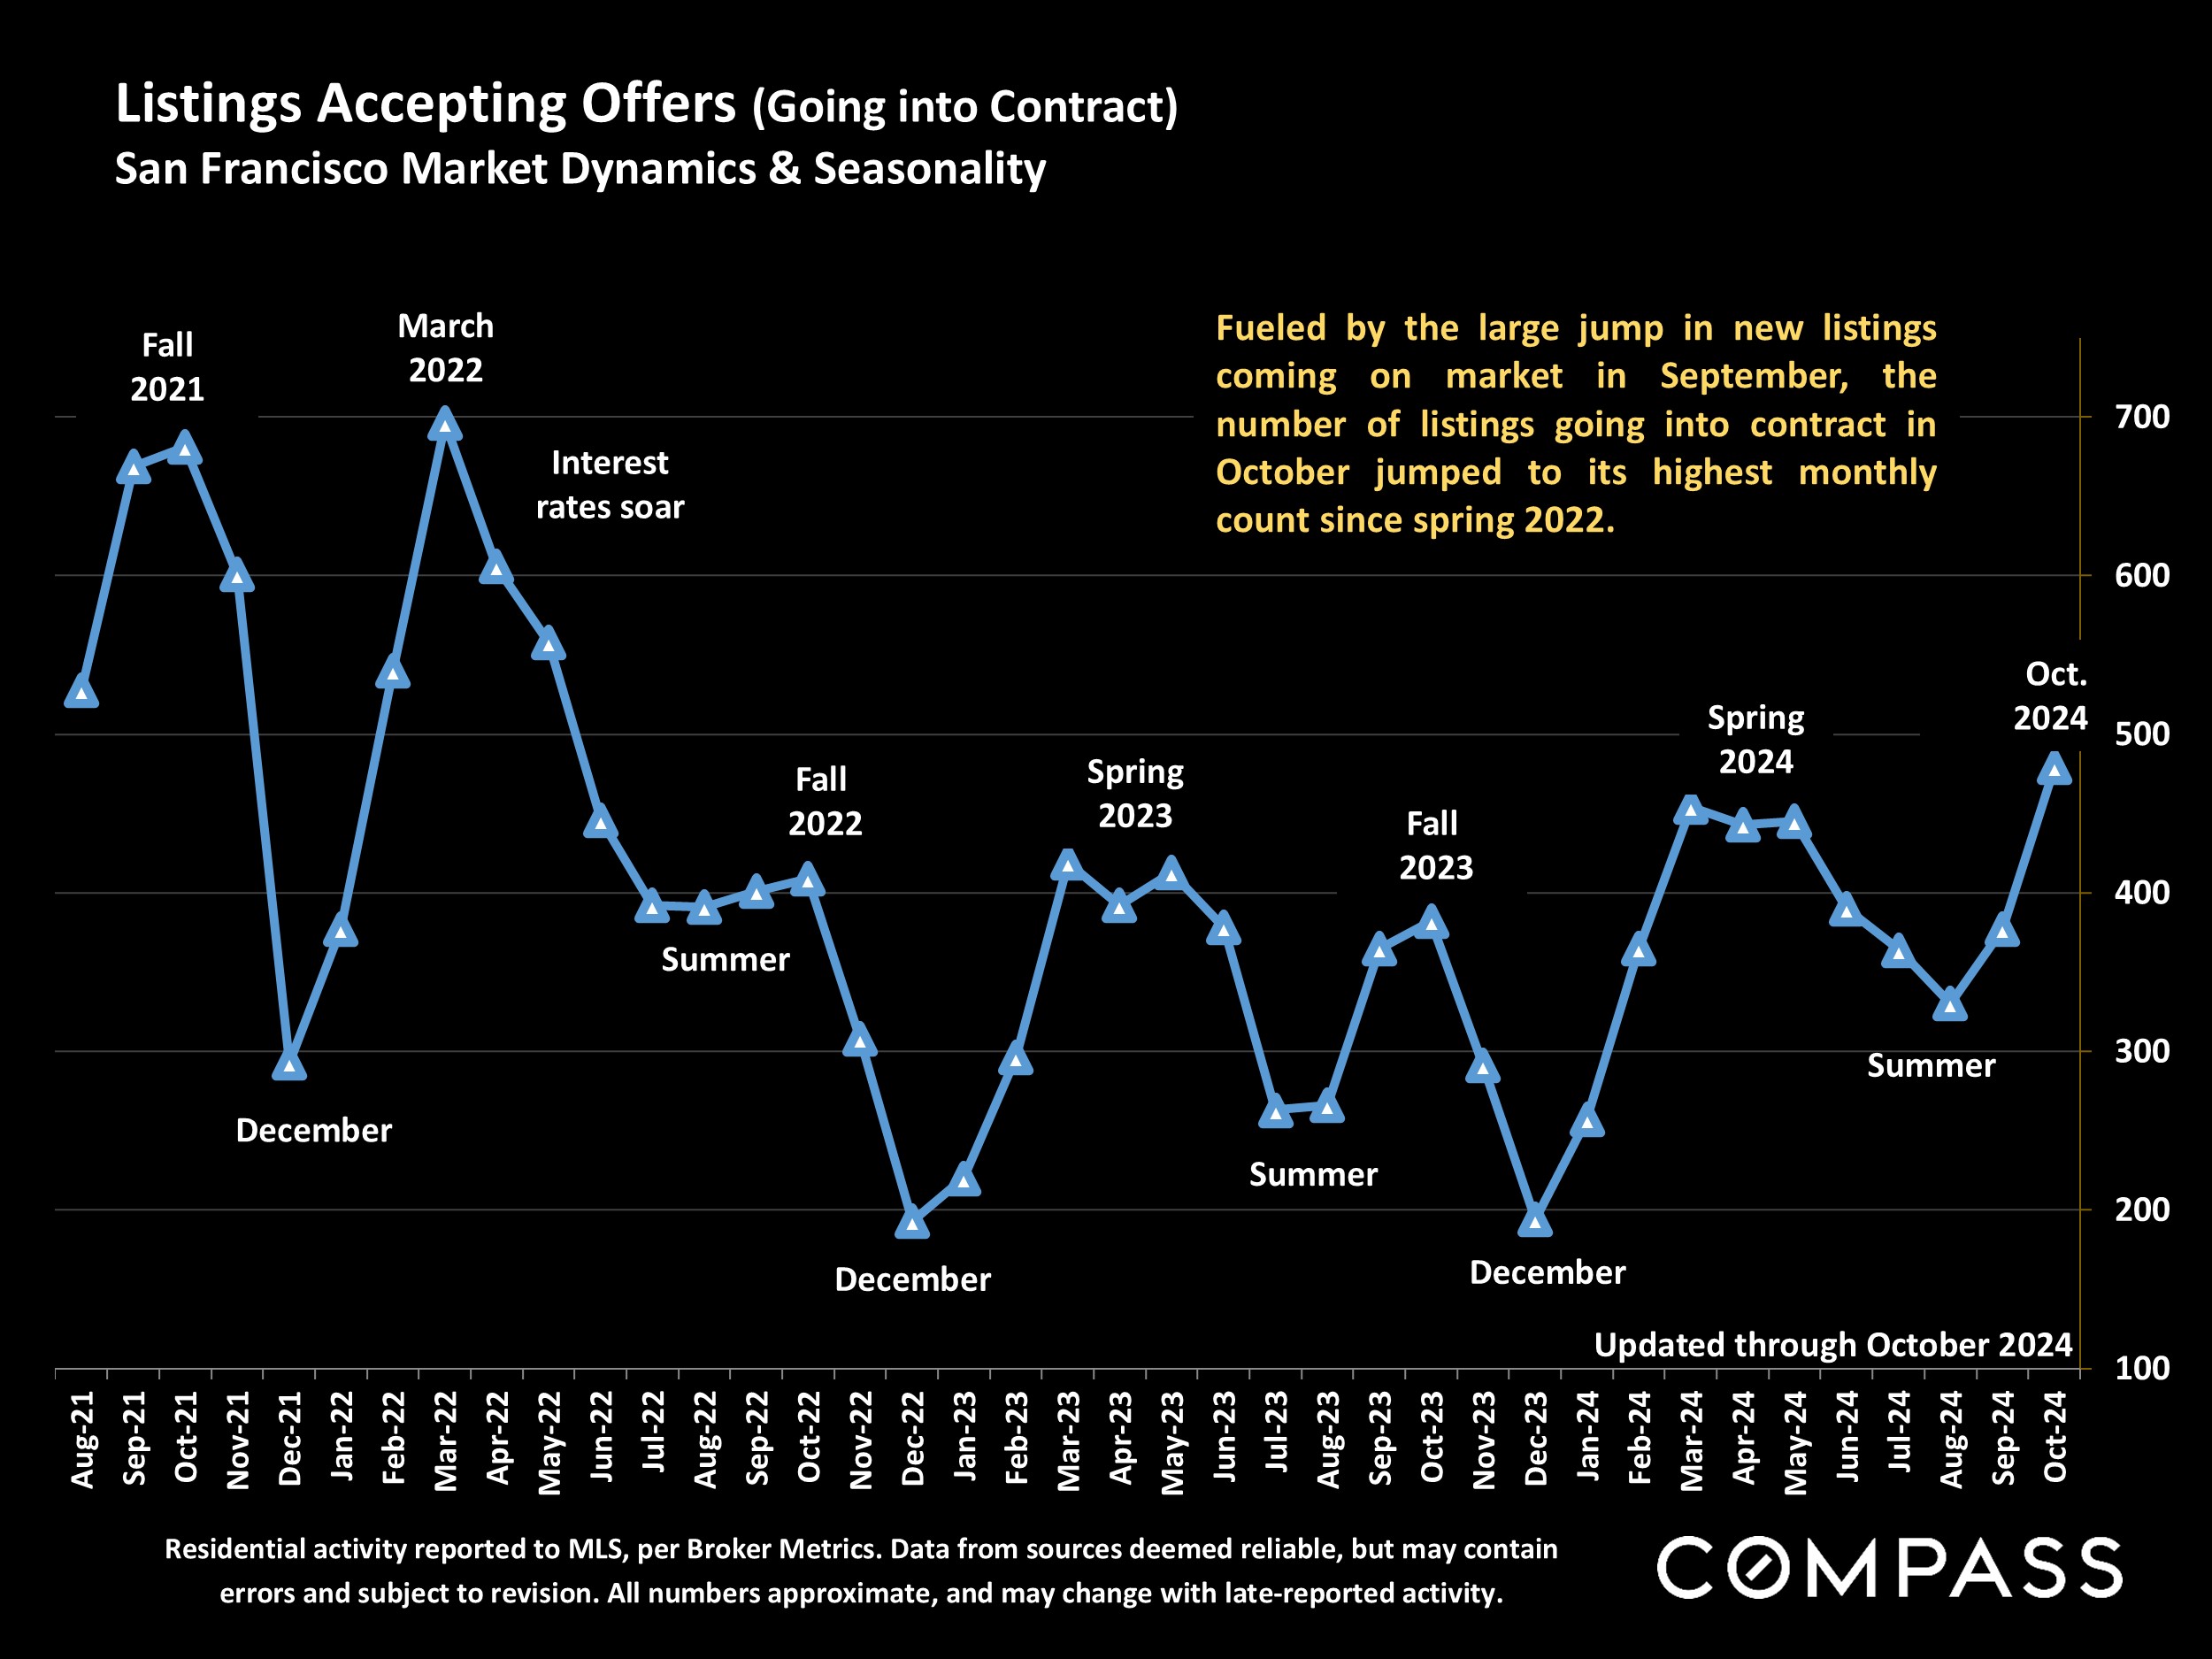
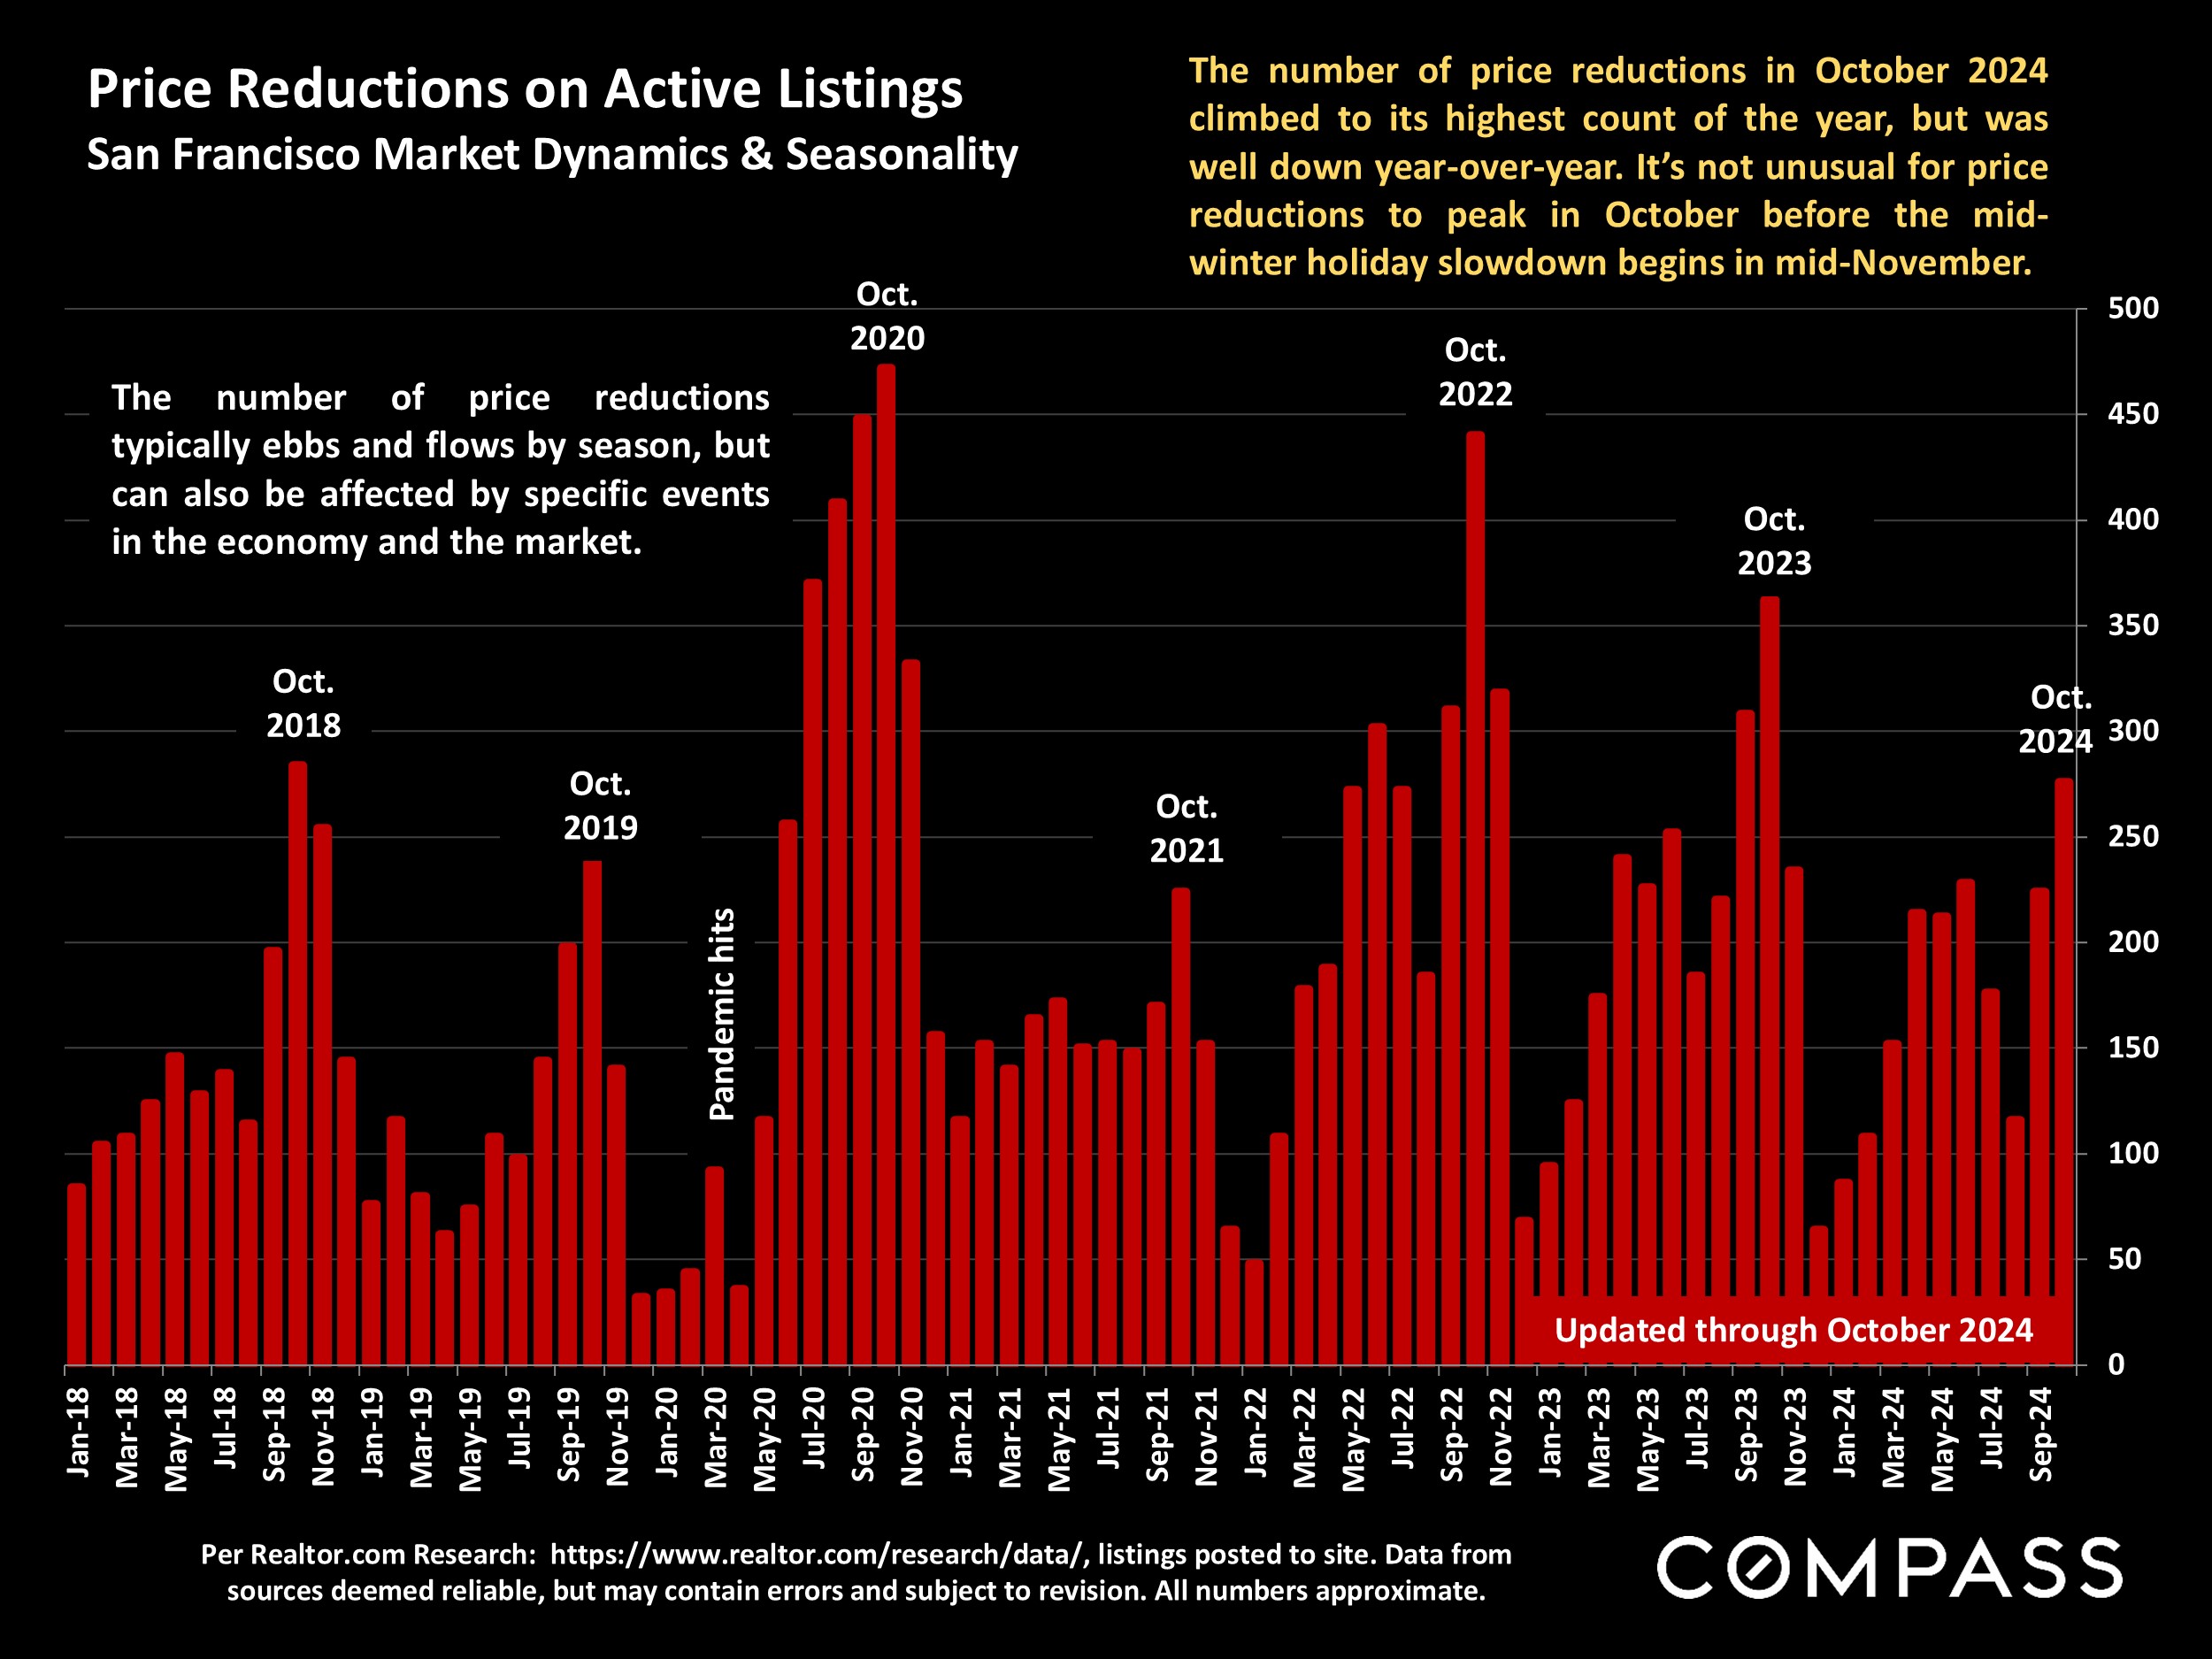
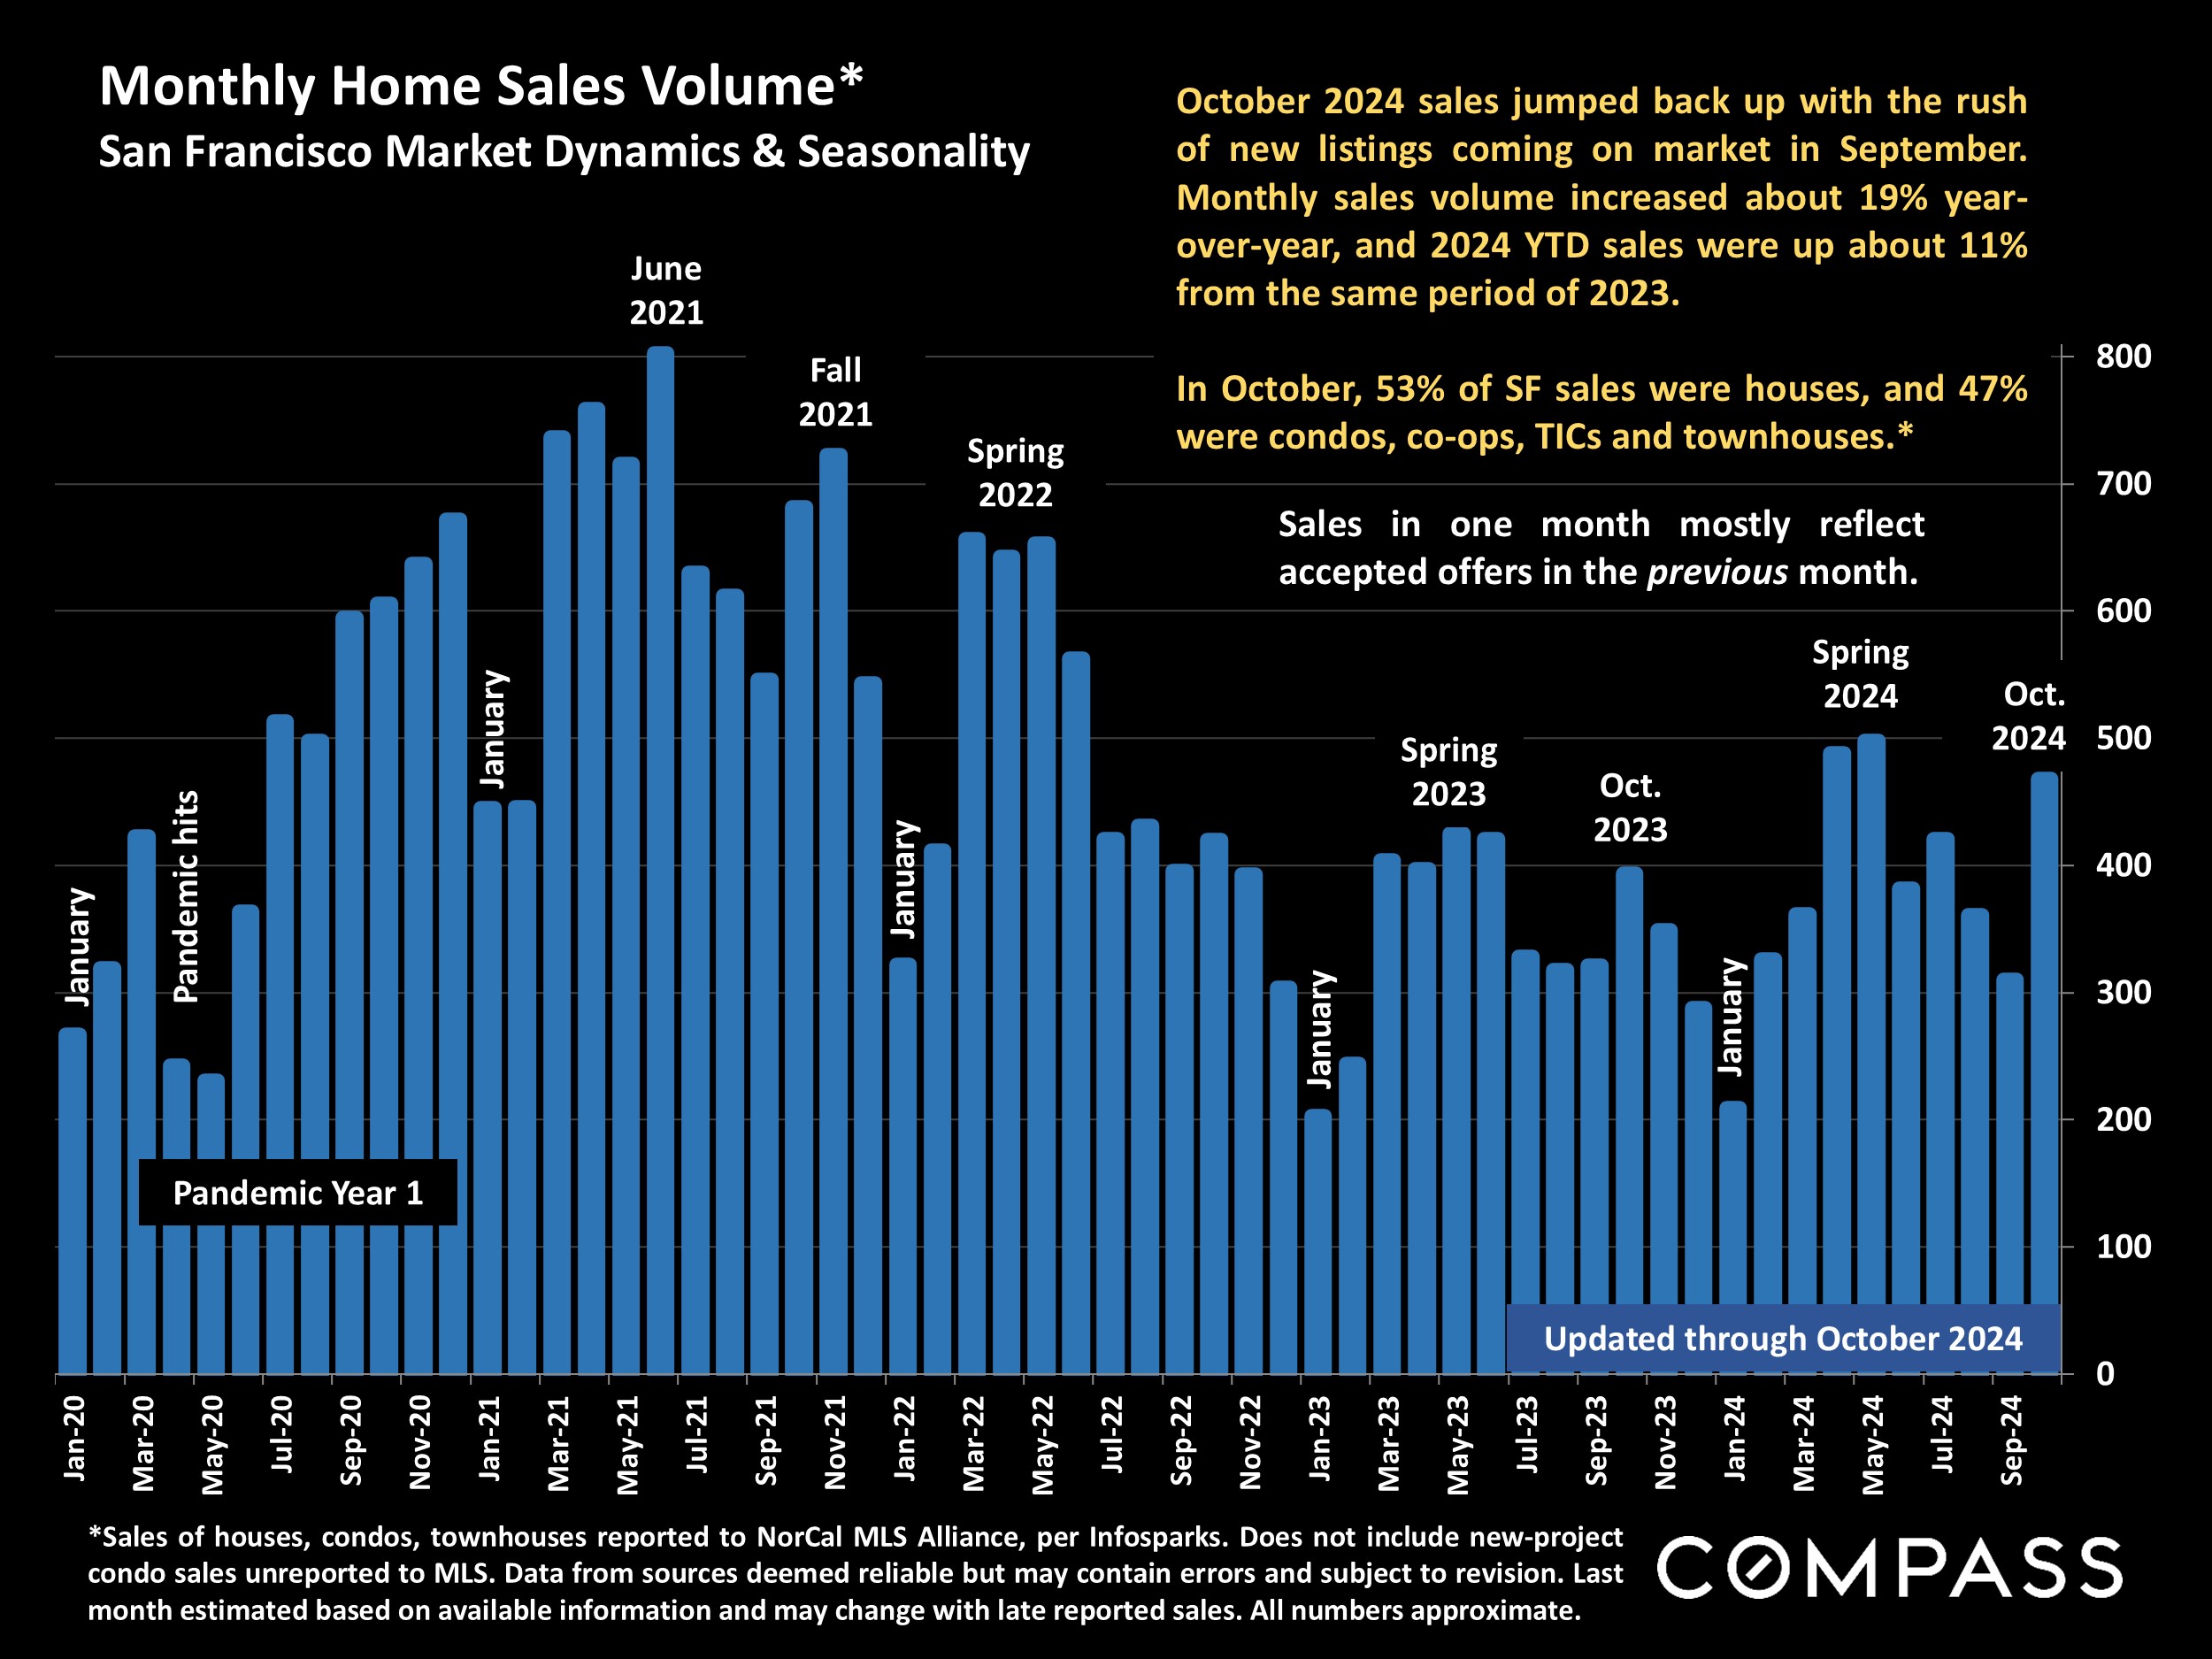
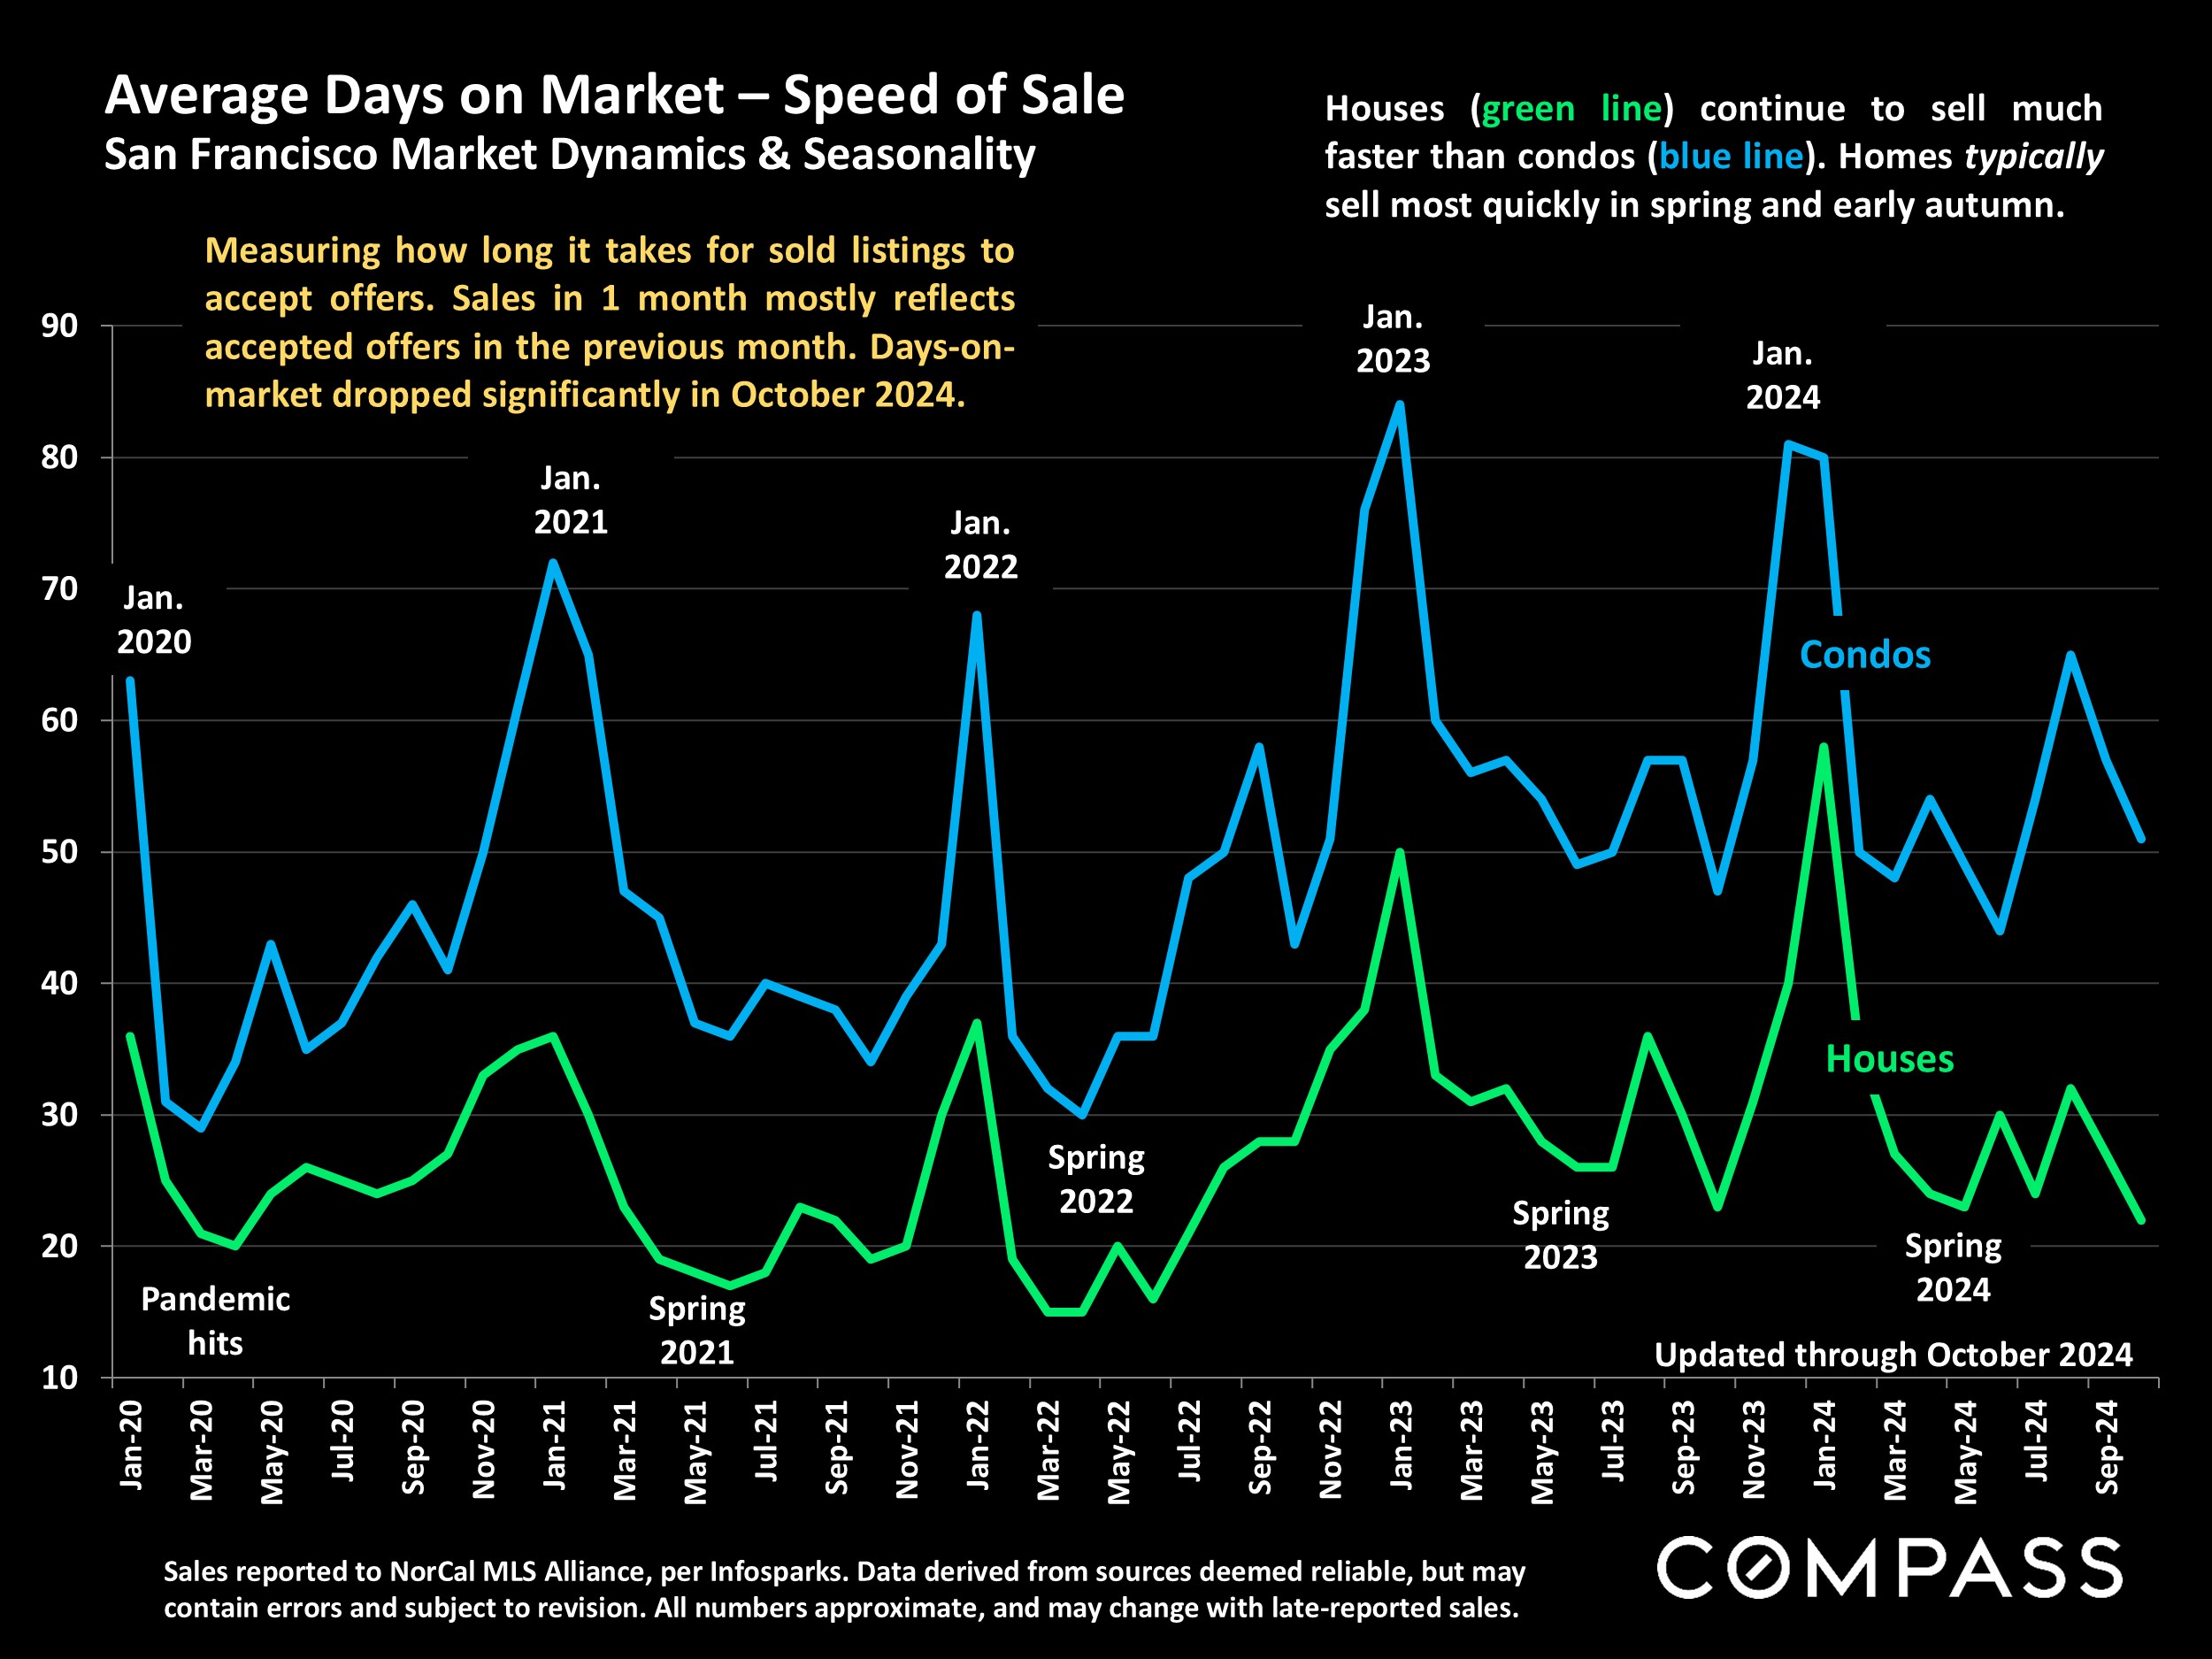
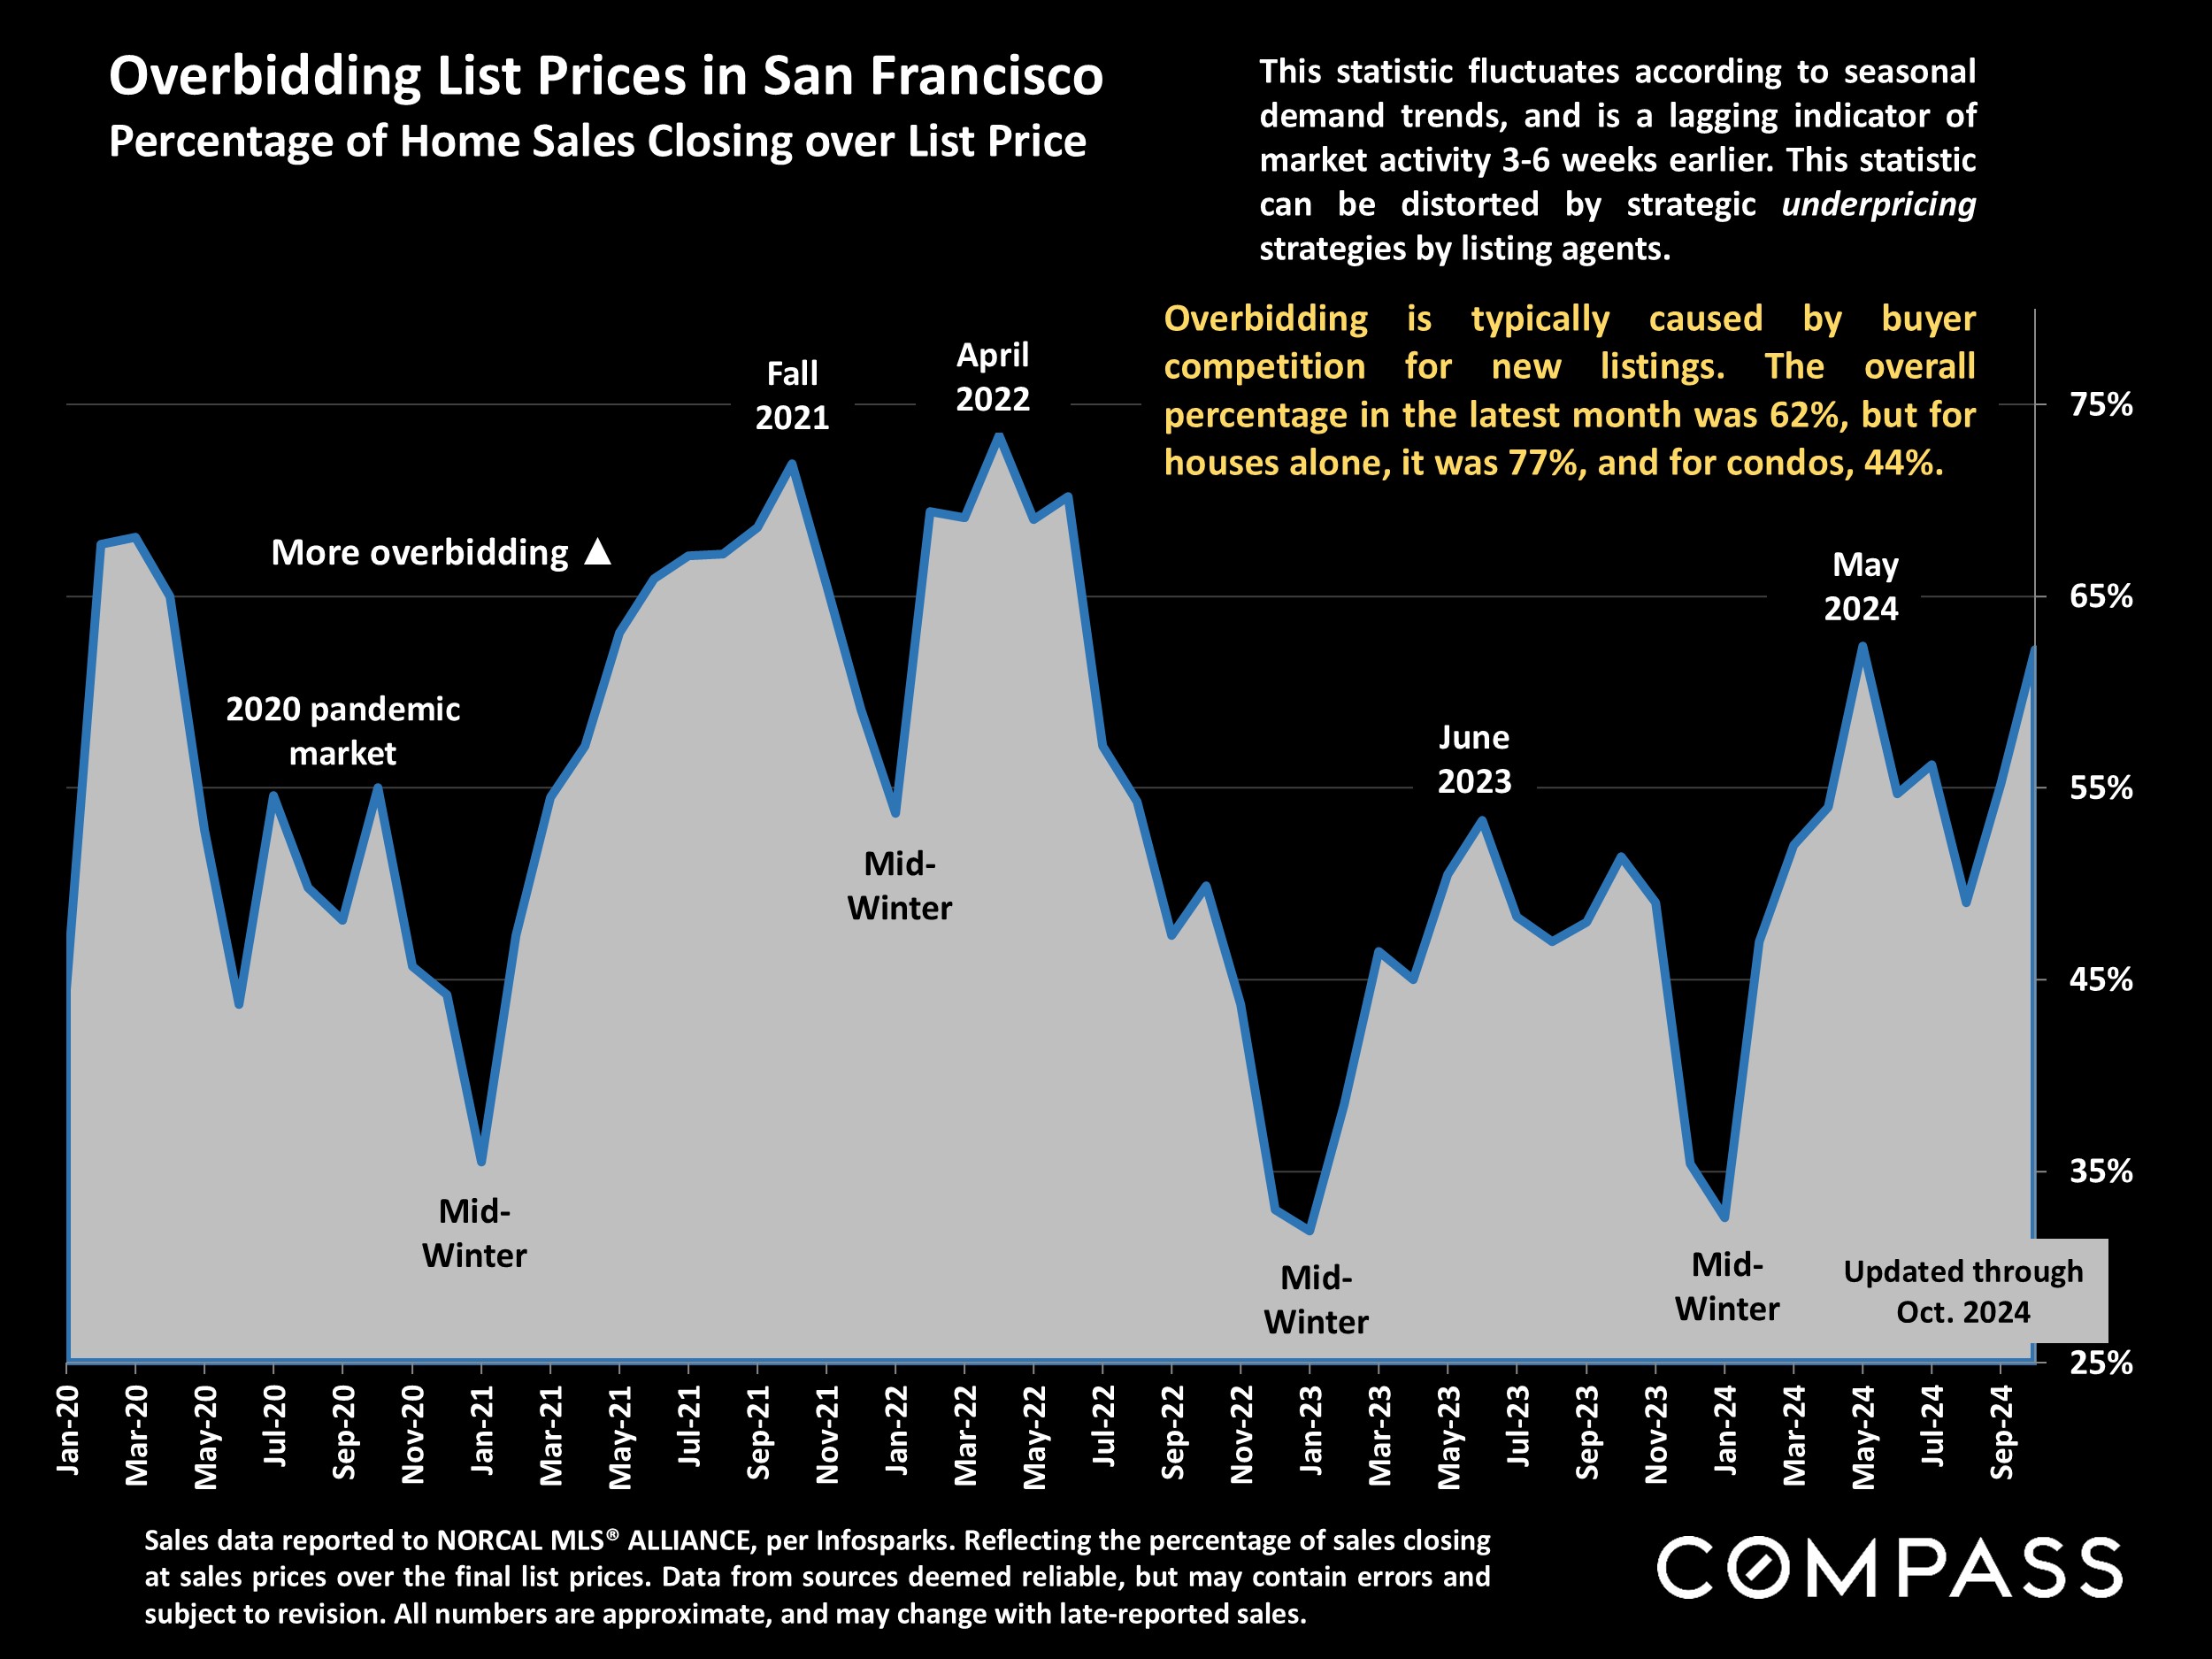
Year over year, median house and condo sales prices were up in October 2024, 2% and 5.5% respectively. Fueled by the large jump in new listings in September, sales activity - as measured by the number of listings that went into contract - hit its highest point since spring 2022. The absorption rate, which measures buyer demand vs. the supply of homes for sale, hit its highest percentage since spring 2022. Monthly sales volume was up 19% year-over-year, and year-to-date sales were up 11%. Days-on-market declined and overbidding increased. The number of price reductions in October 2024 climbed to its highest count of the year - the typical seasonal trend - but was well down year-over-year.

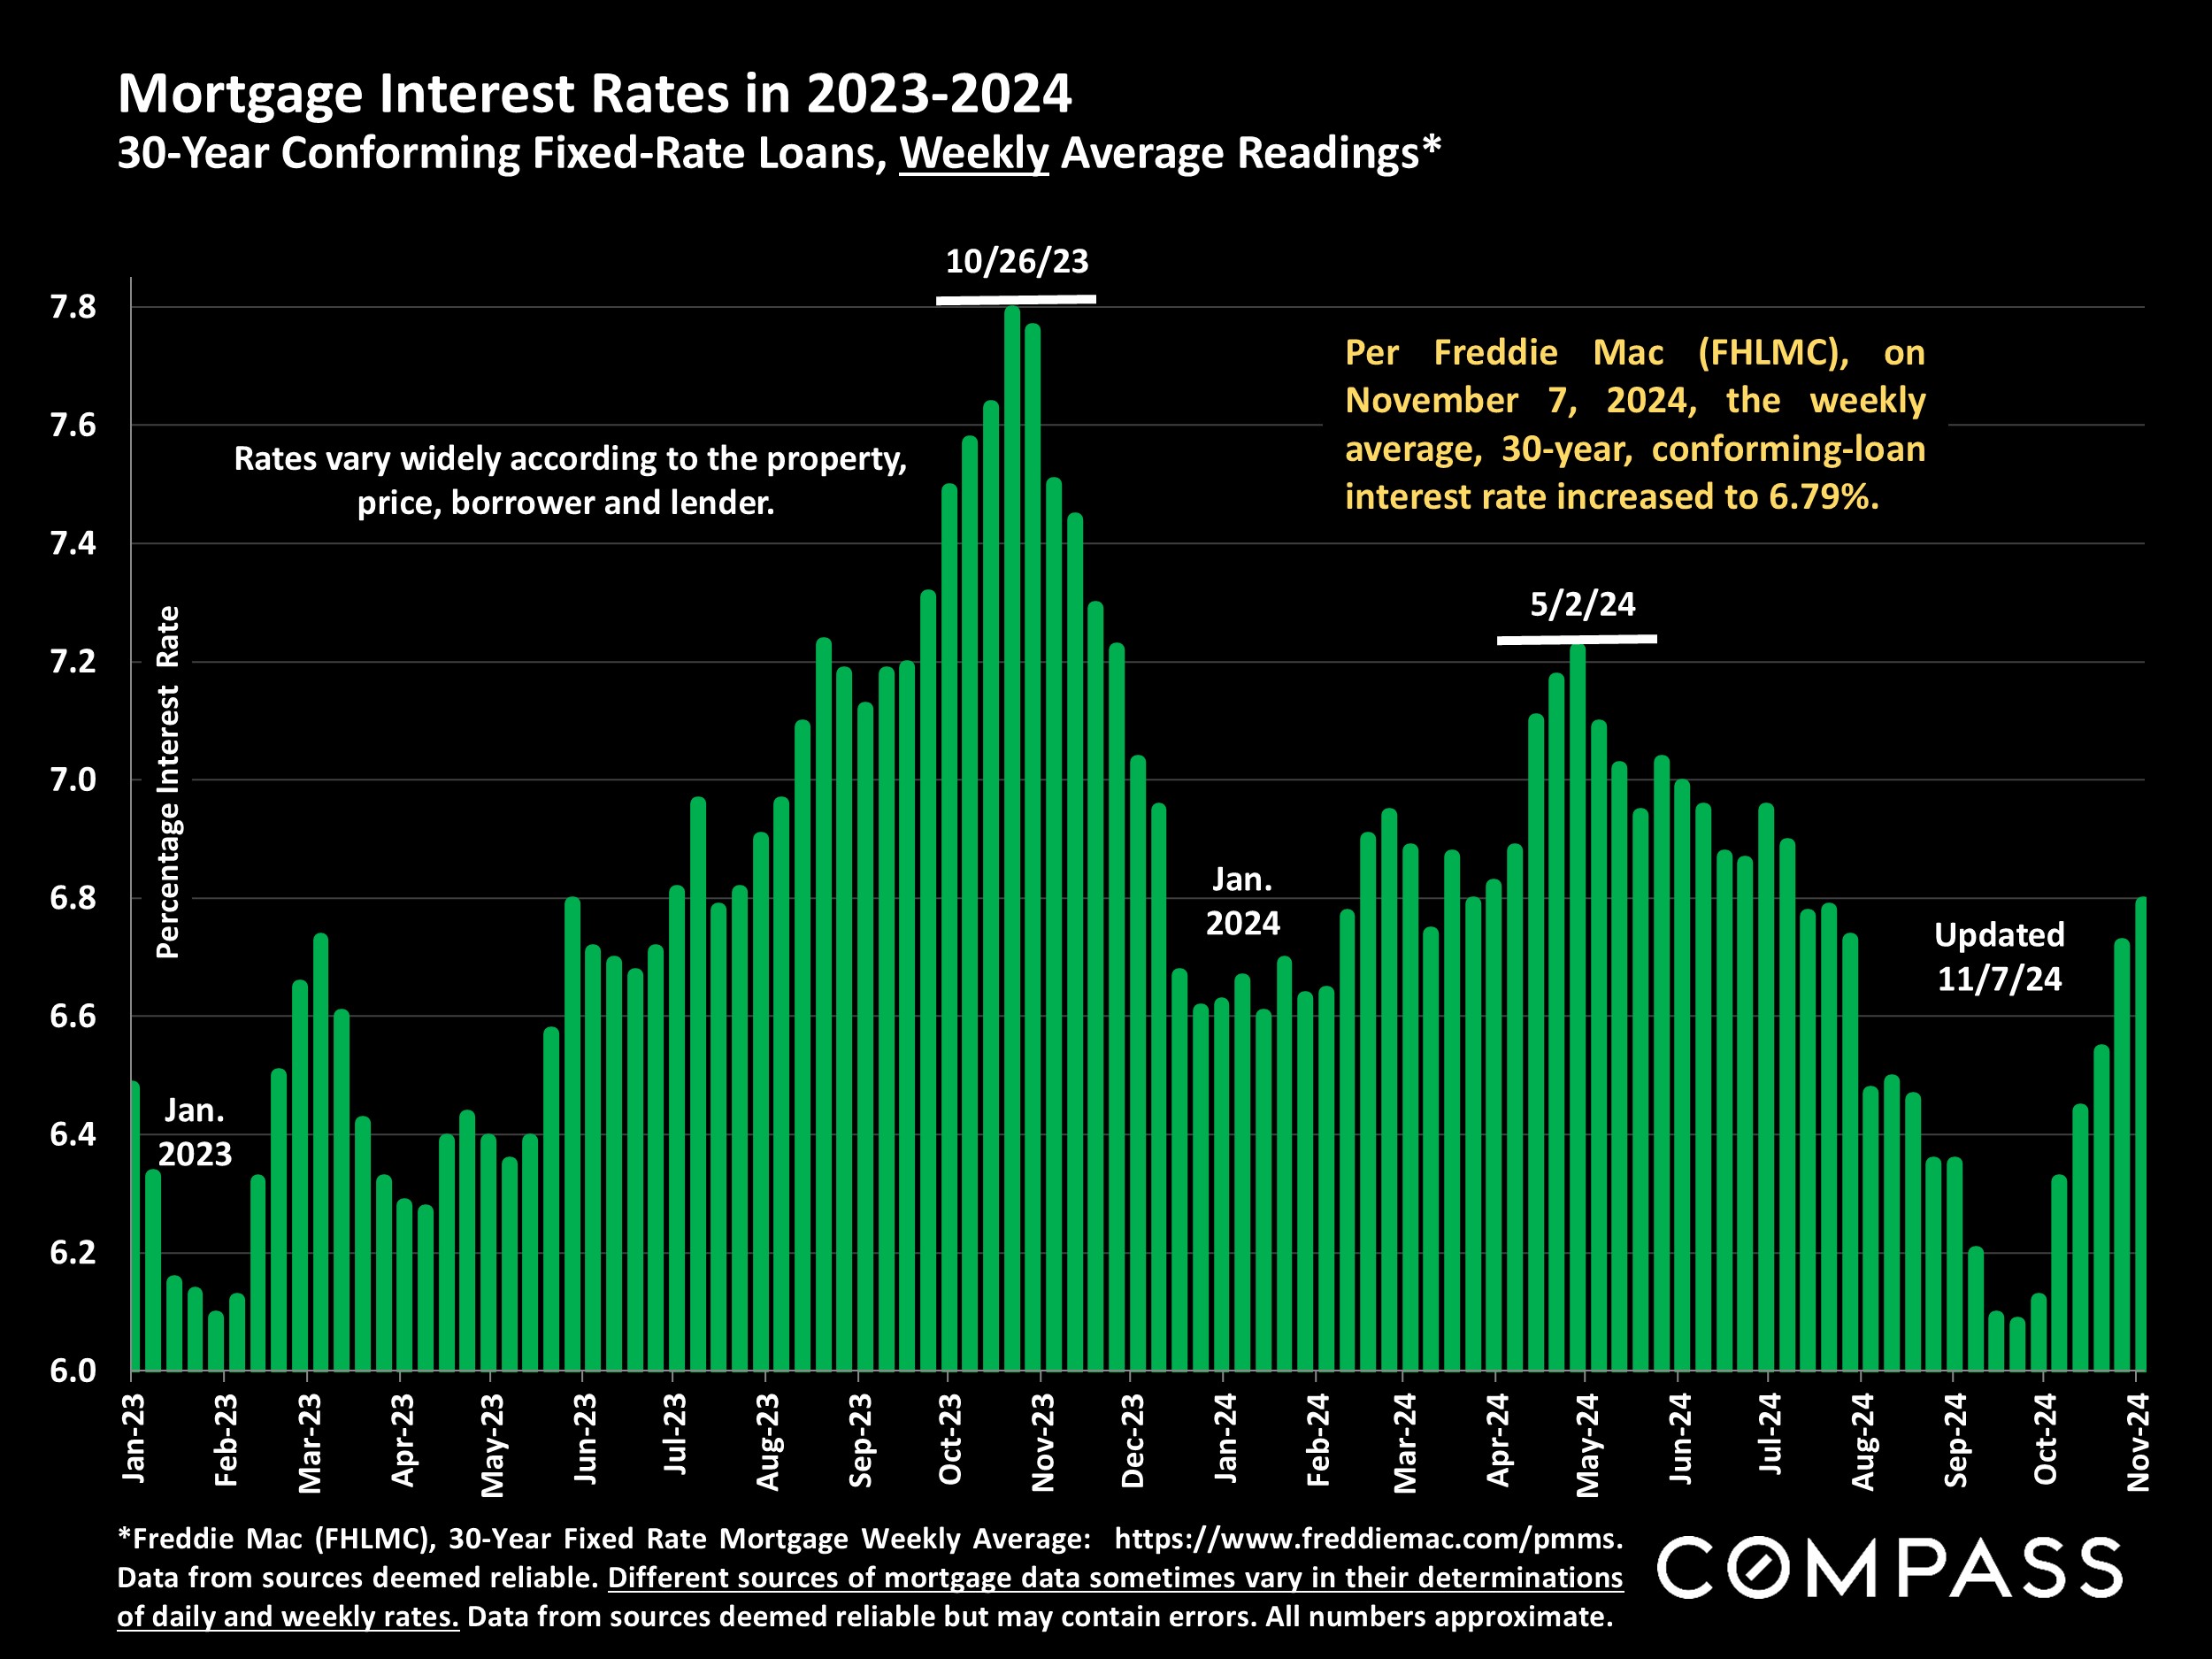
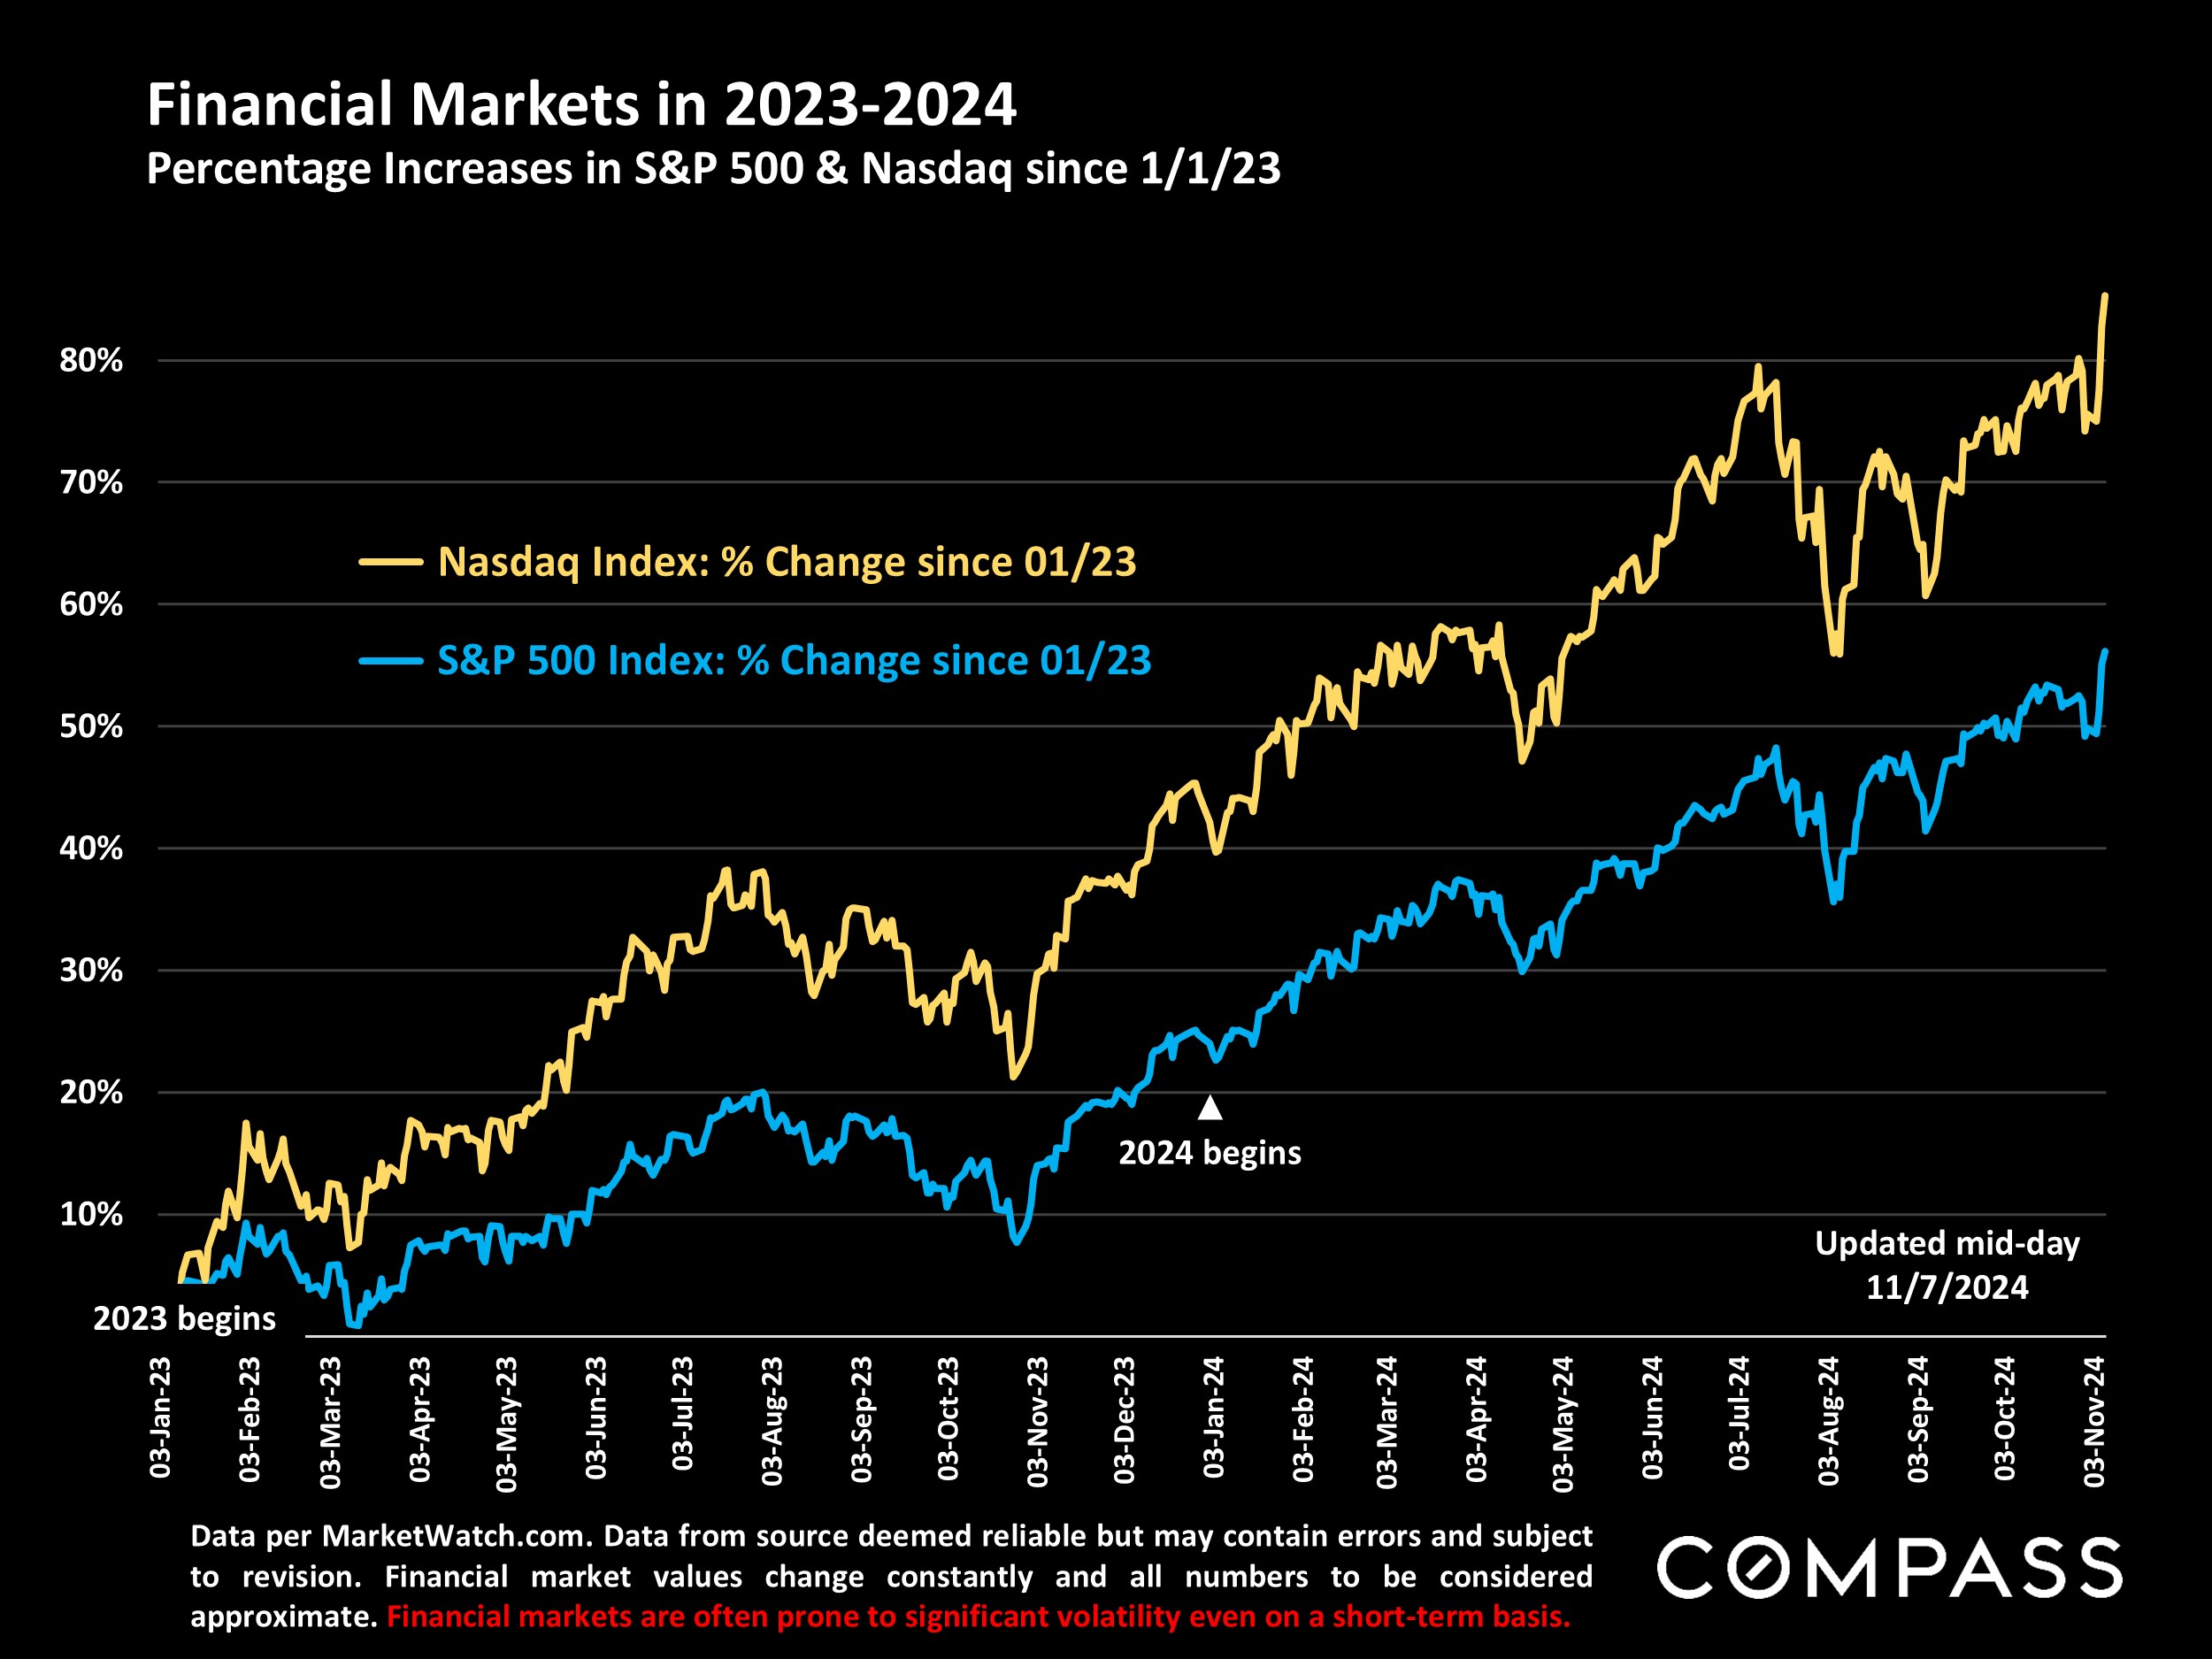
Interest rates continued to rise in October and early November, but, as of November 6th, all 3 major stock market indices were at record highs. These 2 financial indicators - the first one typically having negative implications for buyer demand, and the second one positive - may pull different market segments in different directions in the coming months.

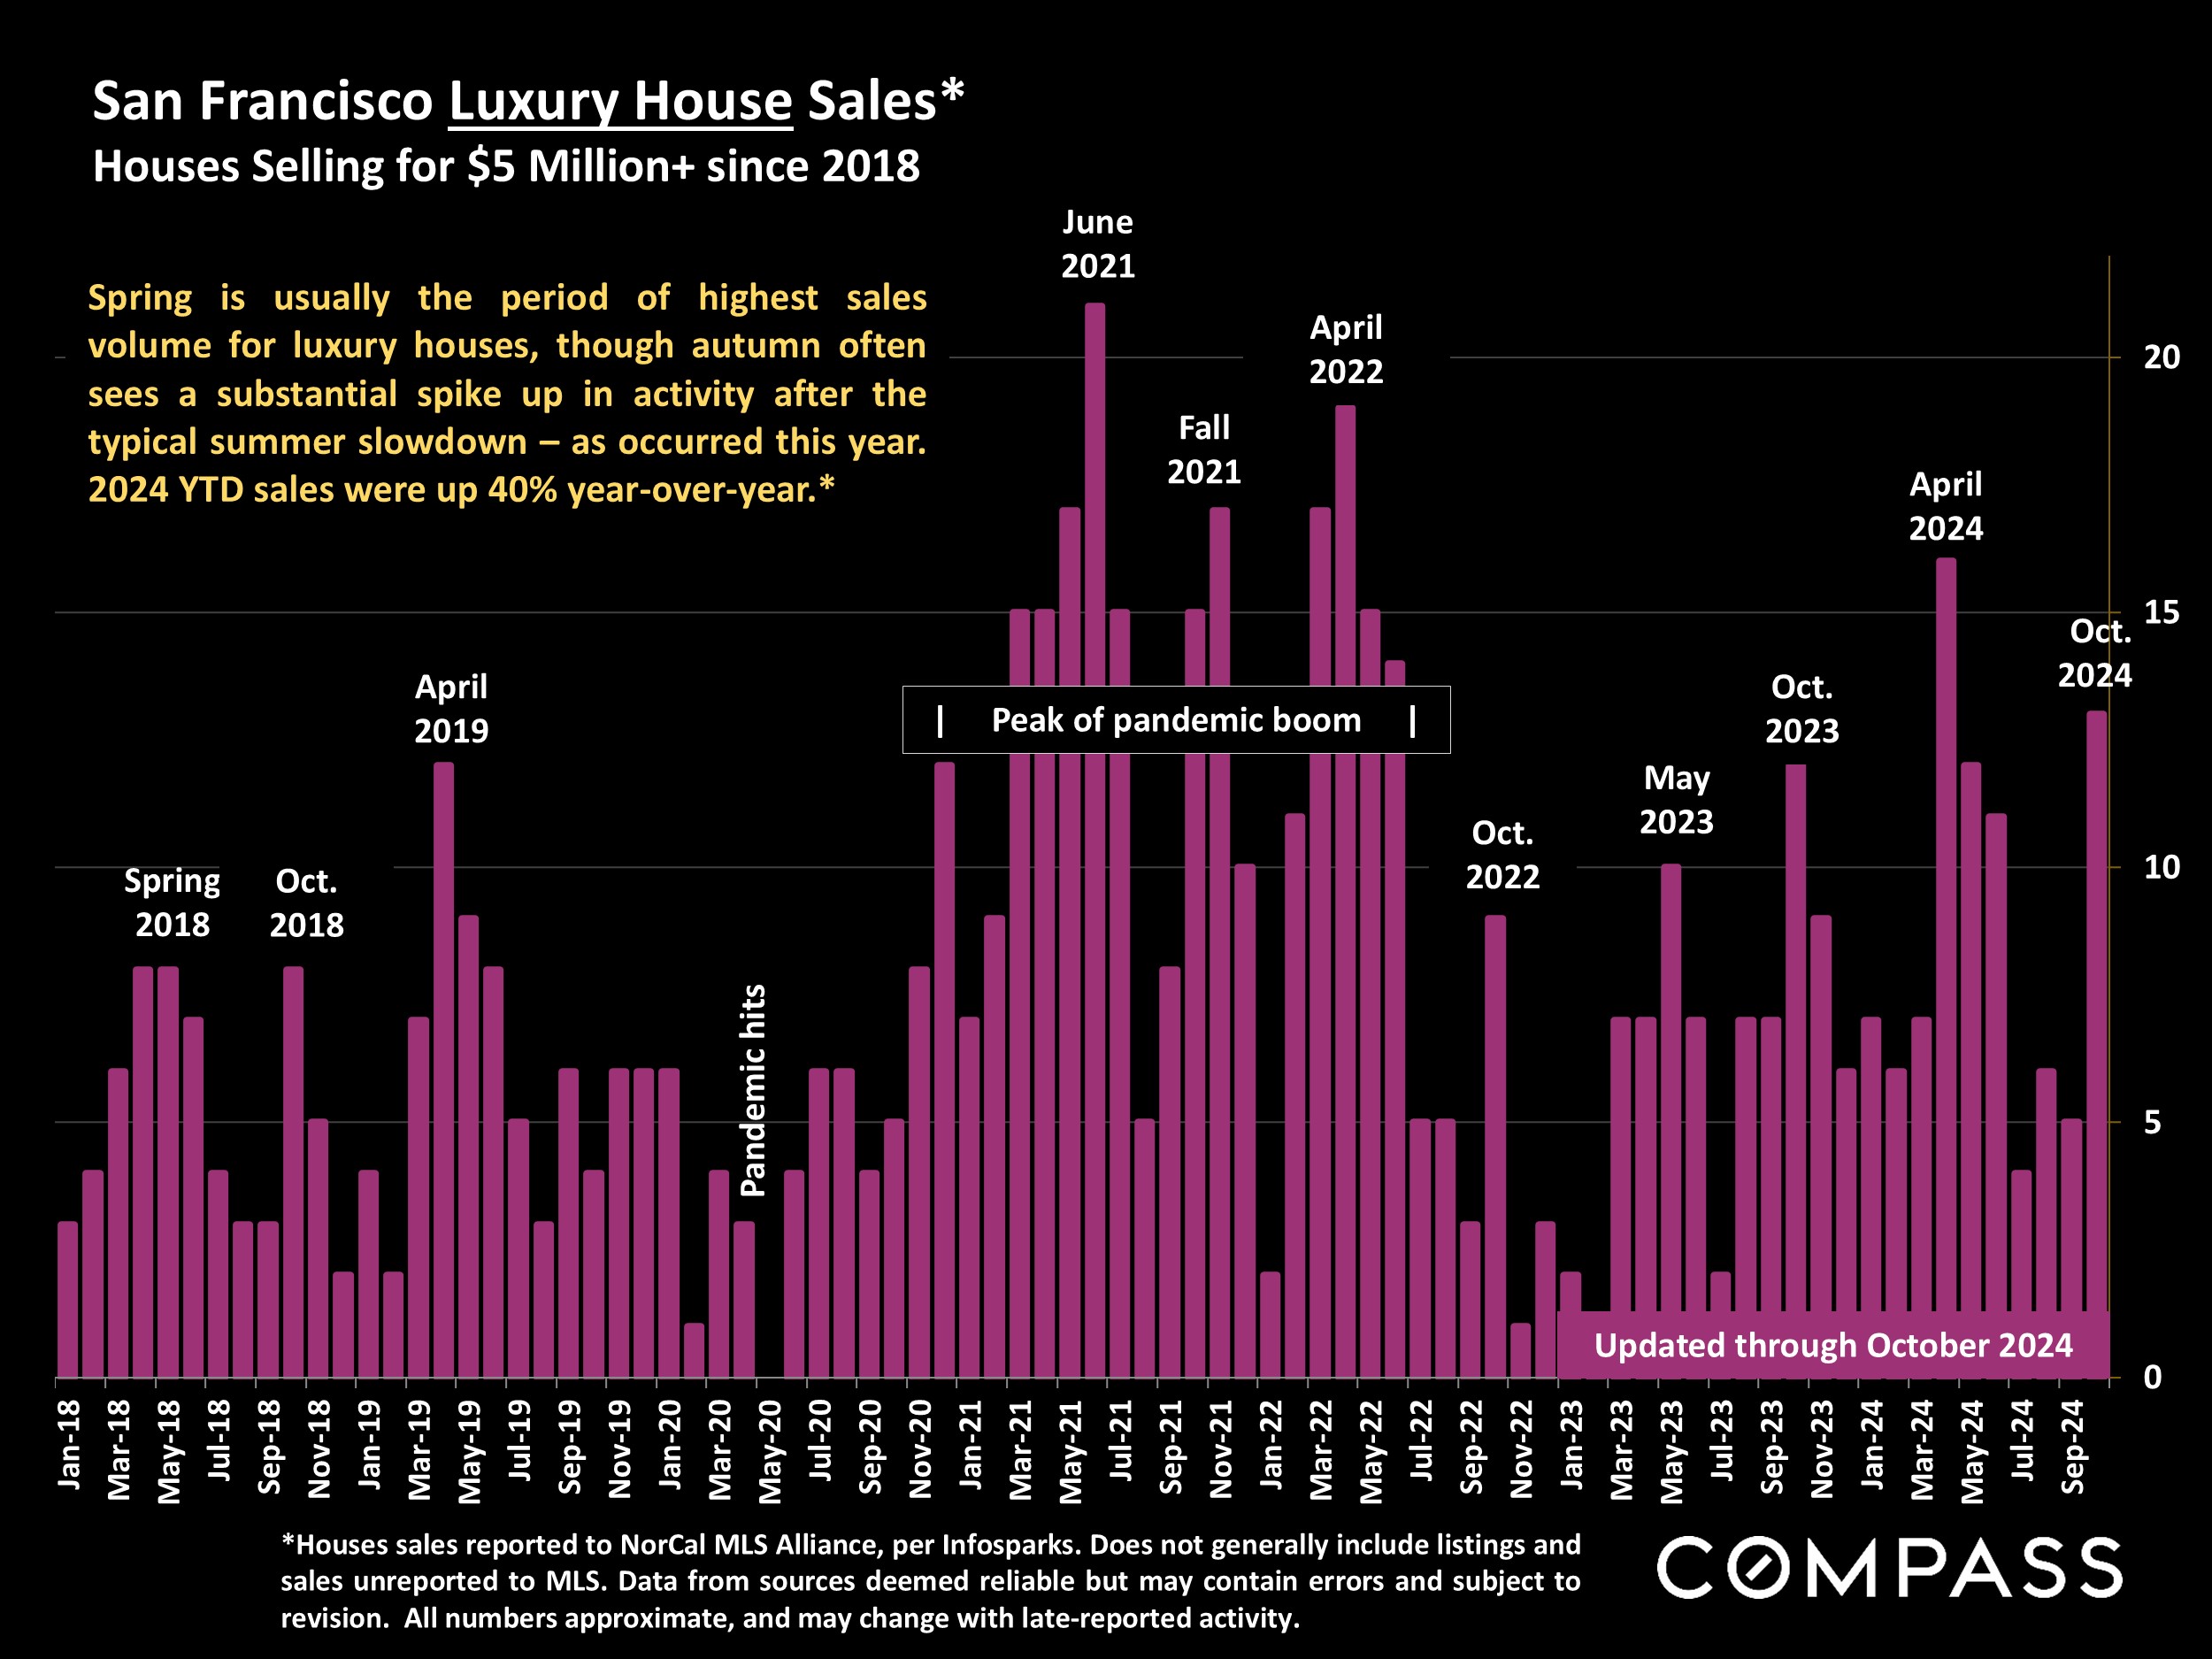
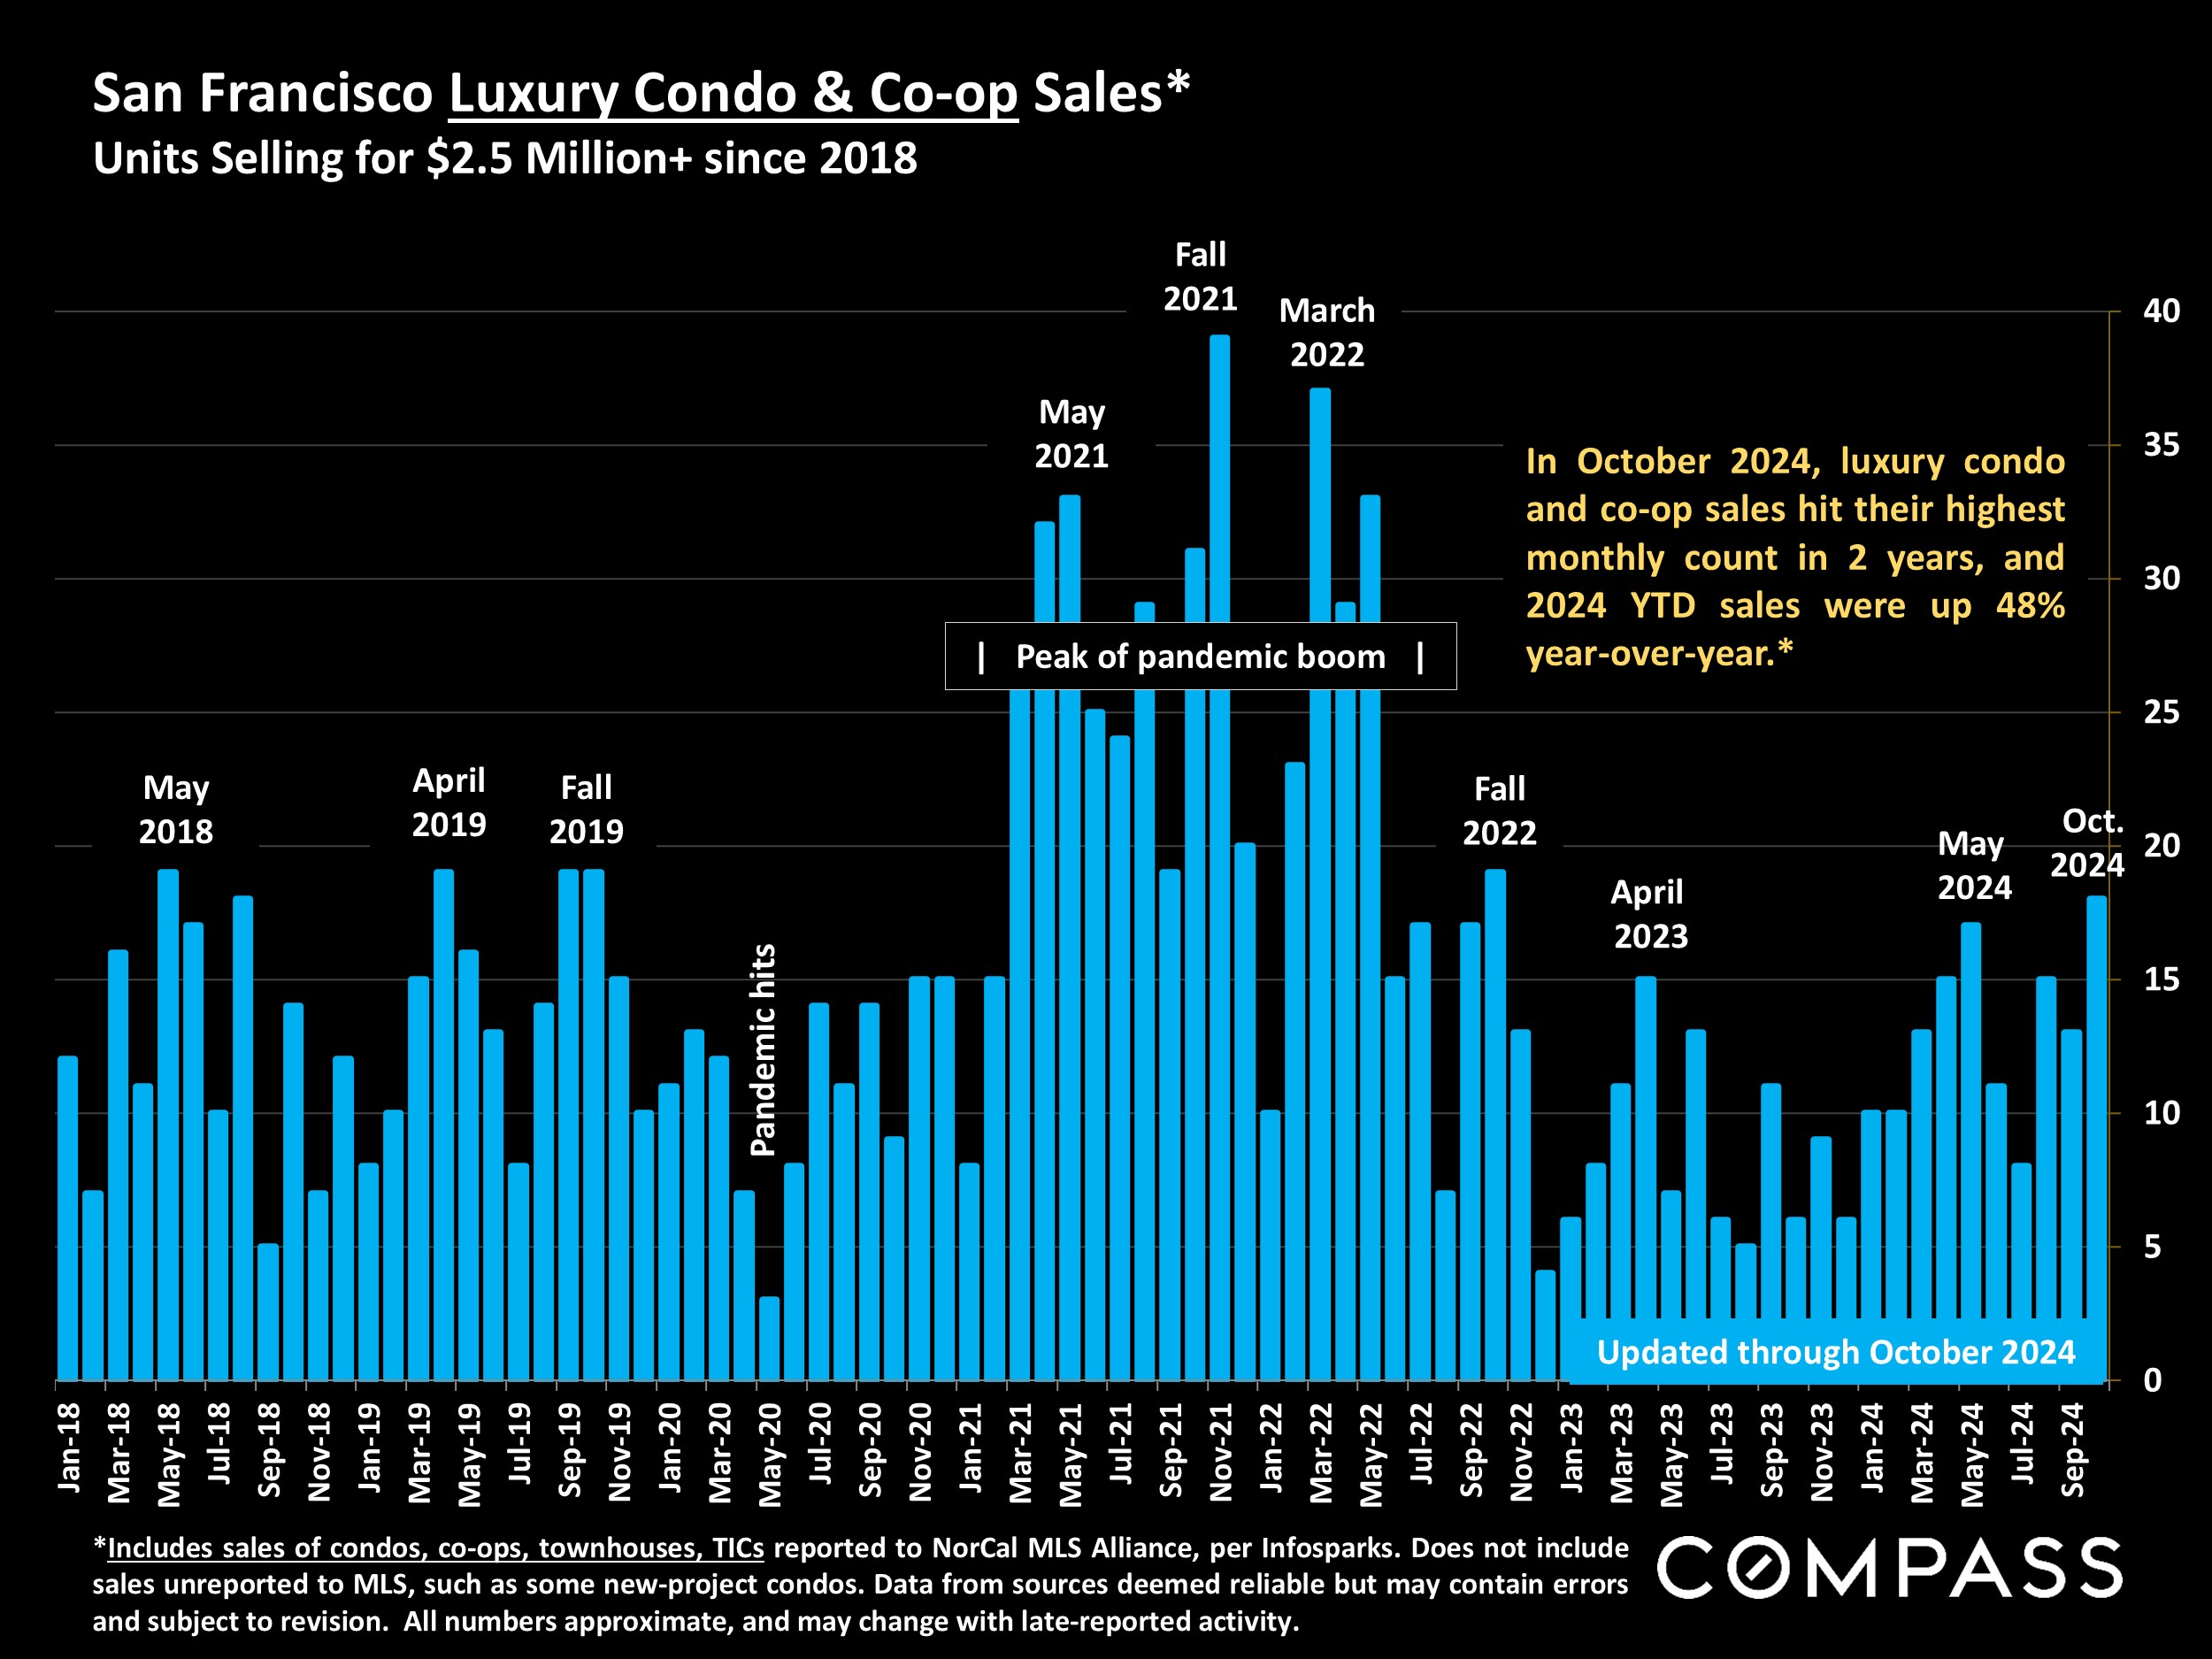
Luxury house and condo sales rebounded in October, and in 2024 year-to-date sales of luxury houses ($5 million+) were up 40%, and luxury condo and co-op sales ($2.5 million+) were up 48%. Possibly reflecting 2024's soaring stock markets, increases in luxury home sales have far outperformed the overall market this year.

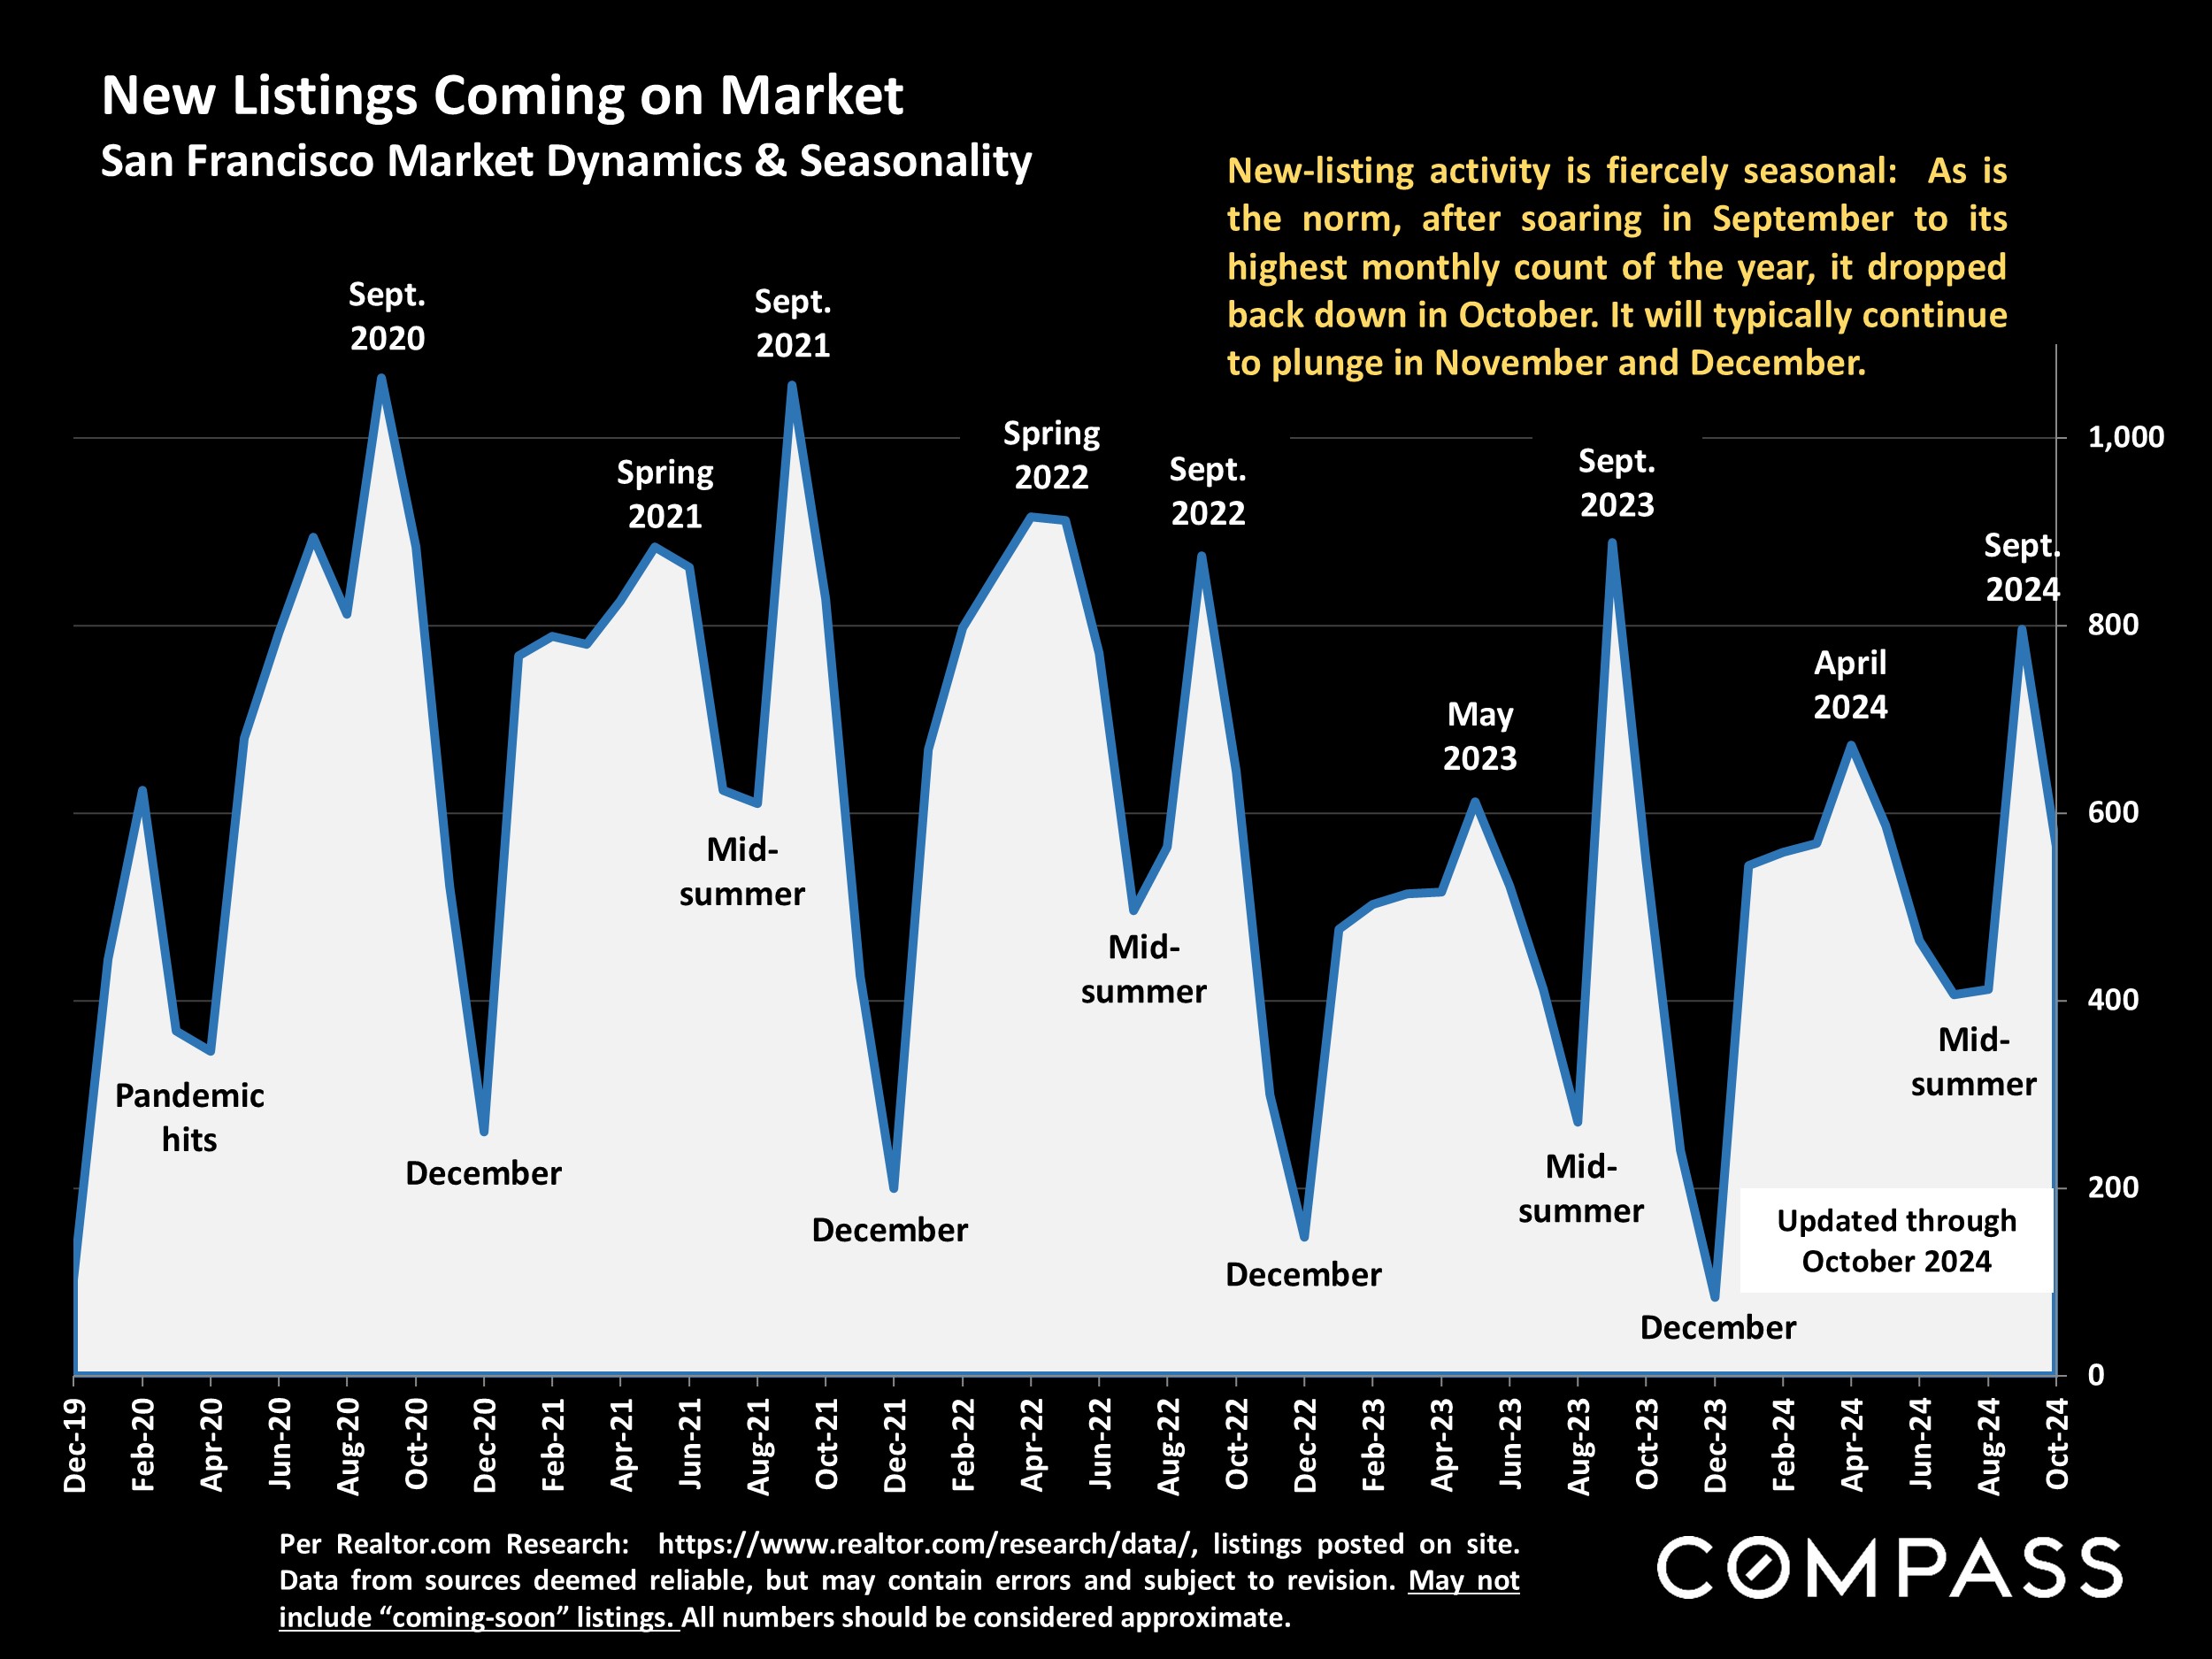
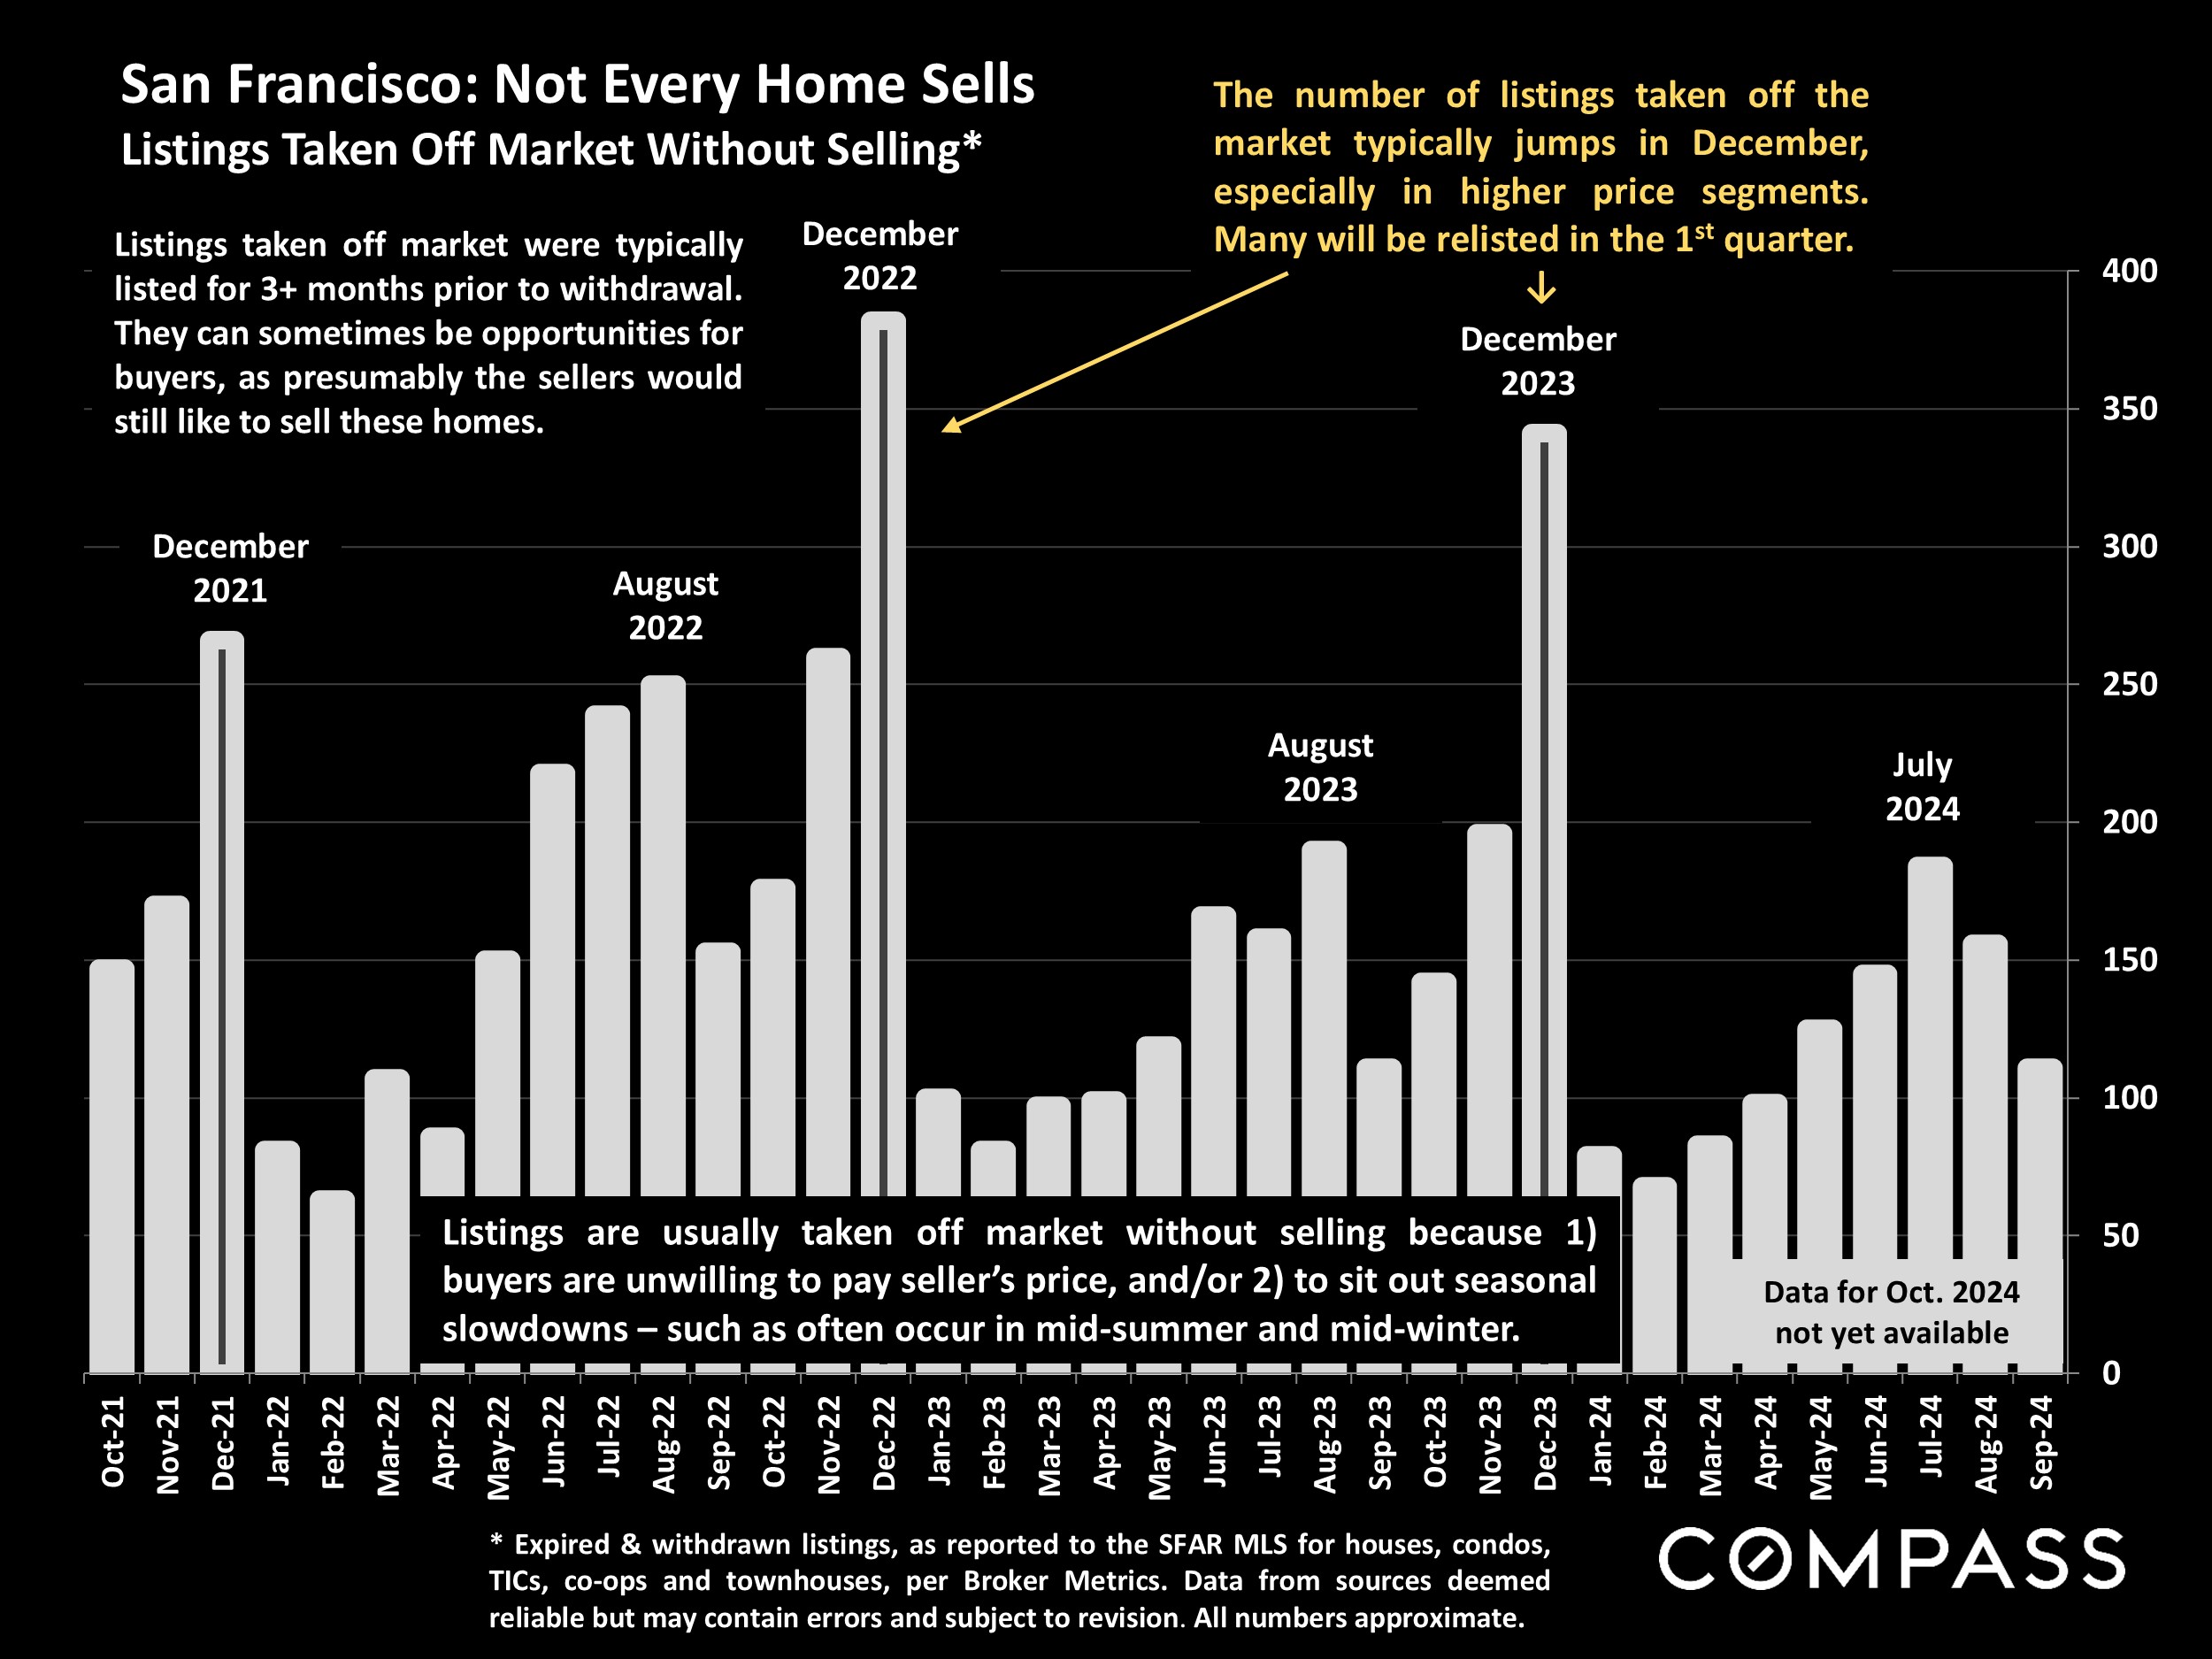
Listing and sales activity, as well as virtually all the standard metrics of demand, typically cool dramatically in November and December, and the number of unsold listings taken off the market usually jumps, especially in higher price segments. Still, the next 2 months can be an excellent time for buyers to negotiate more aggressively to make some of the best deals of the year.

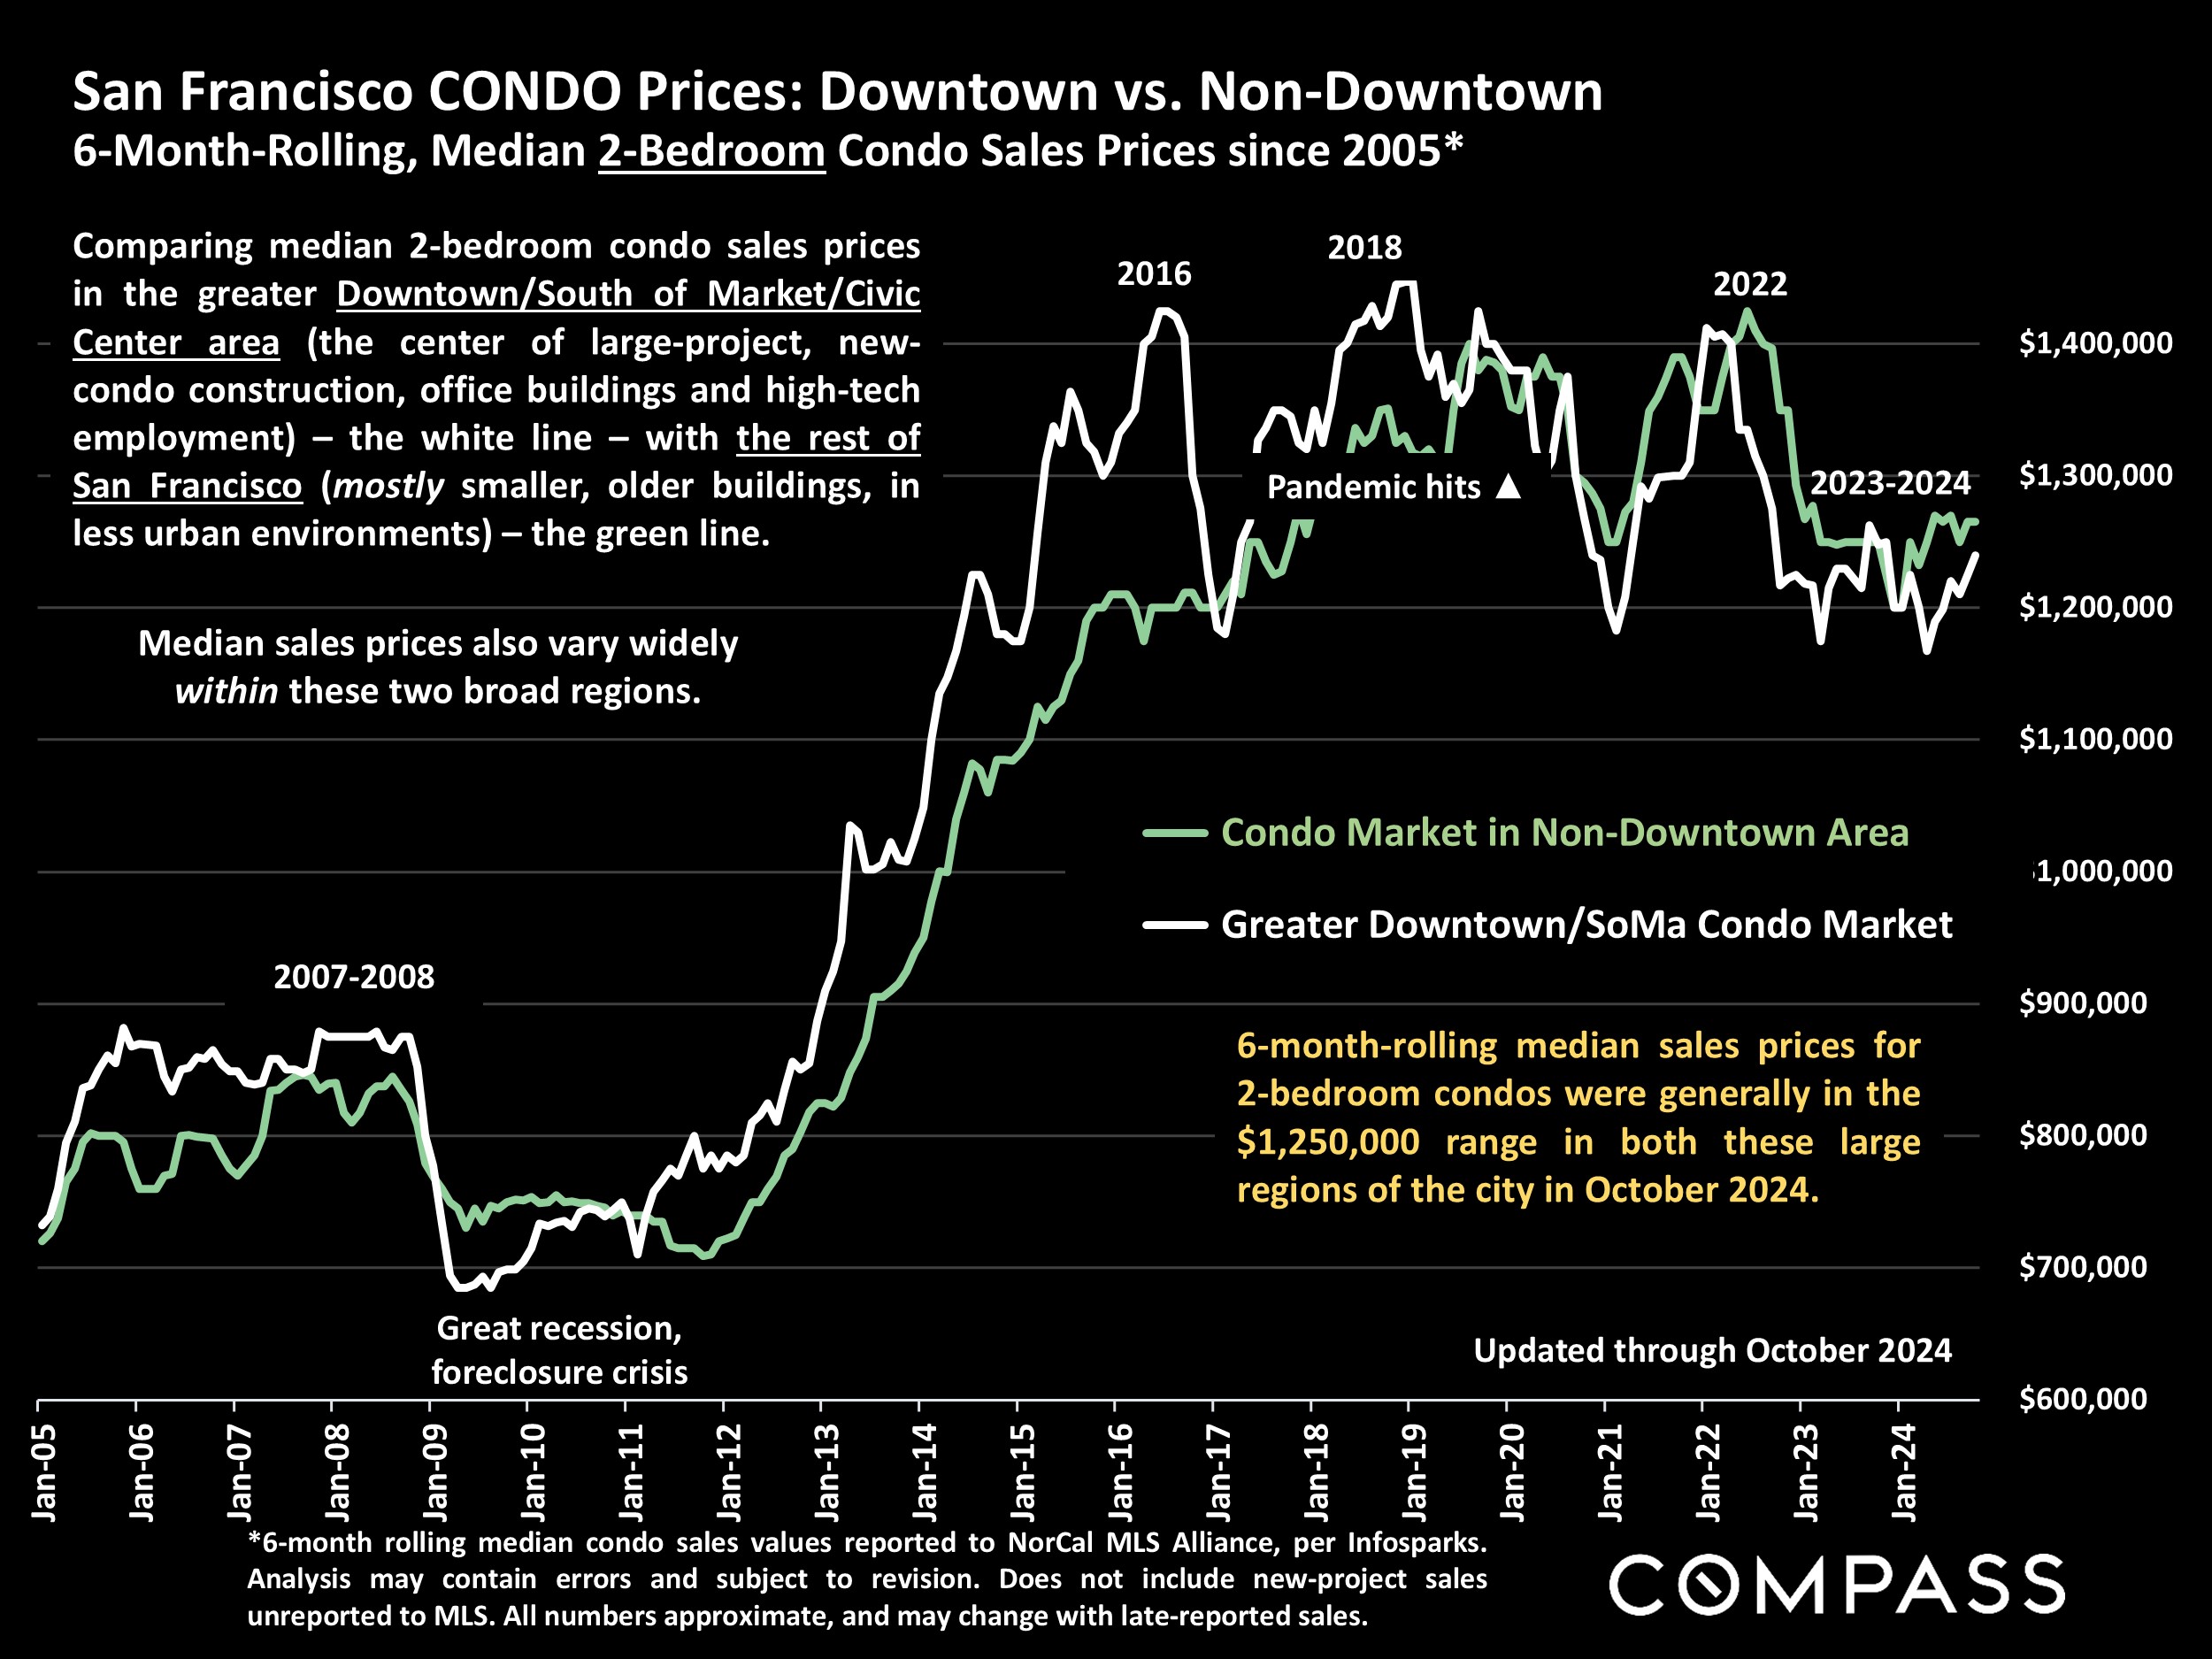
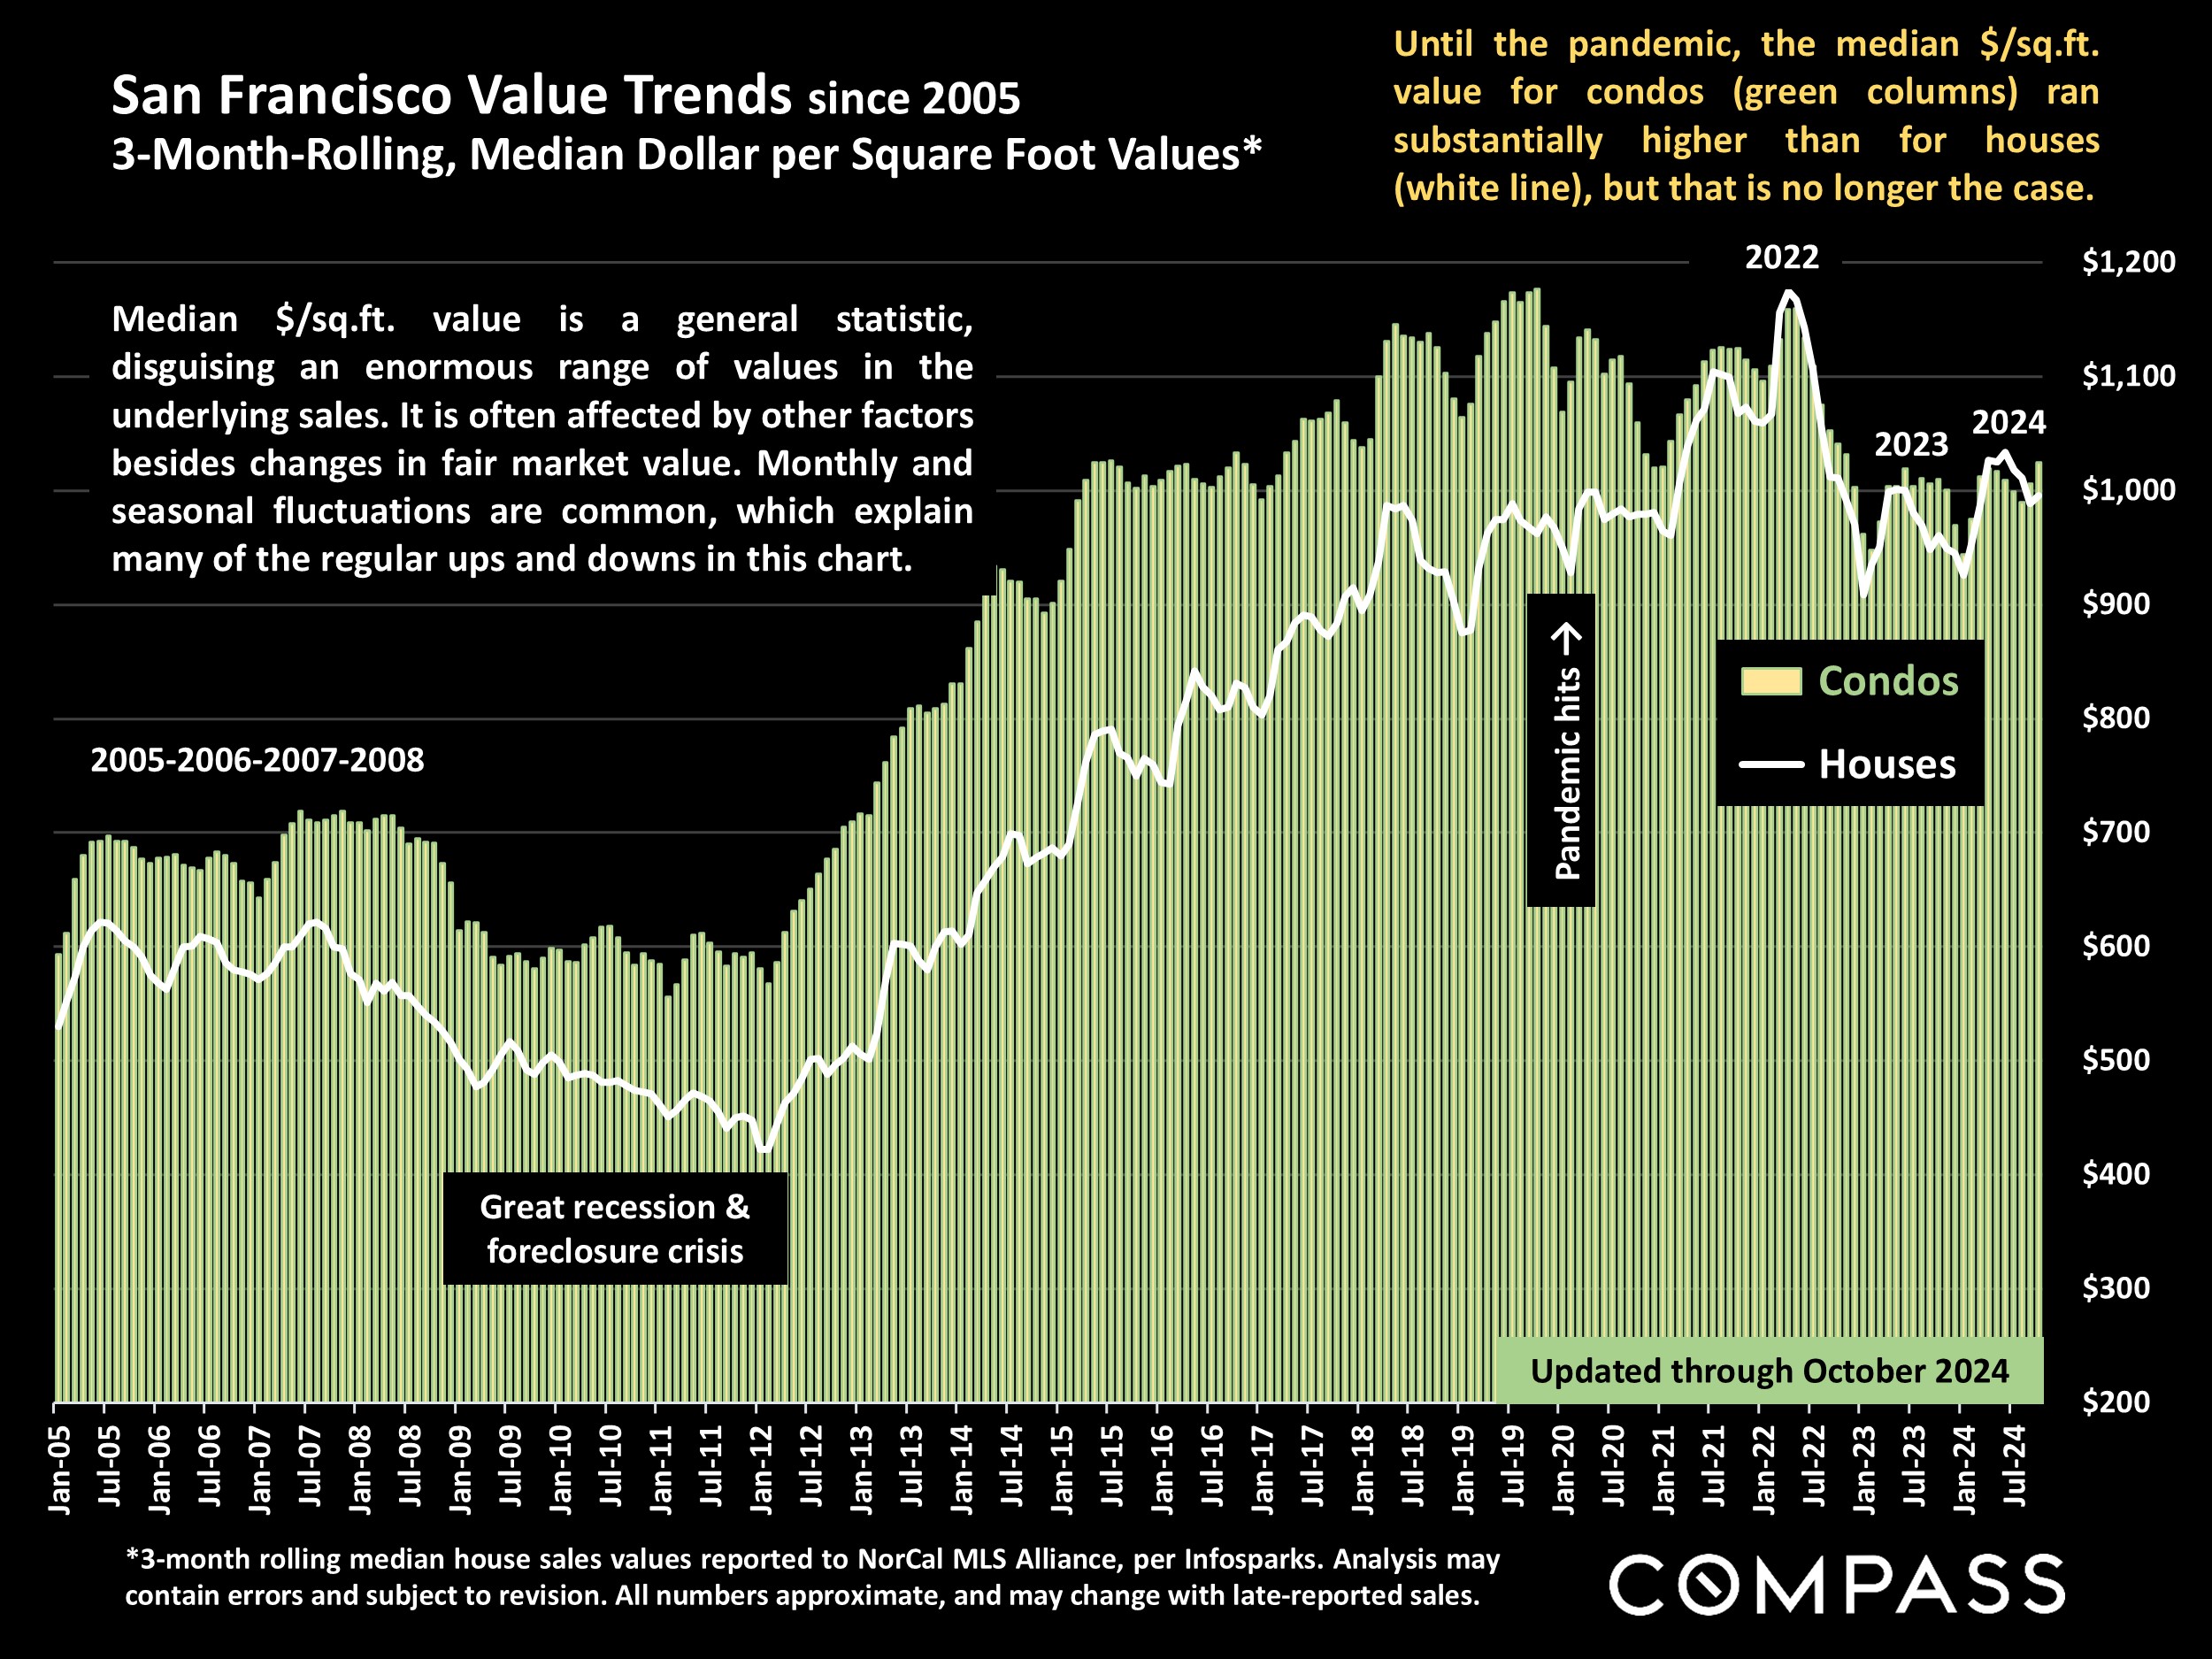
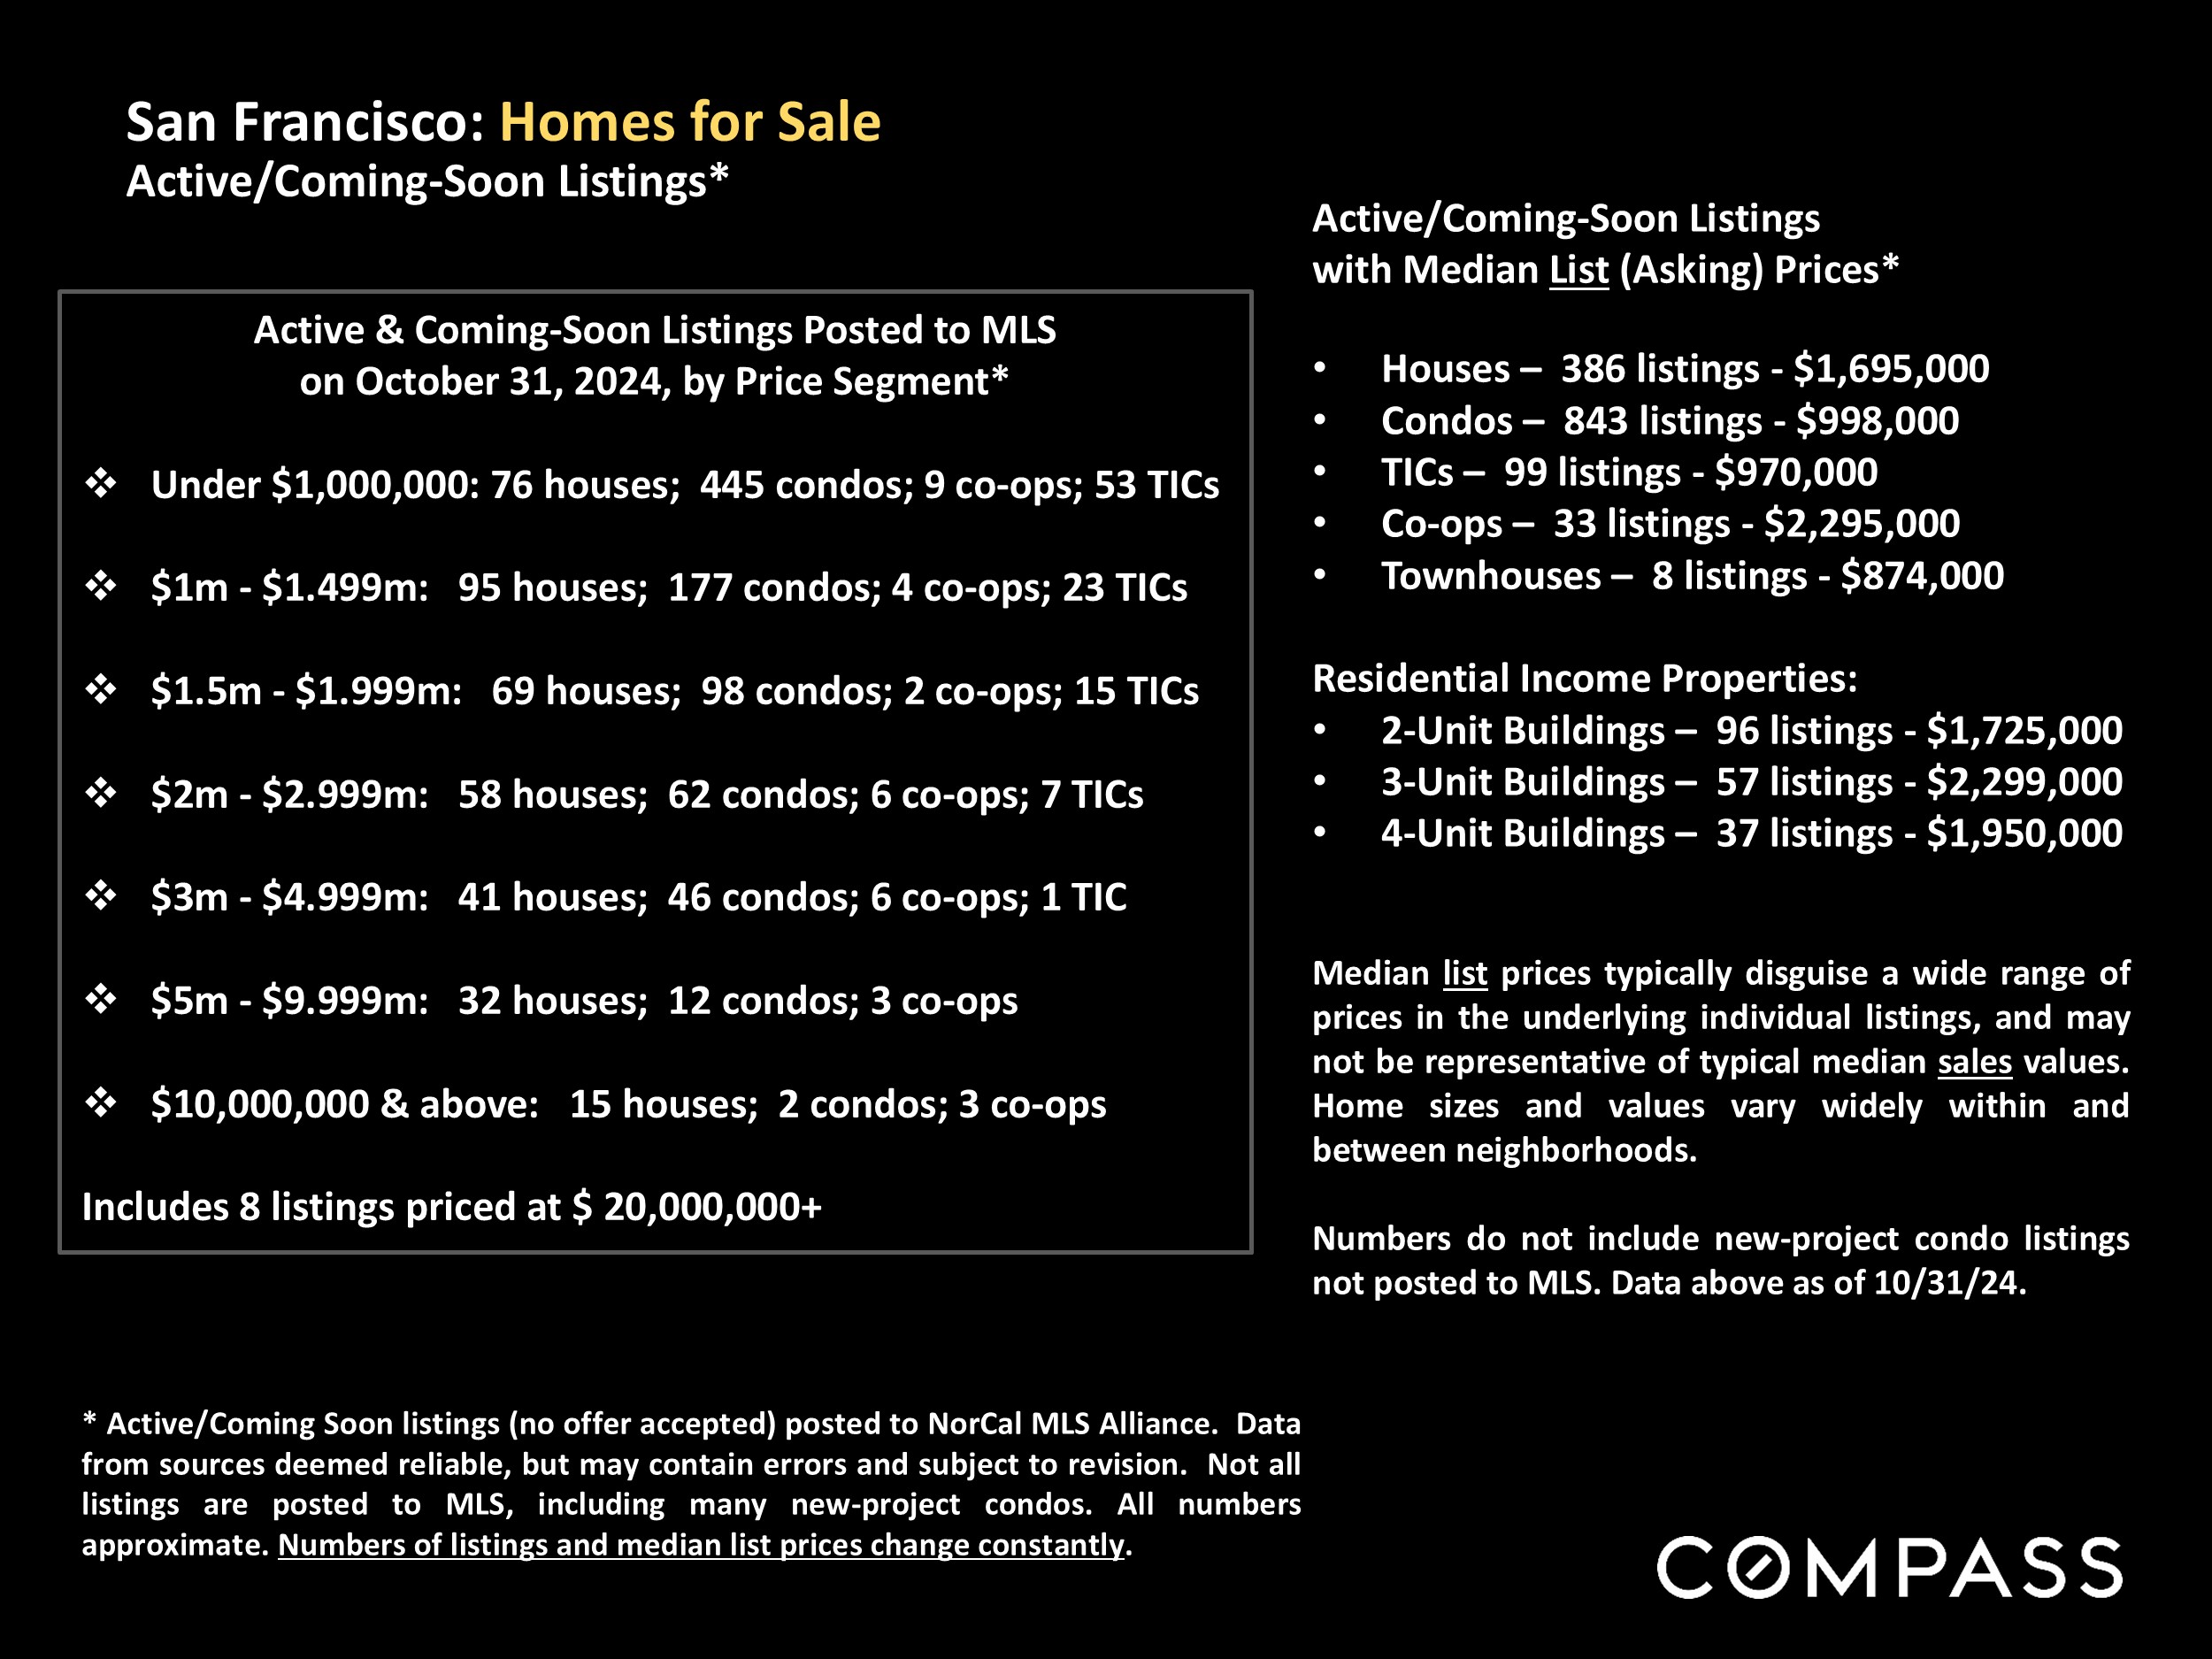
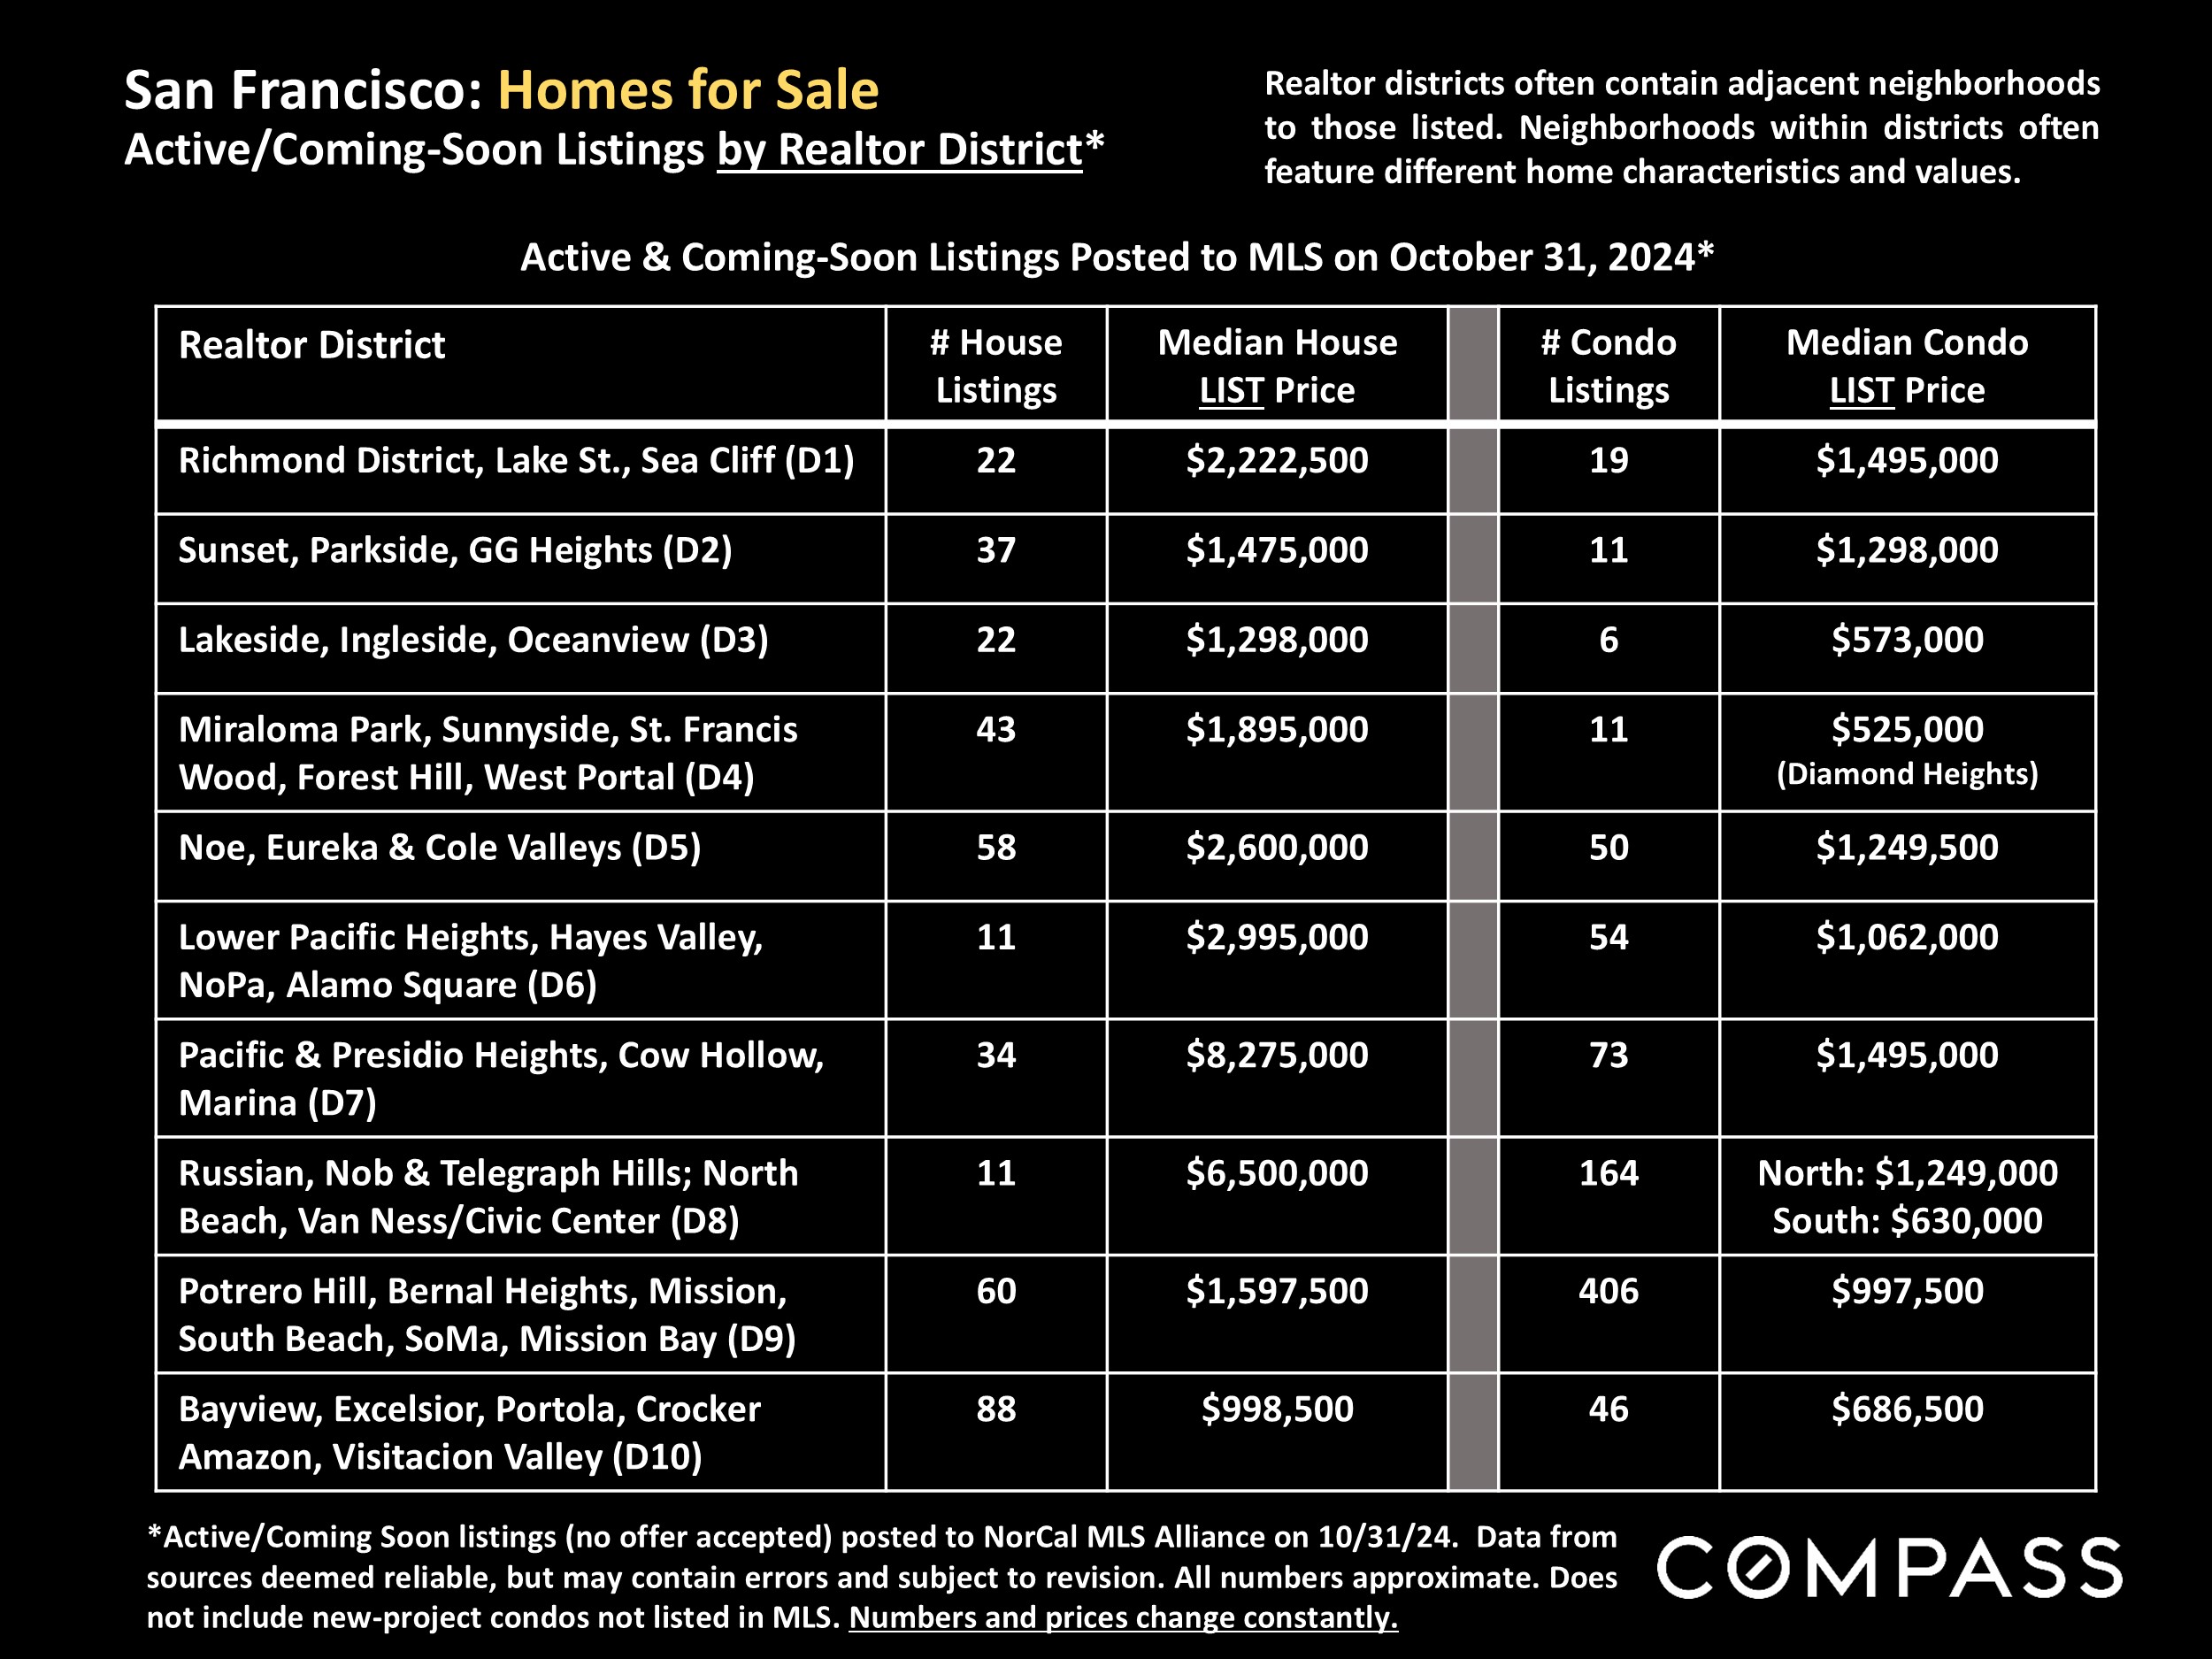
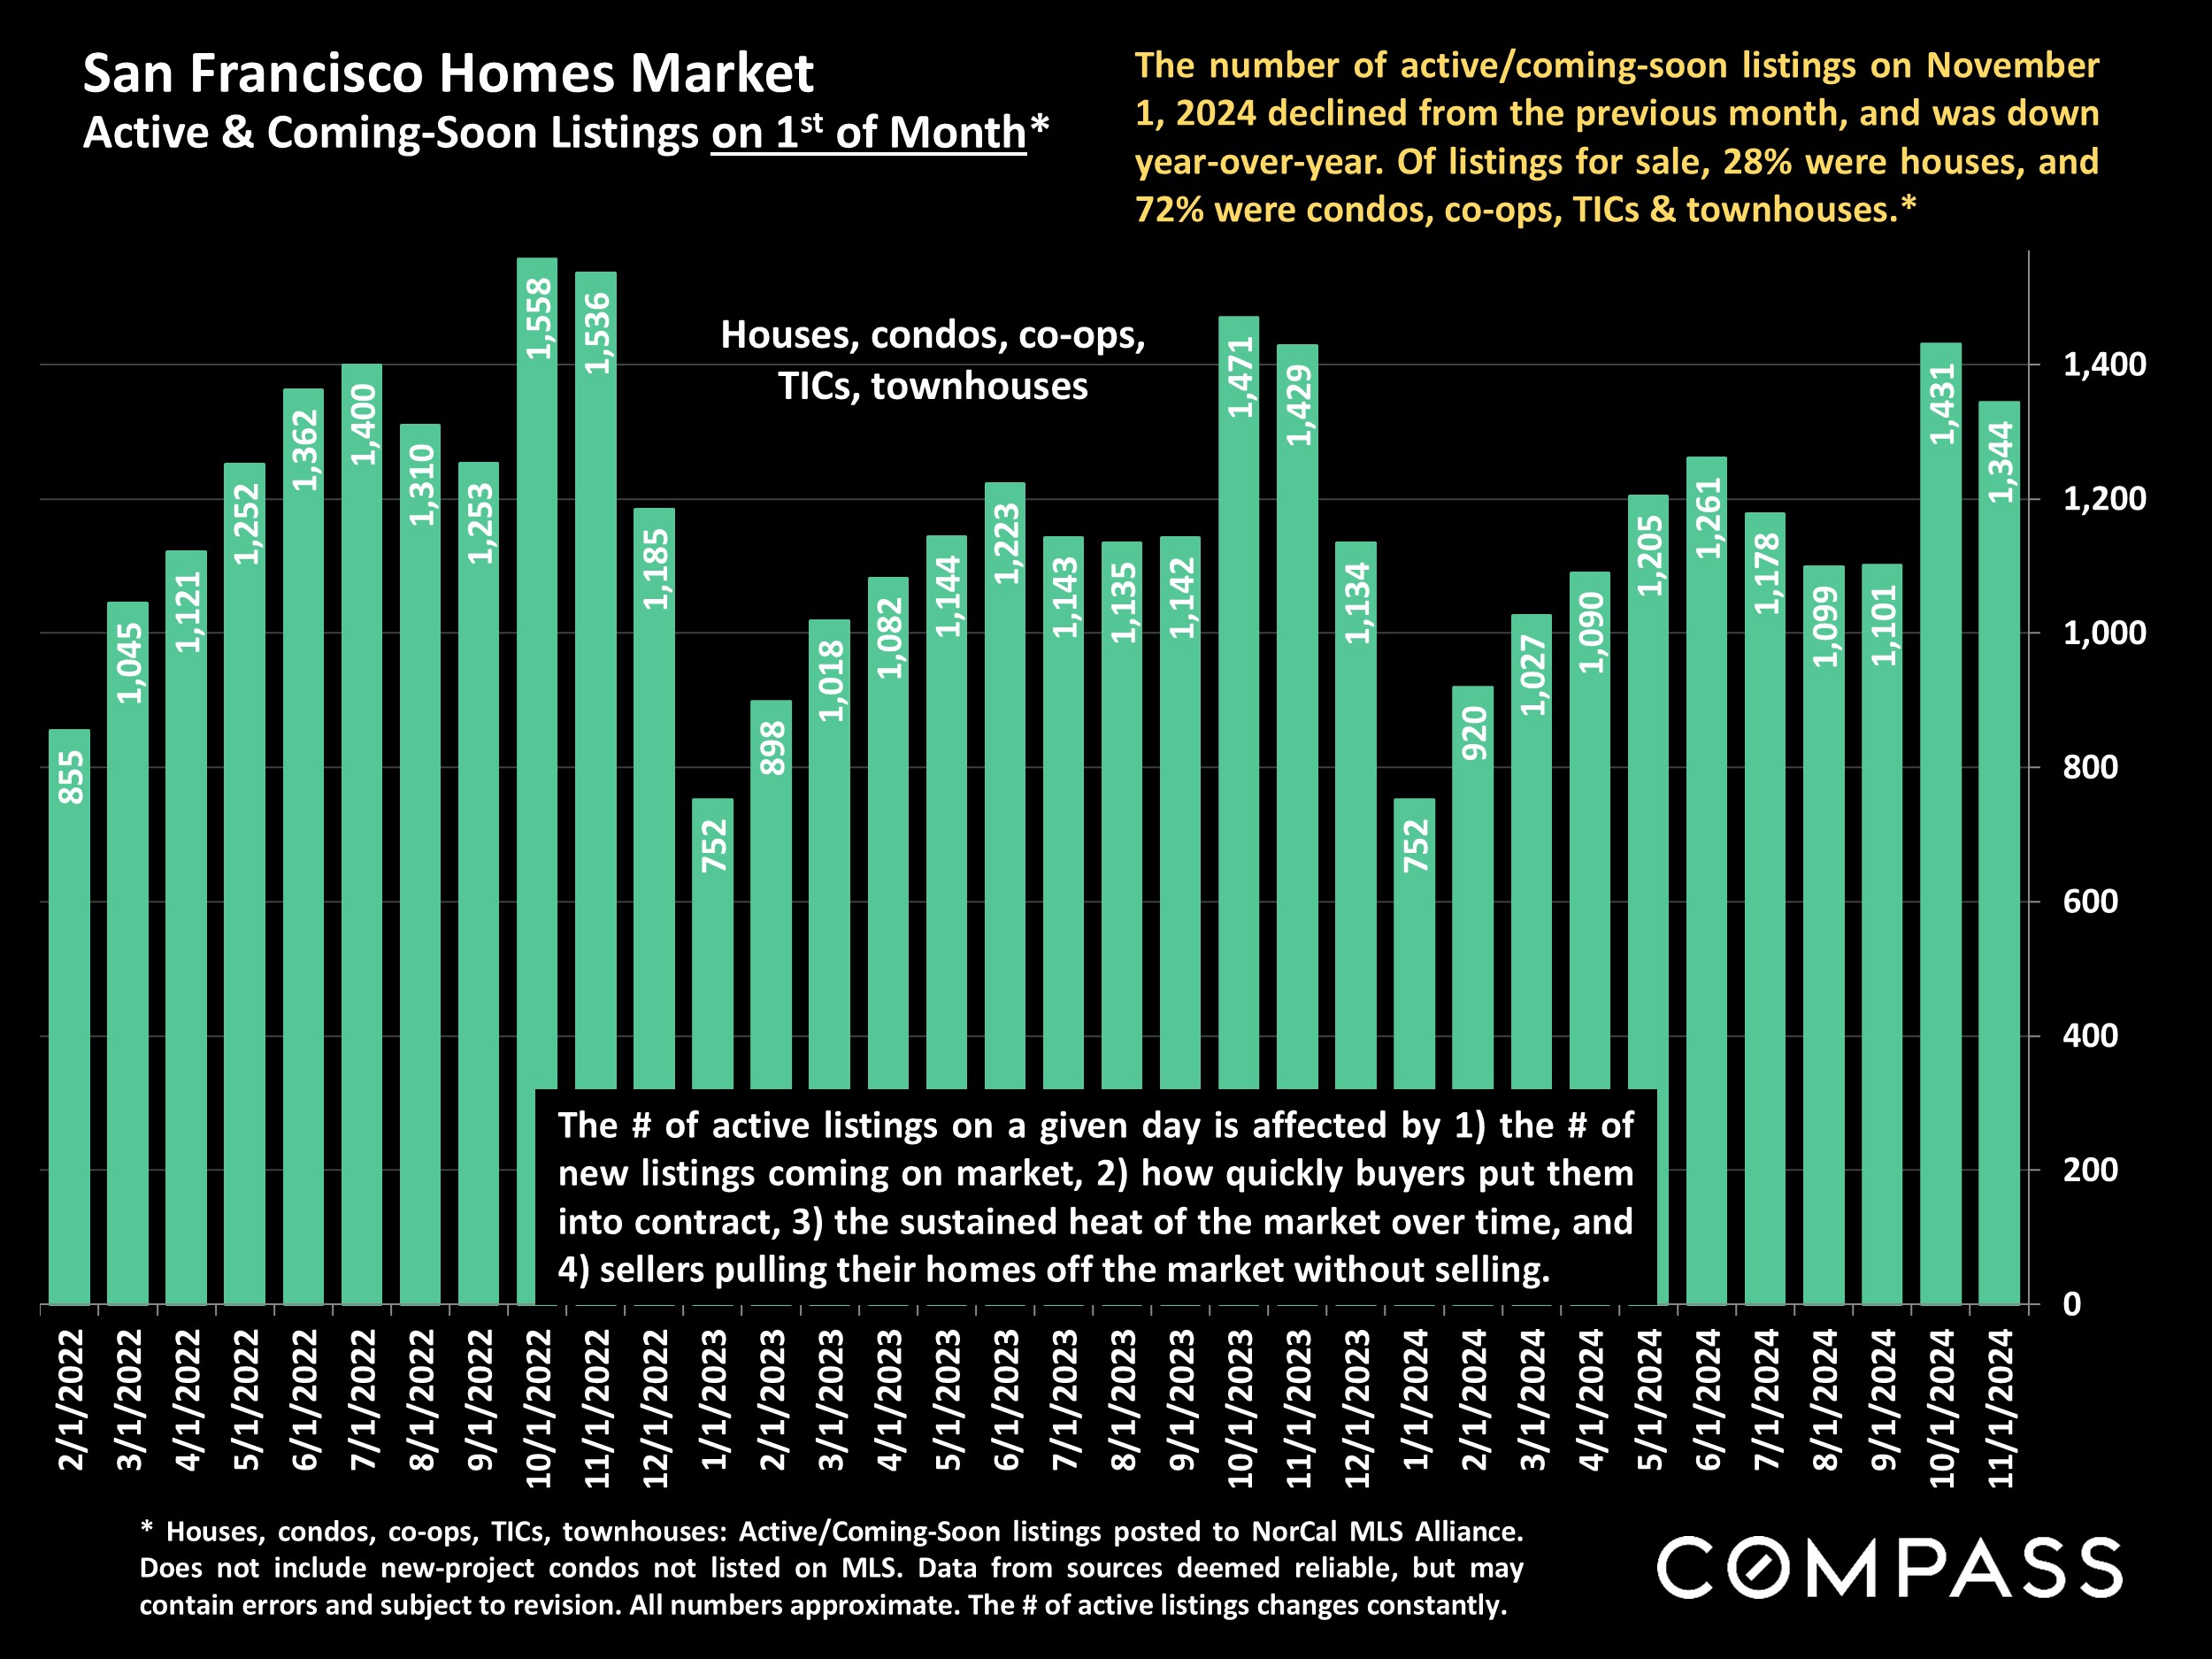
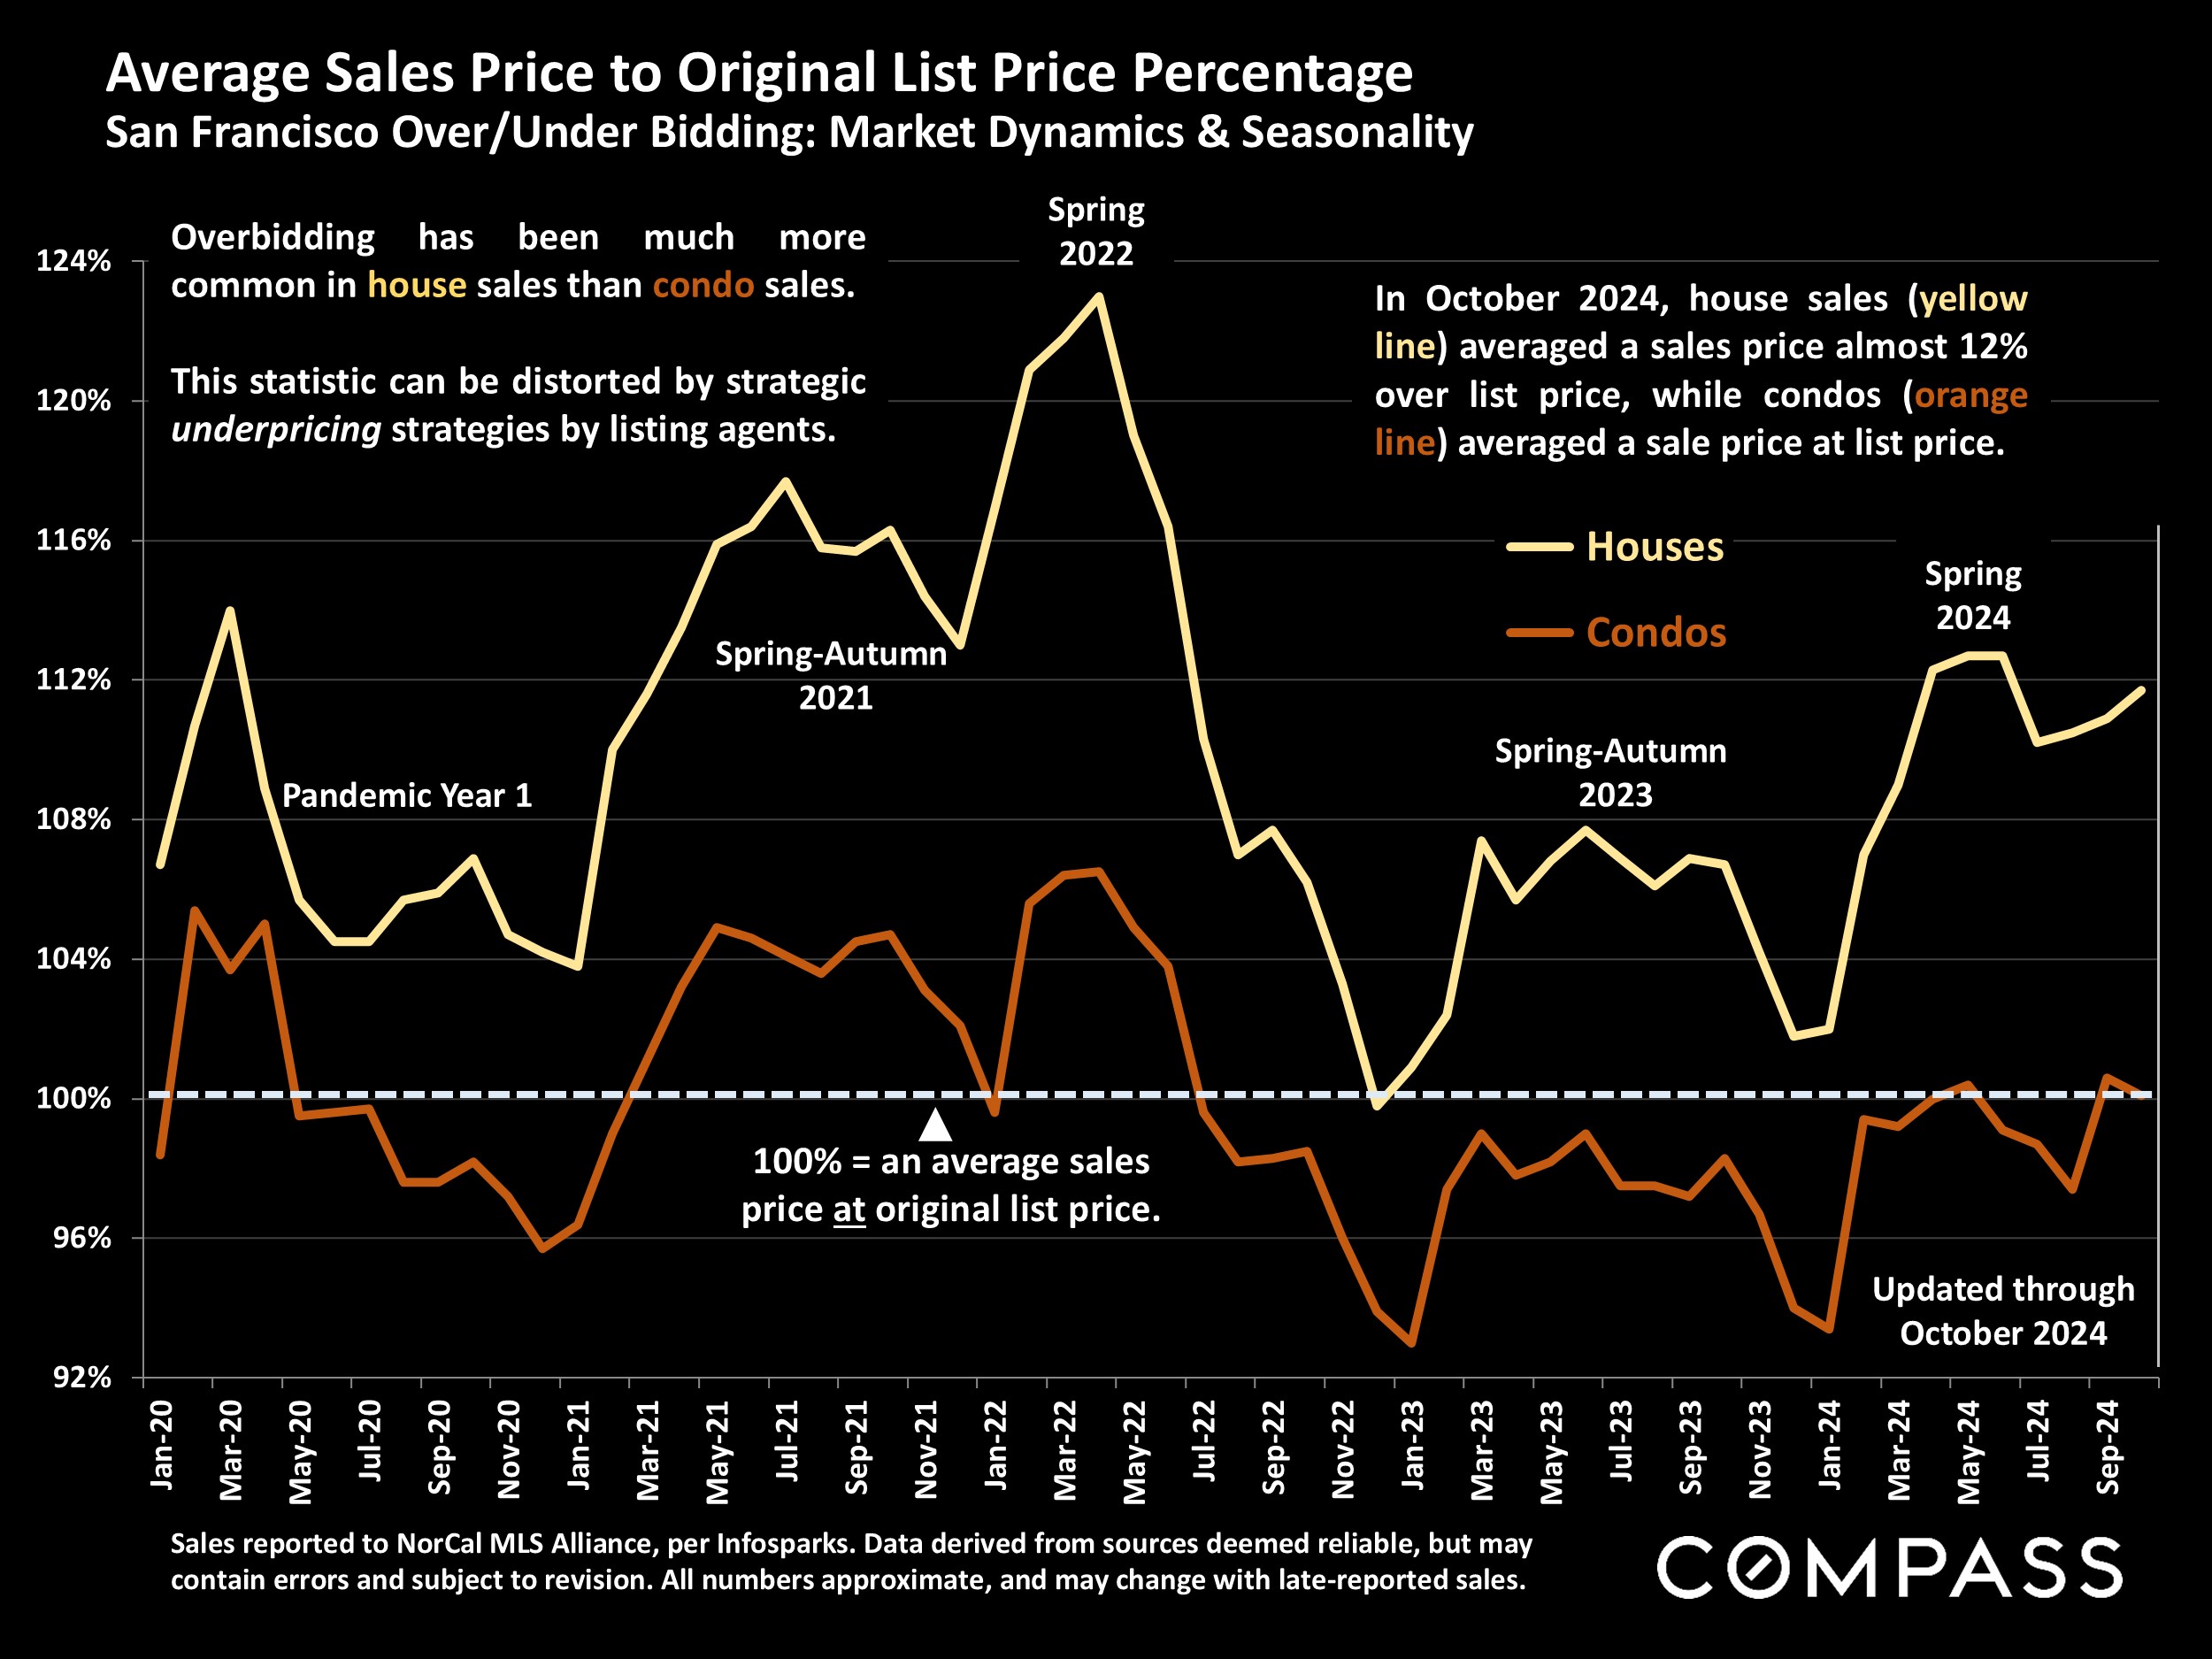
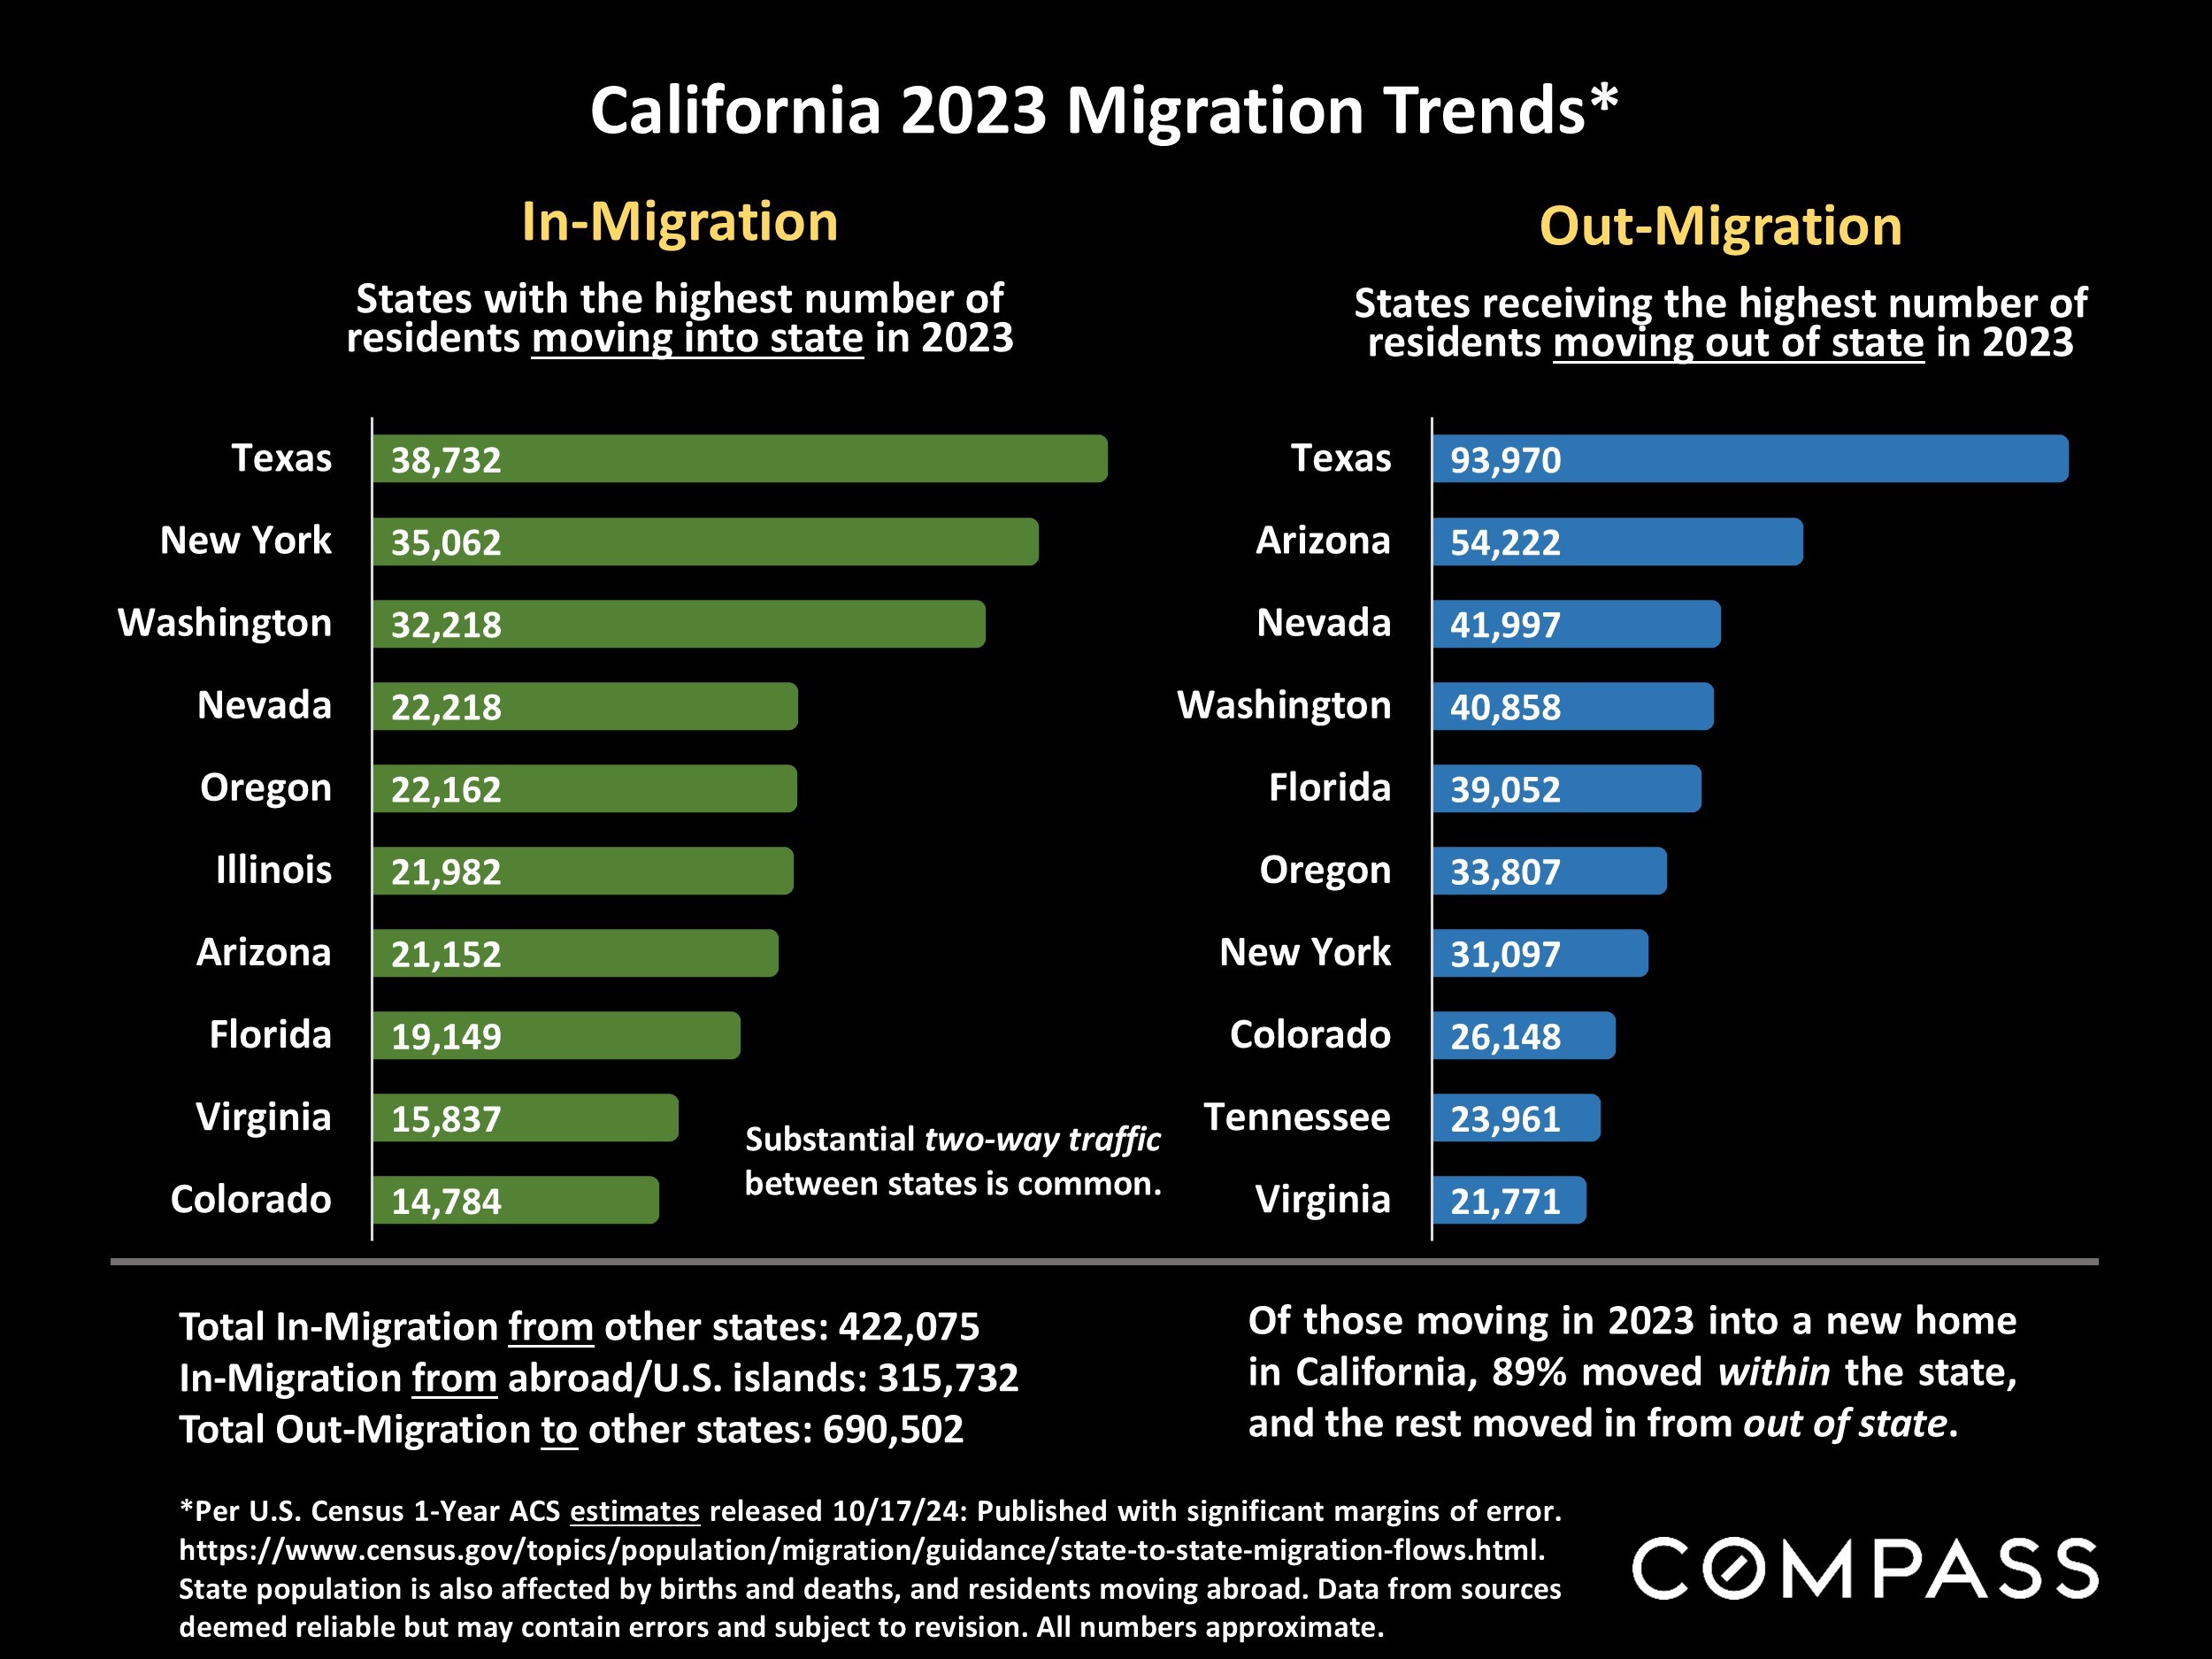
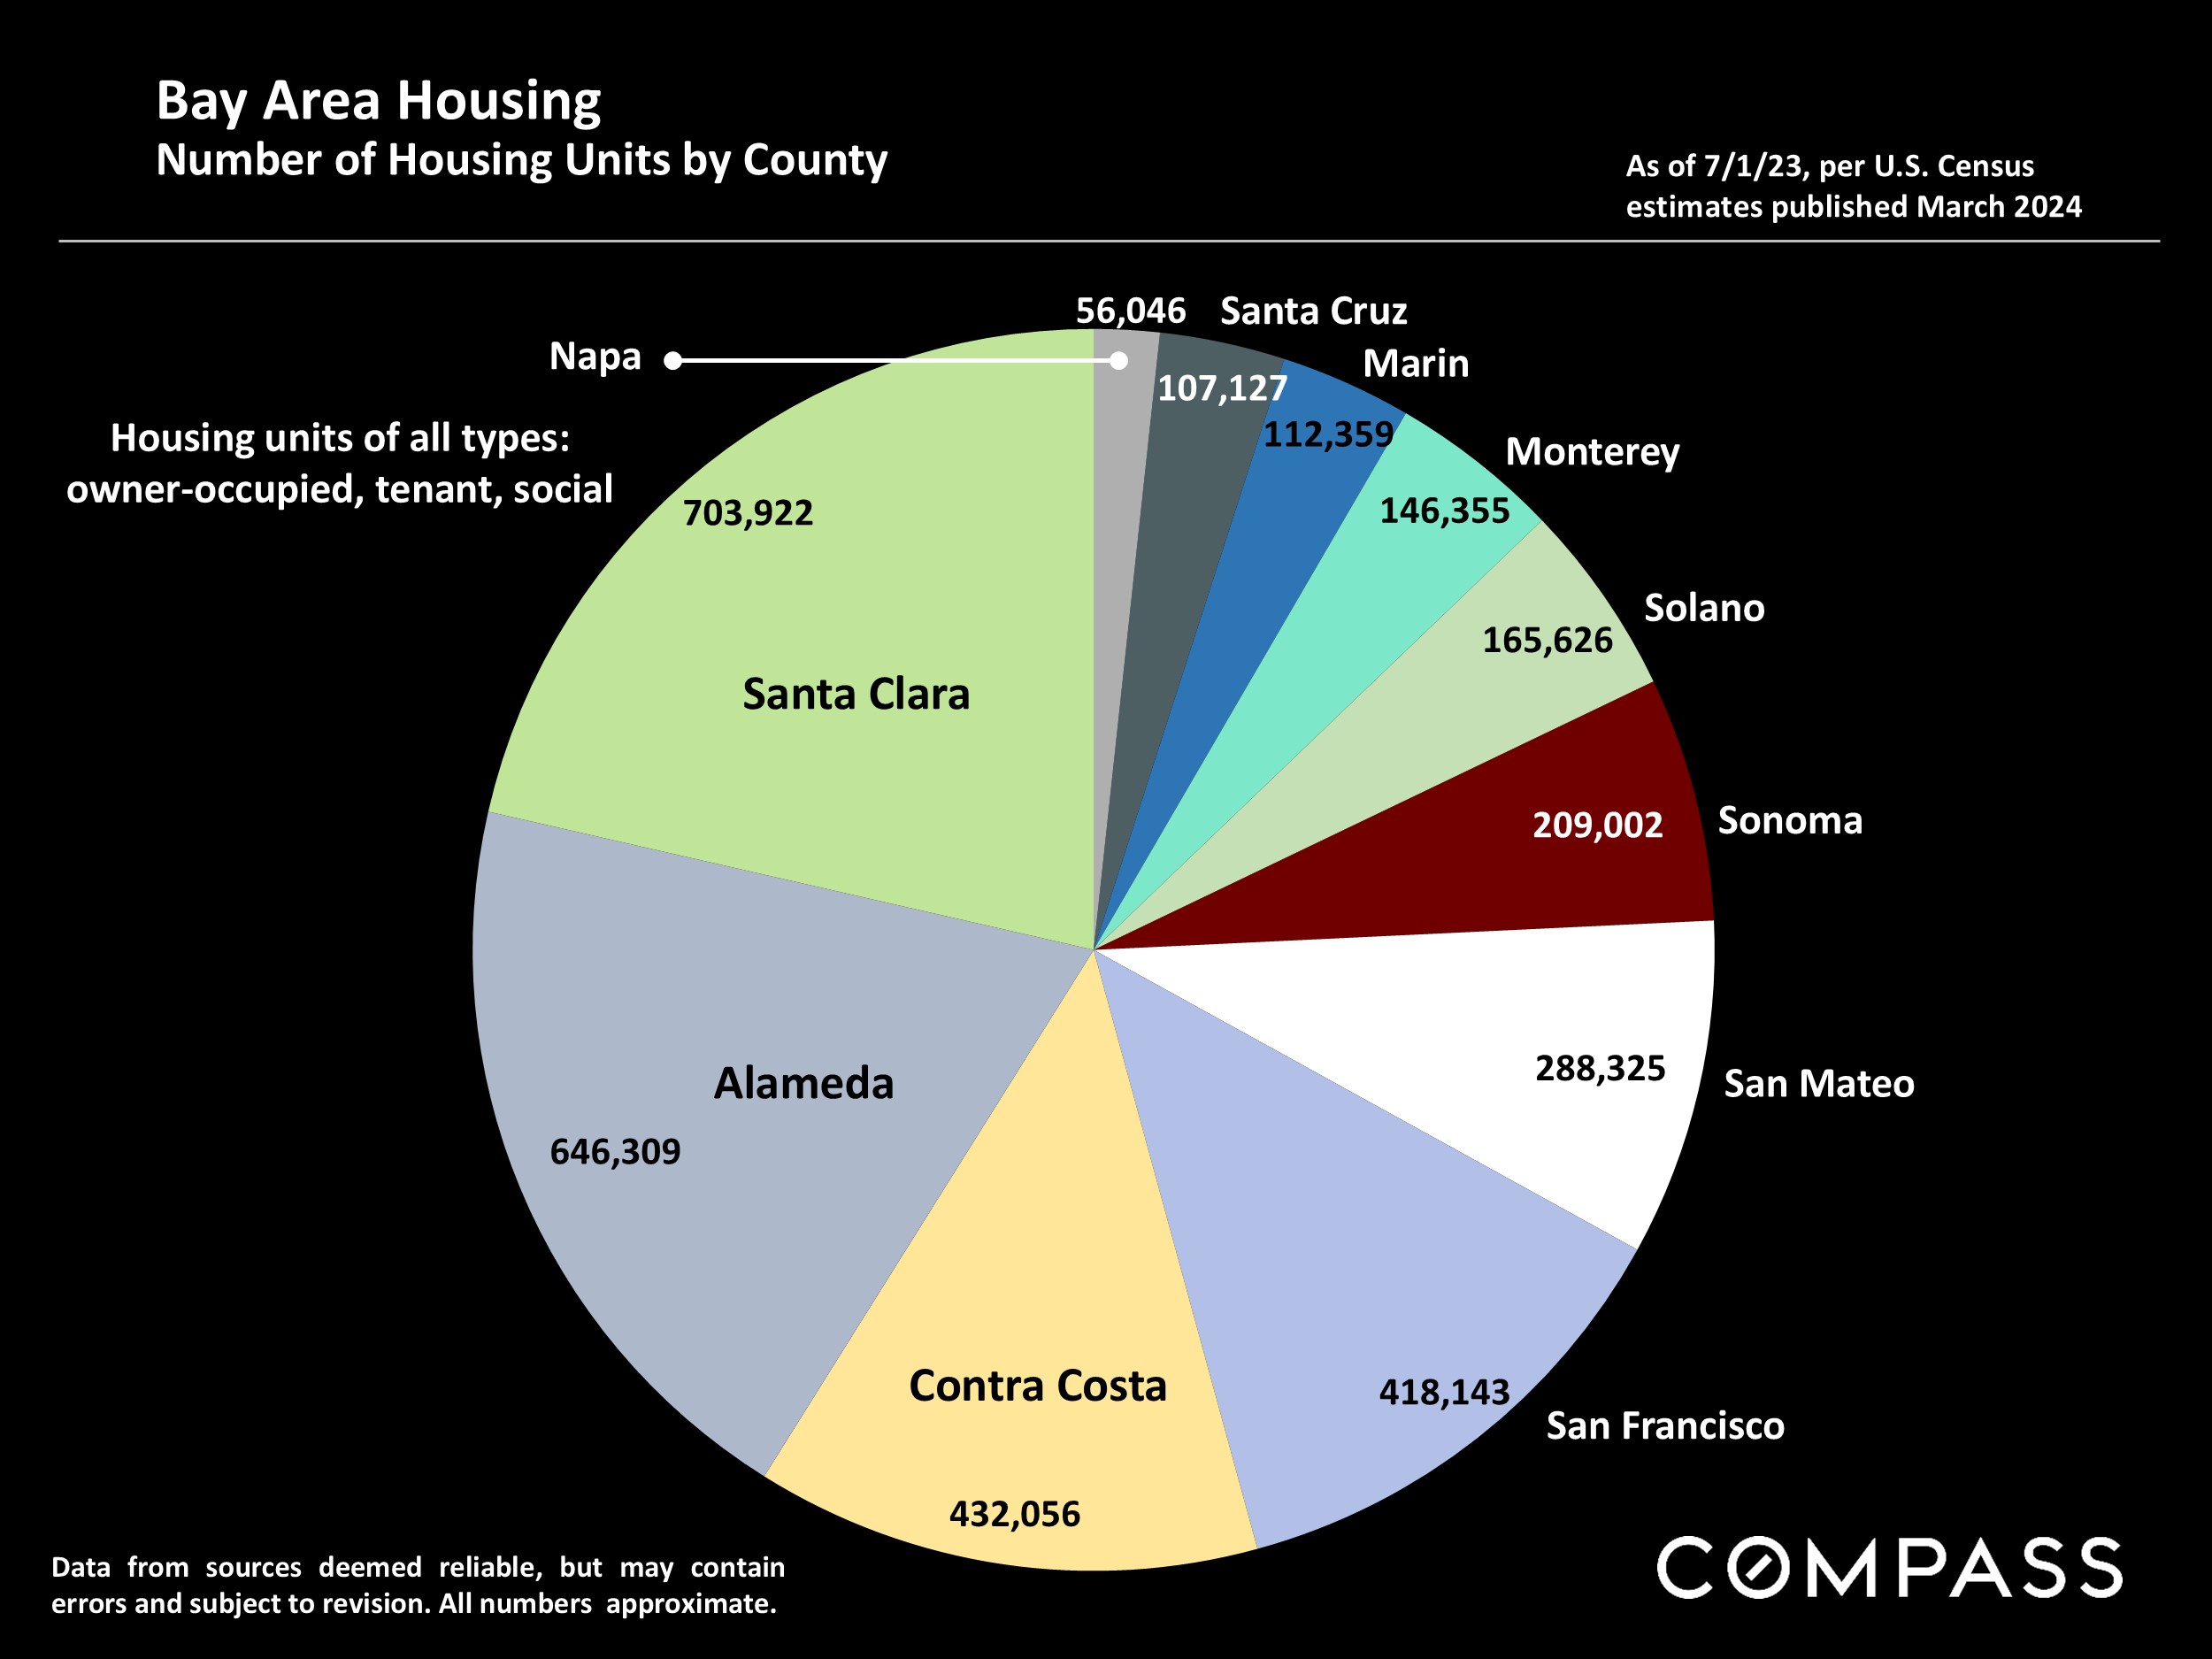
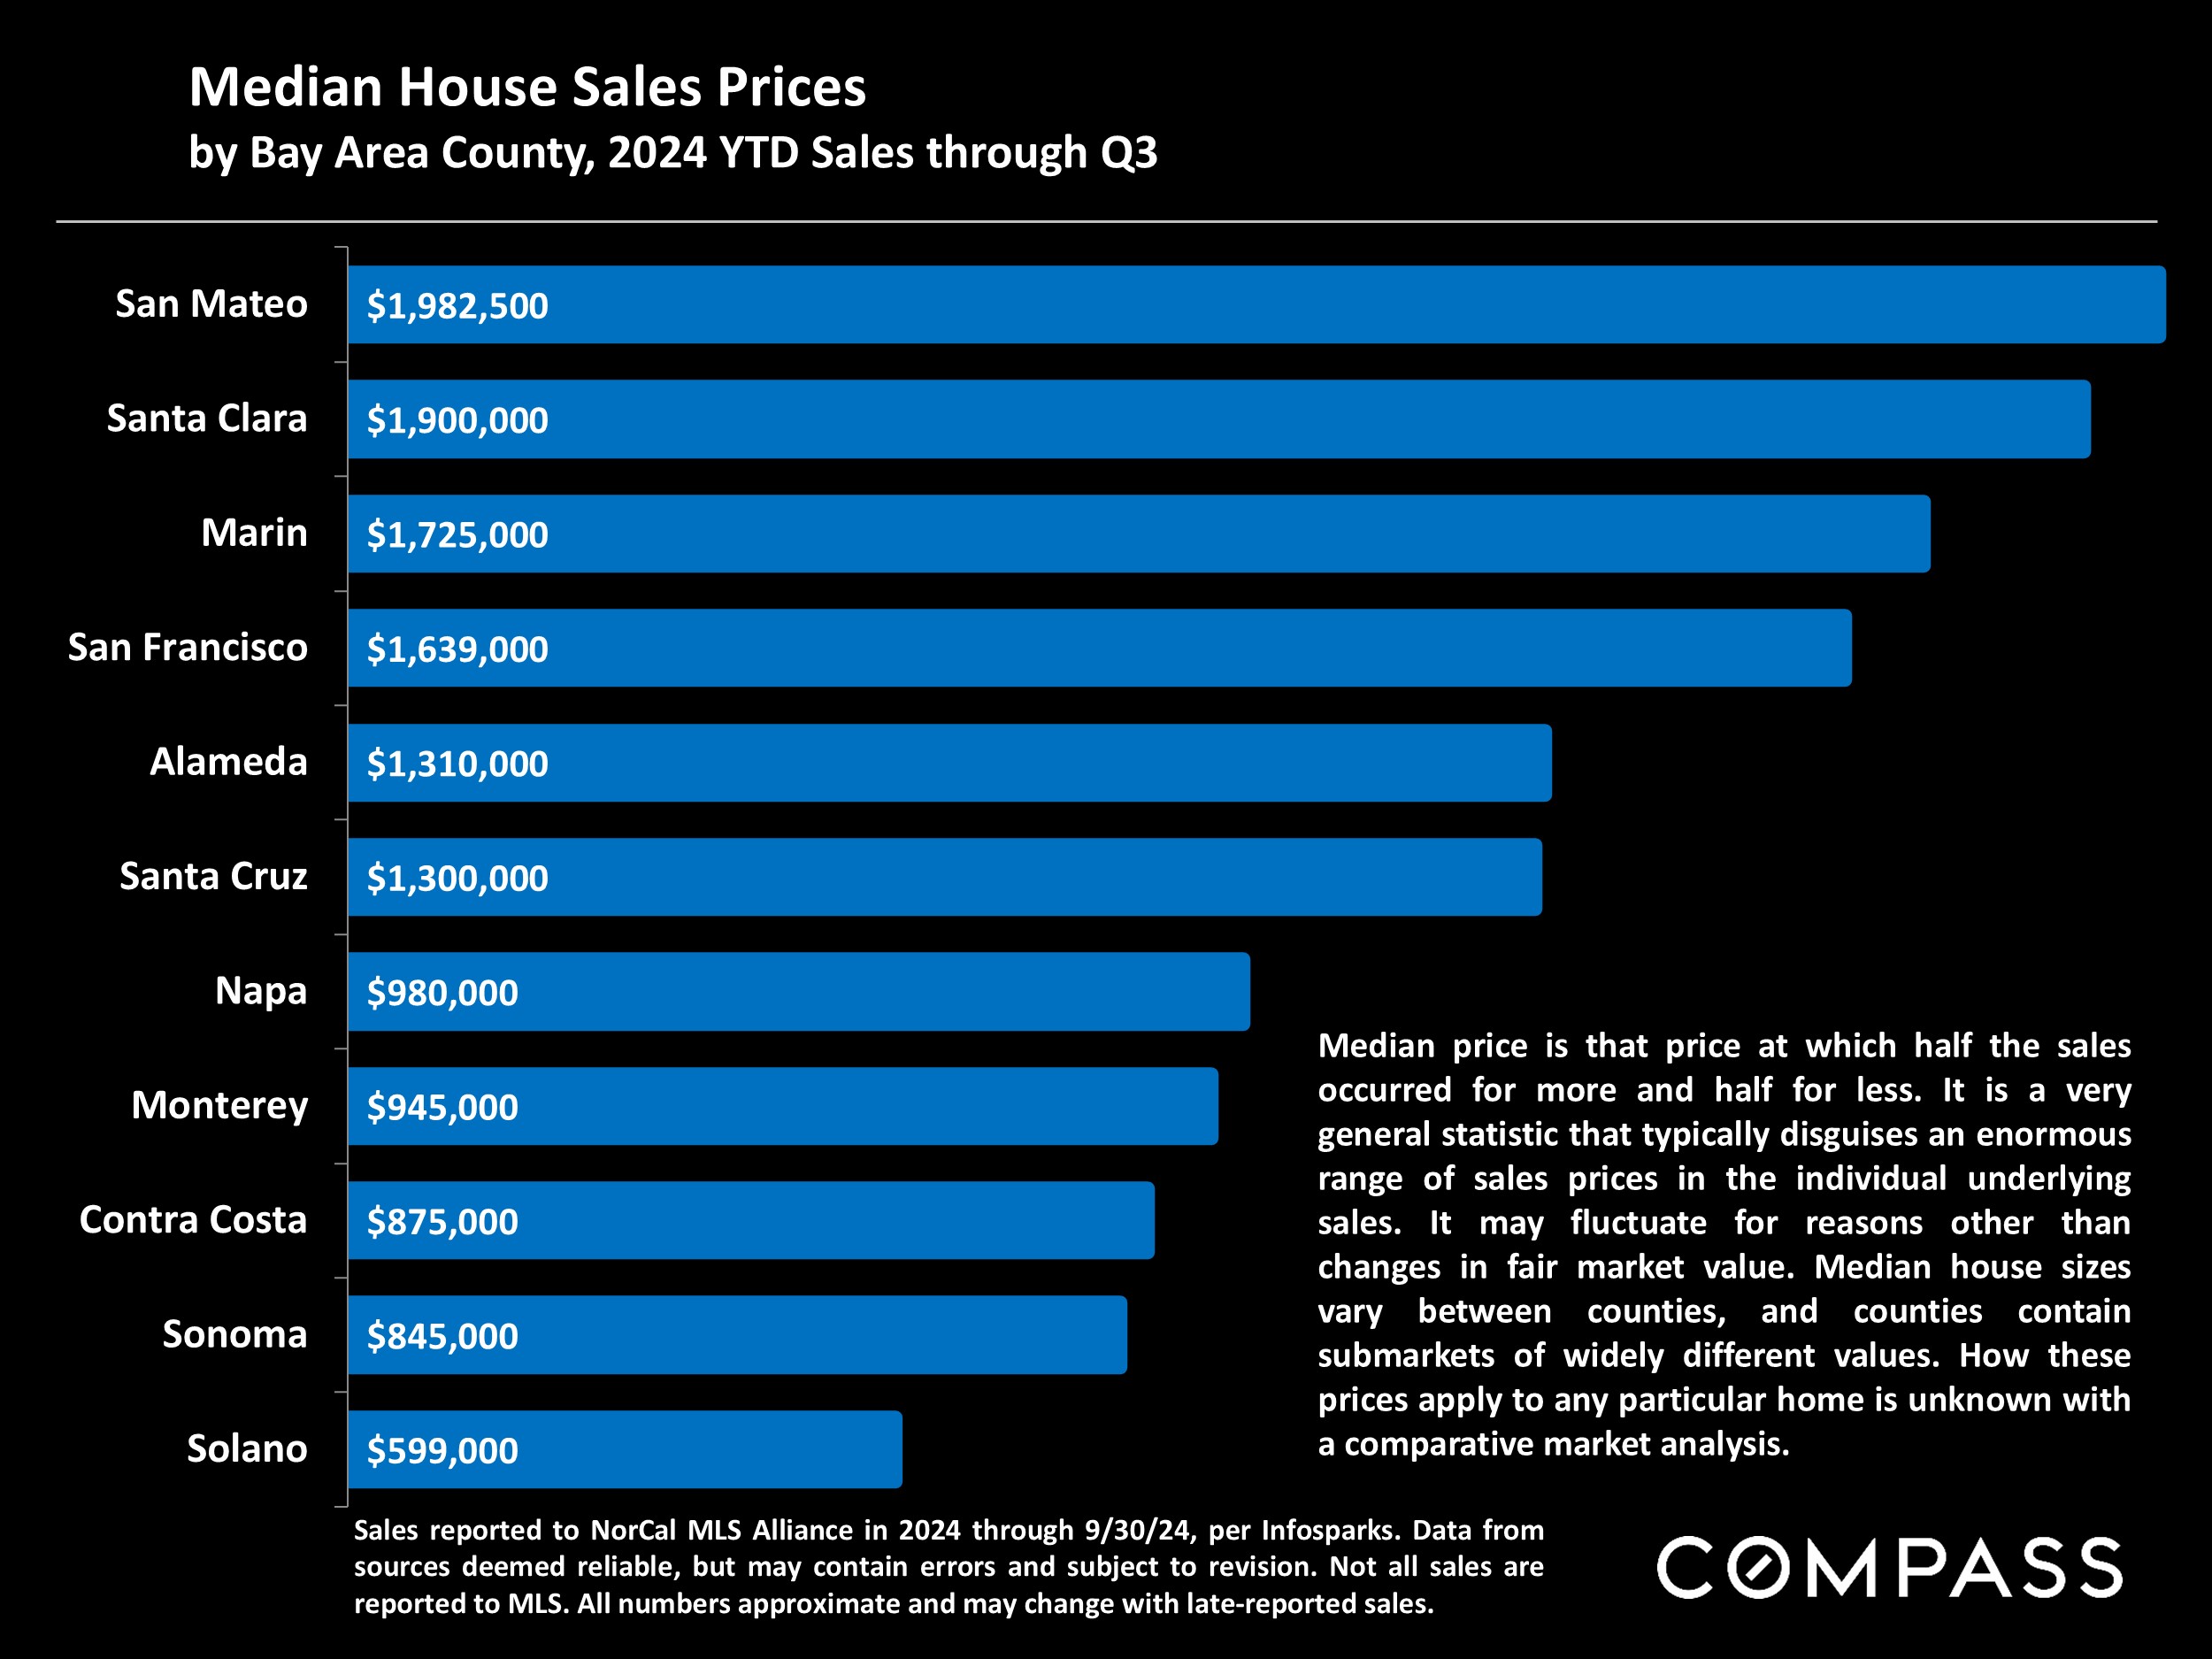
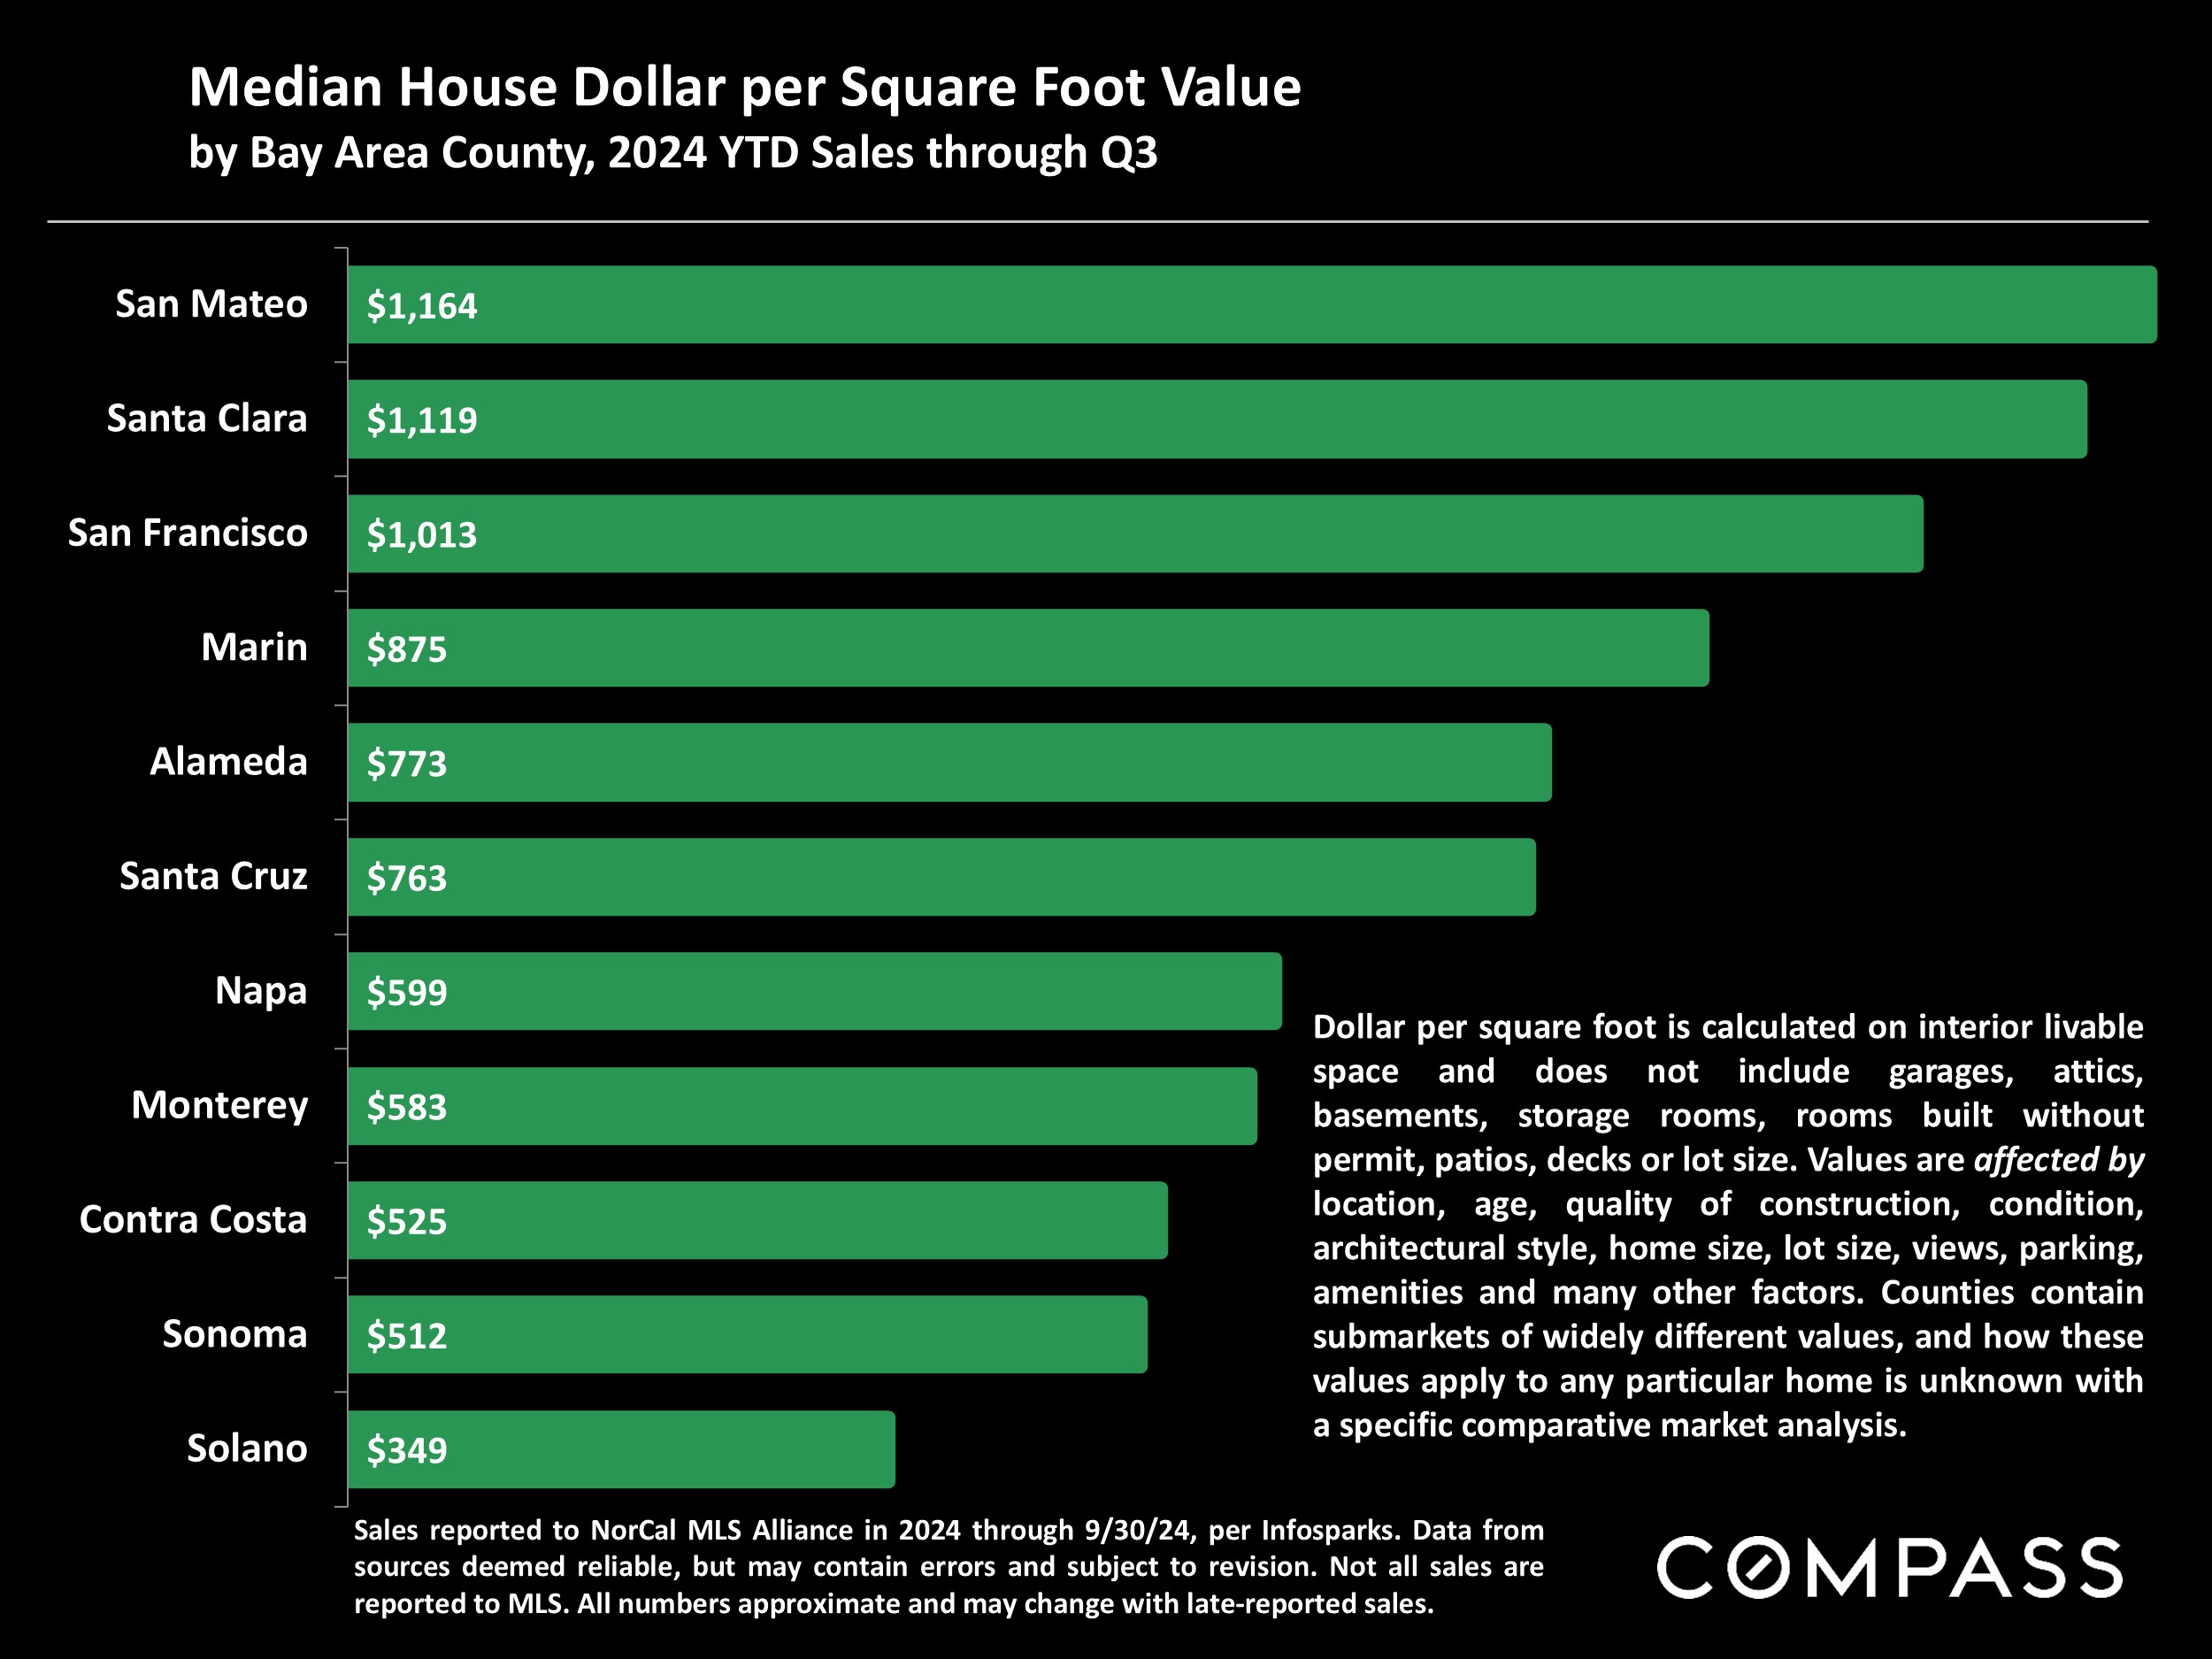
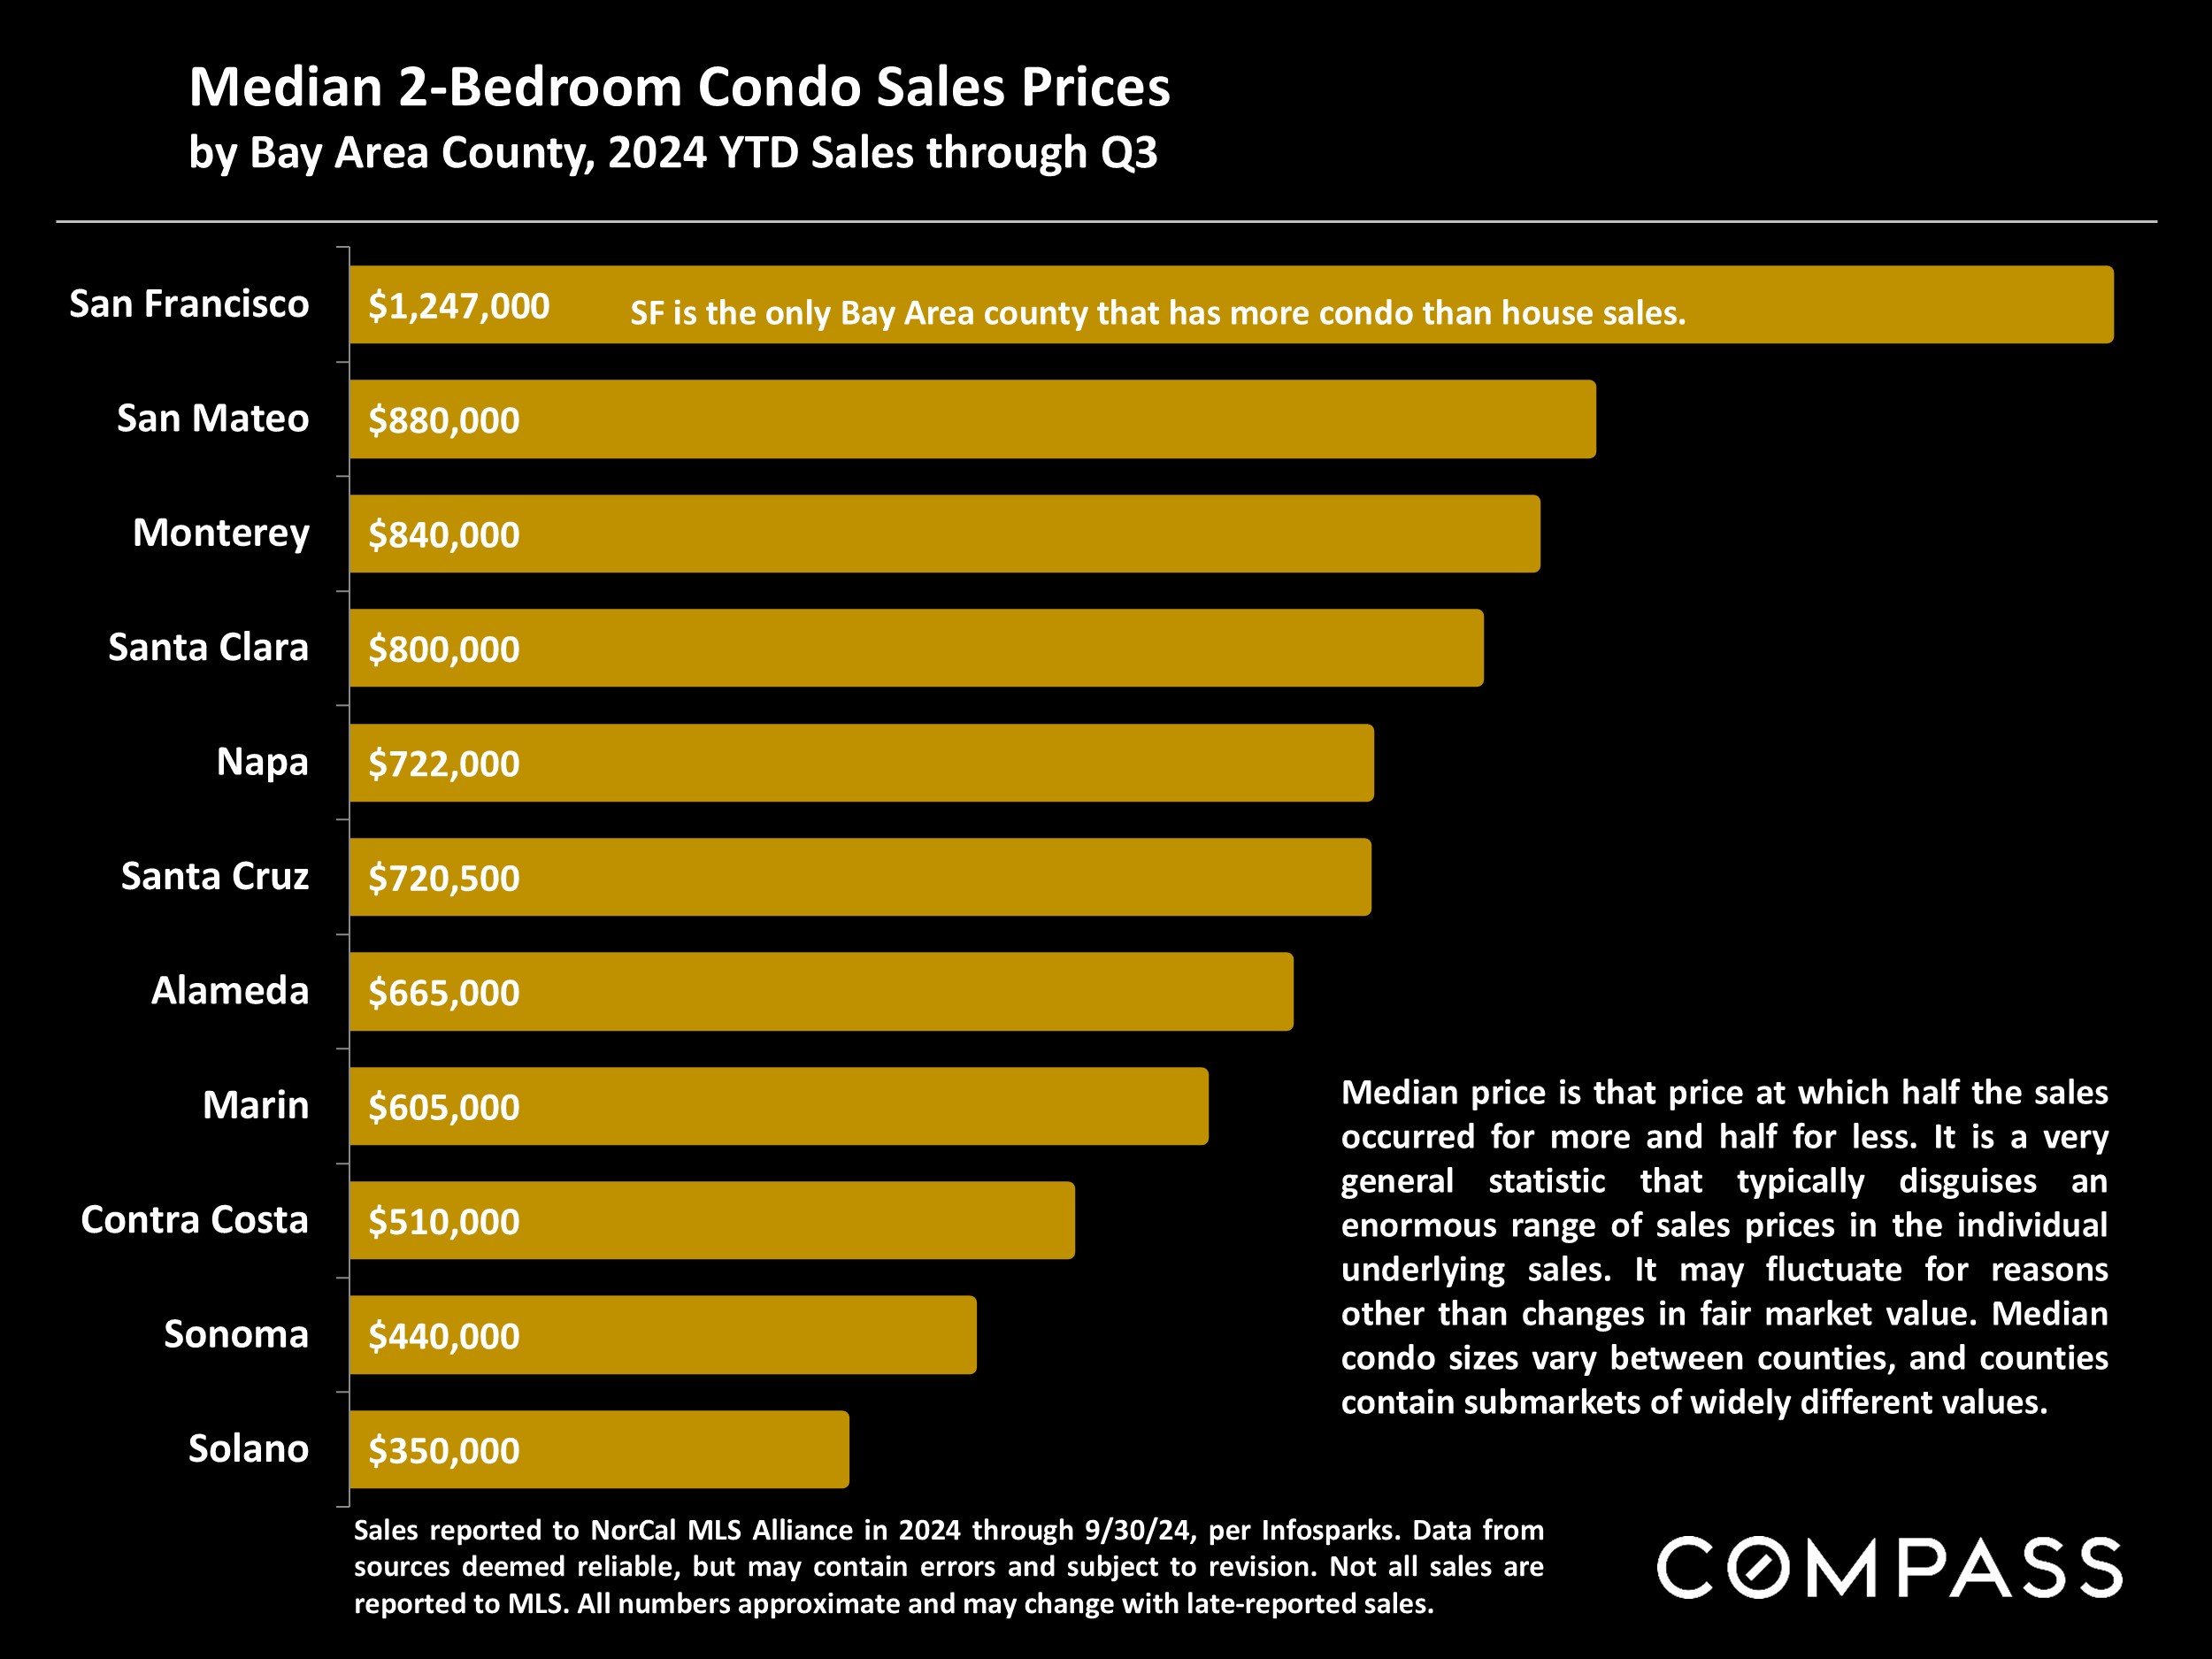
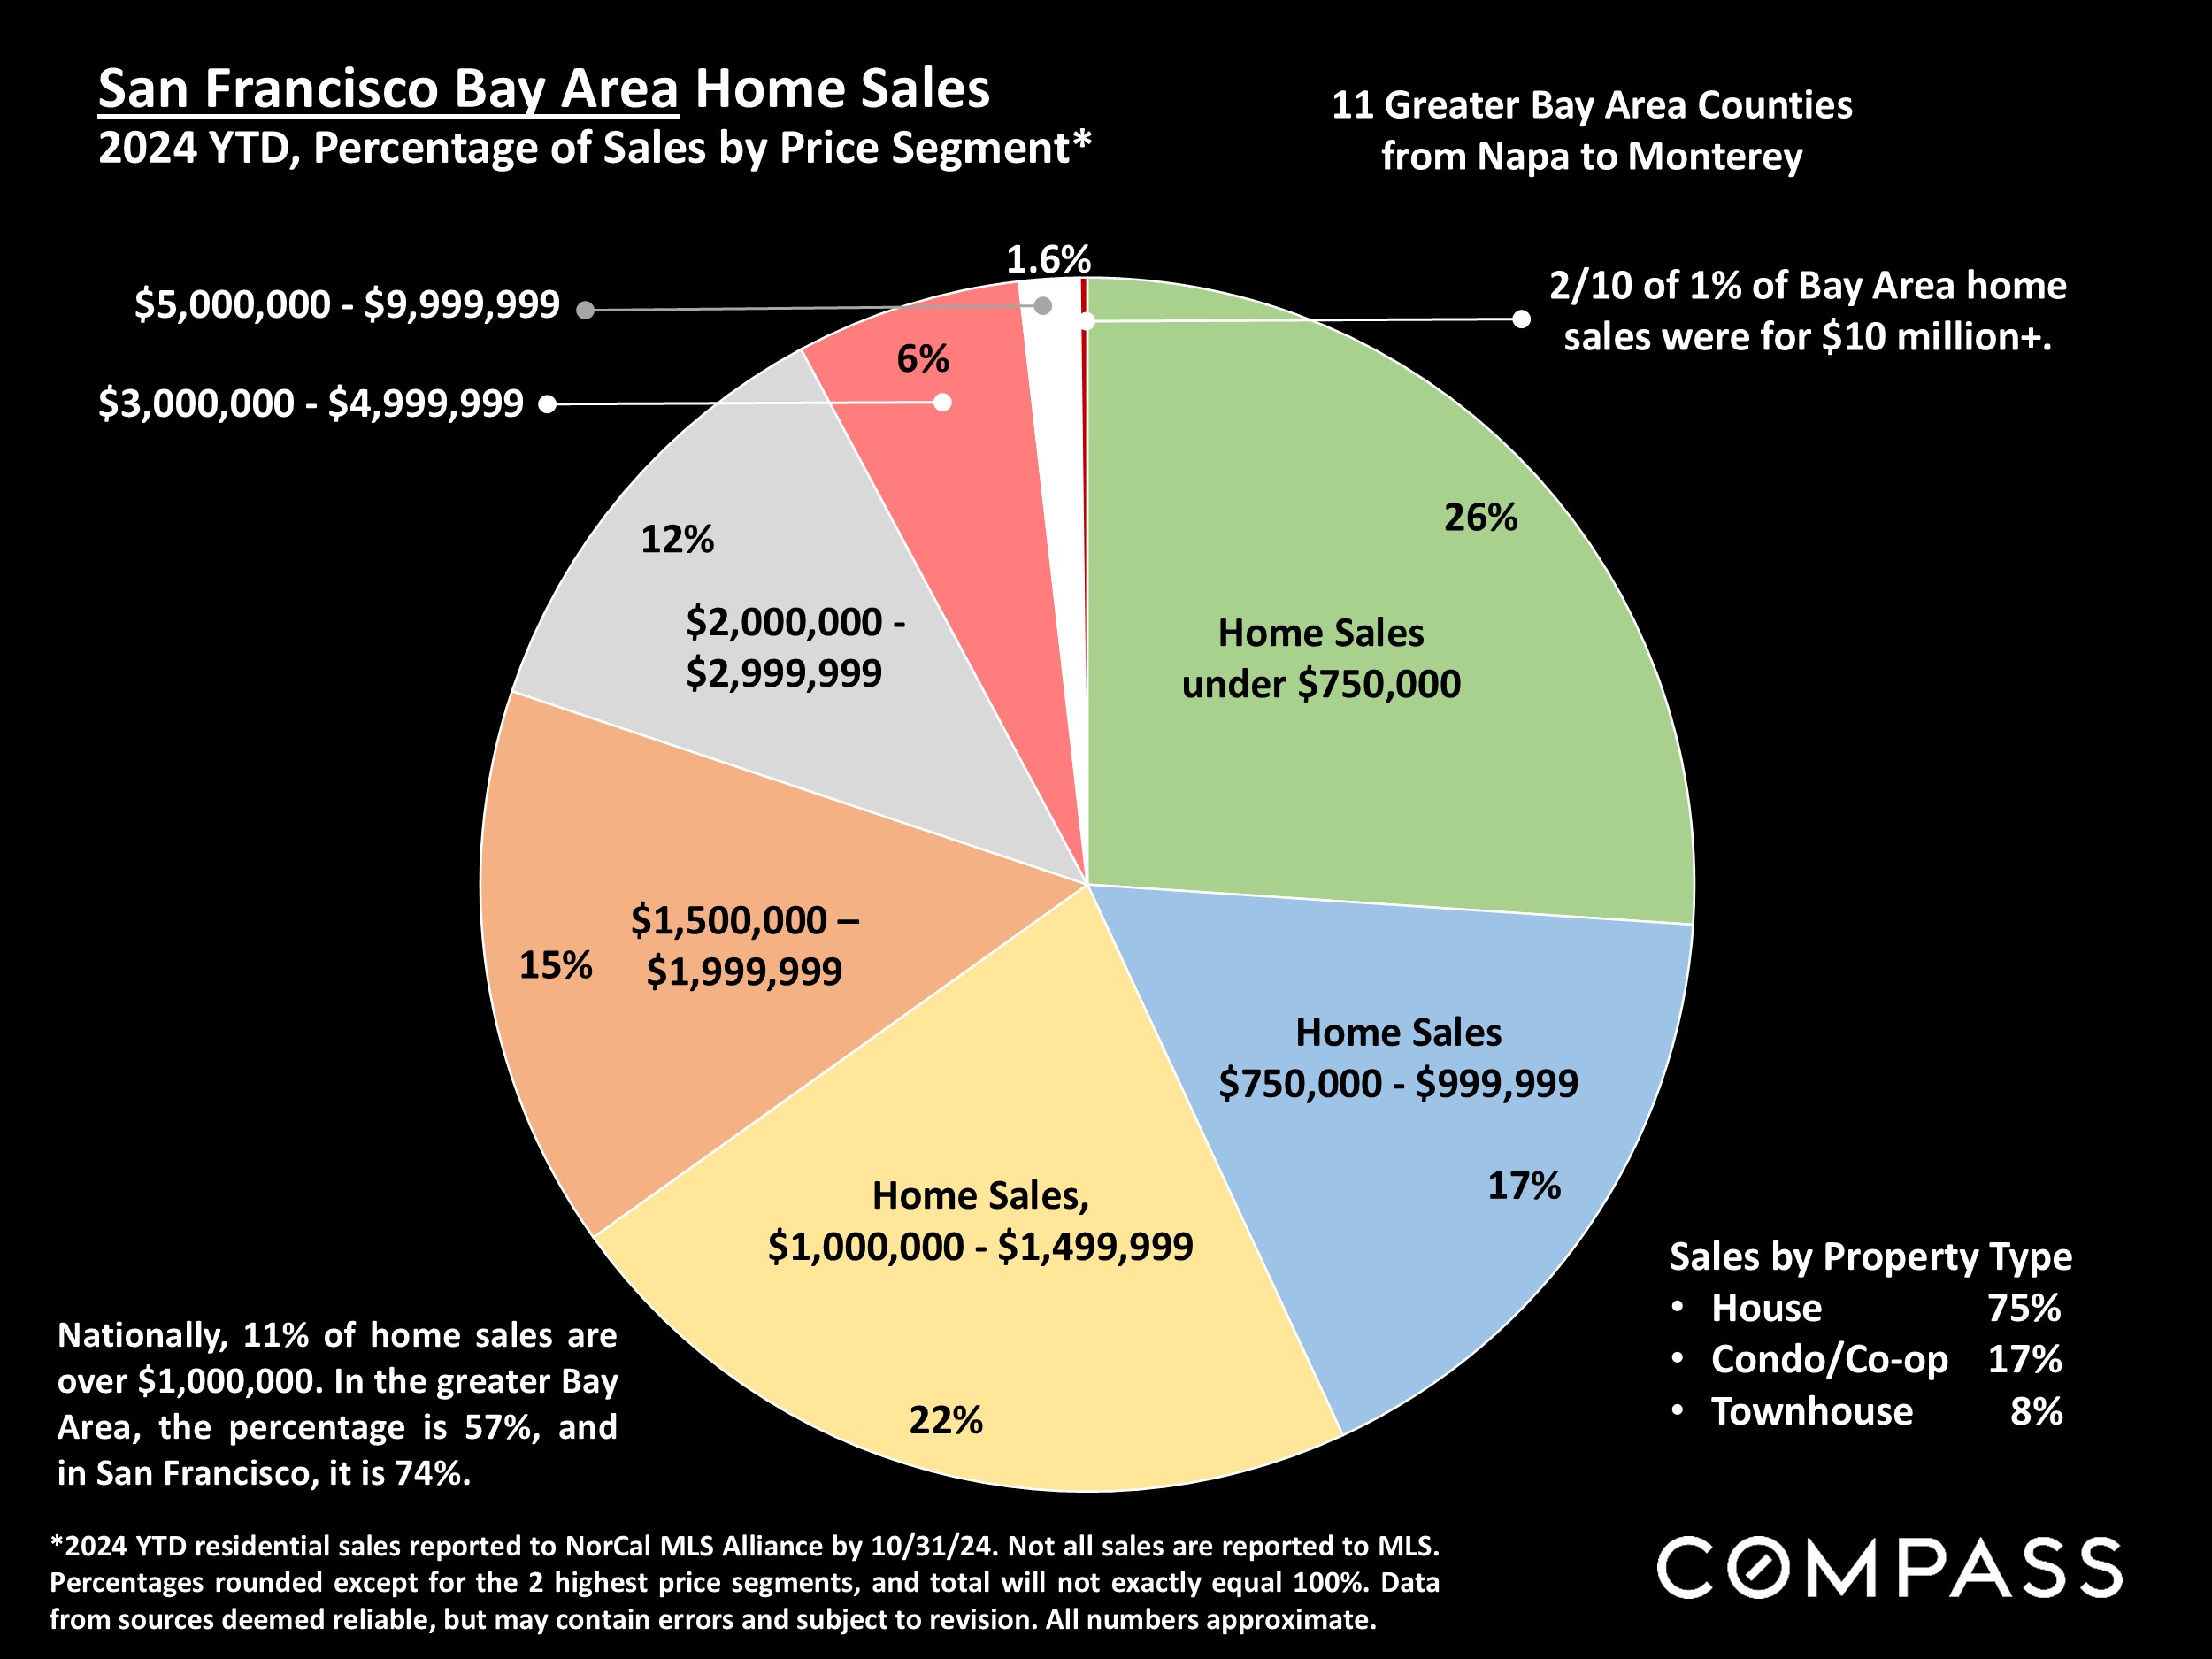
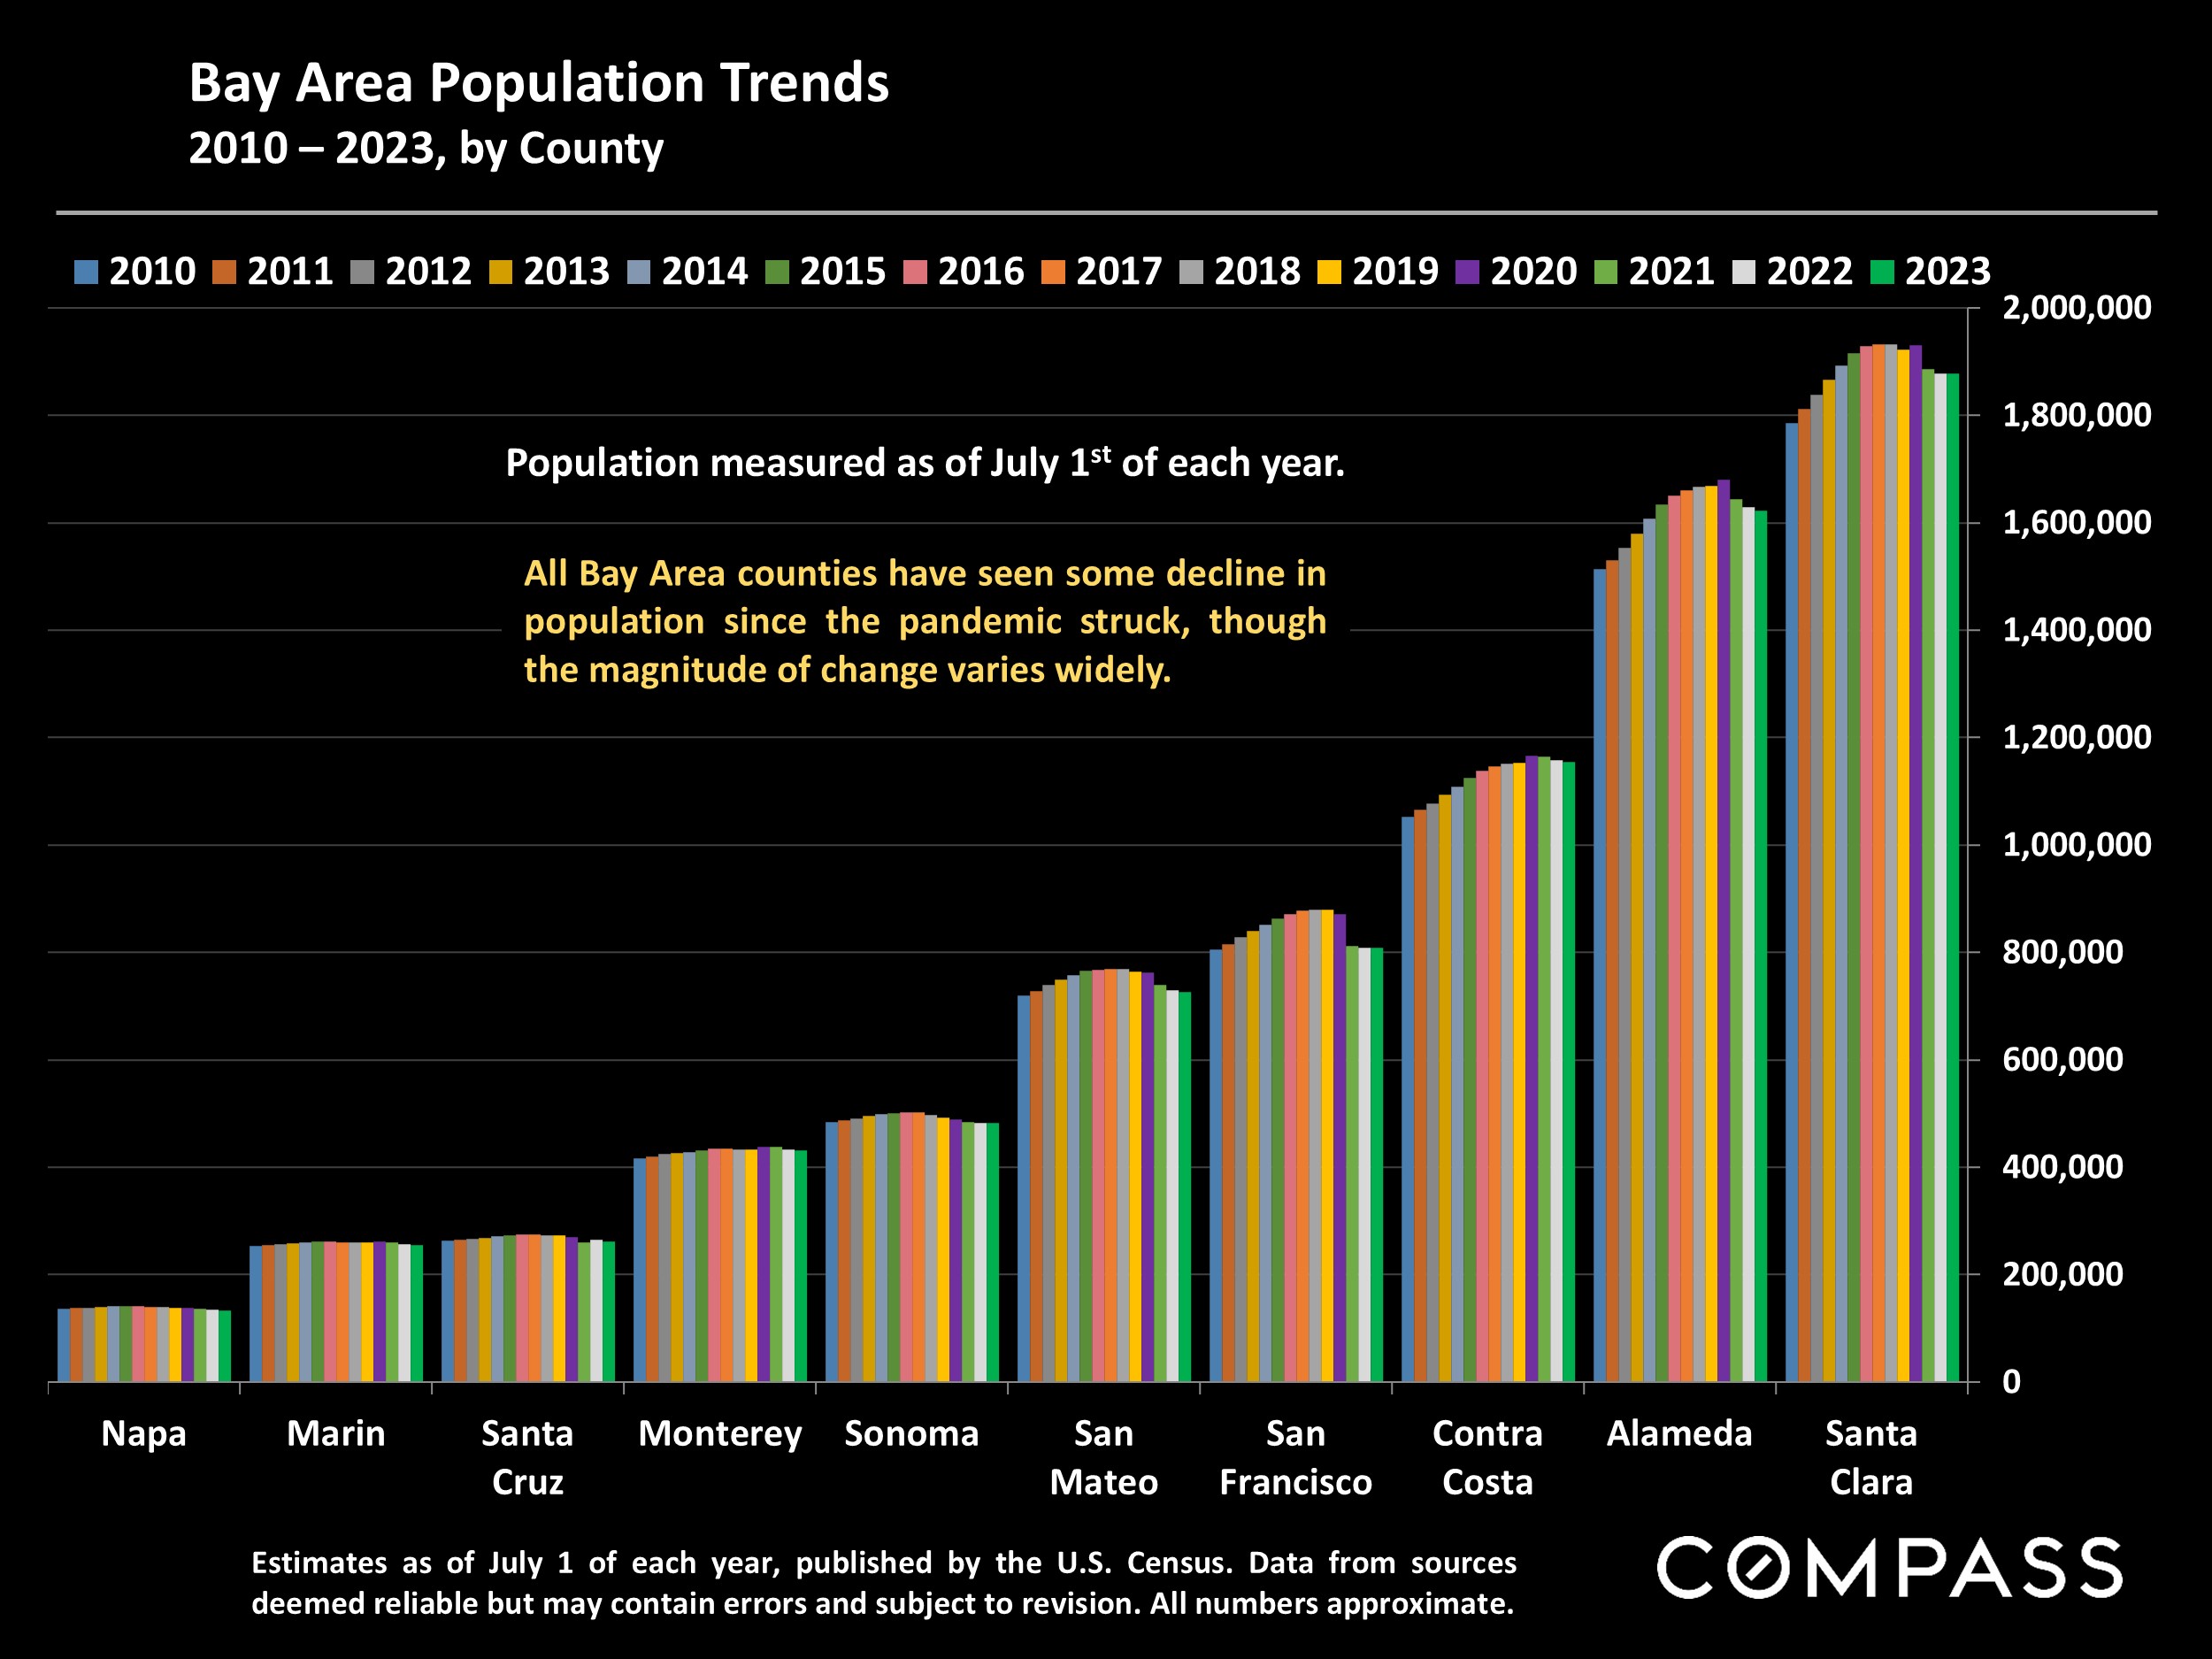
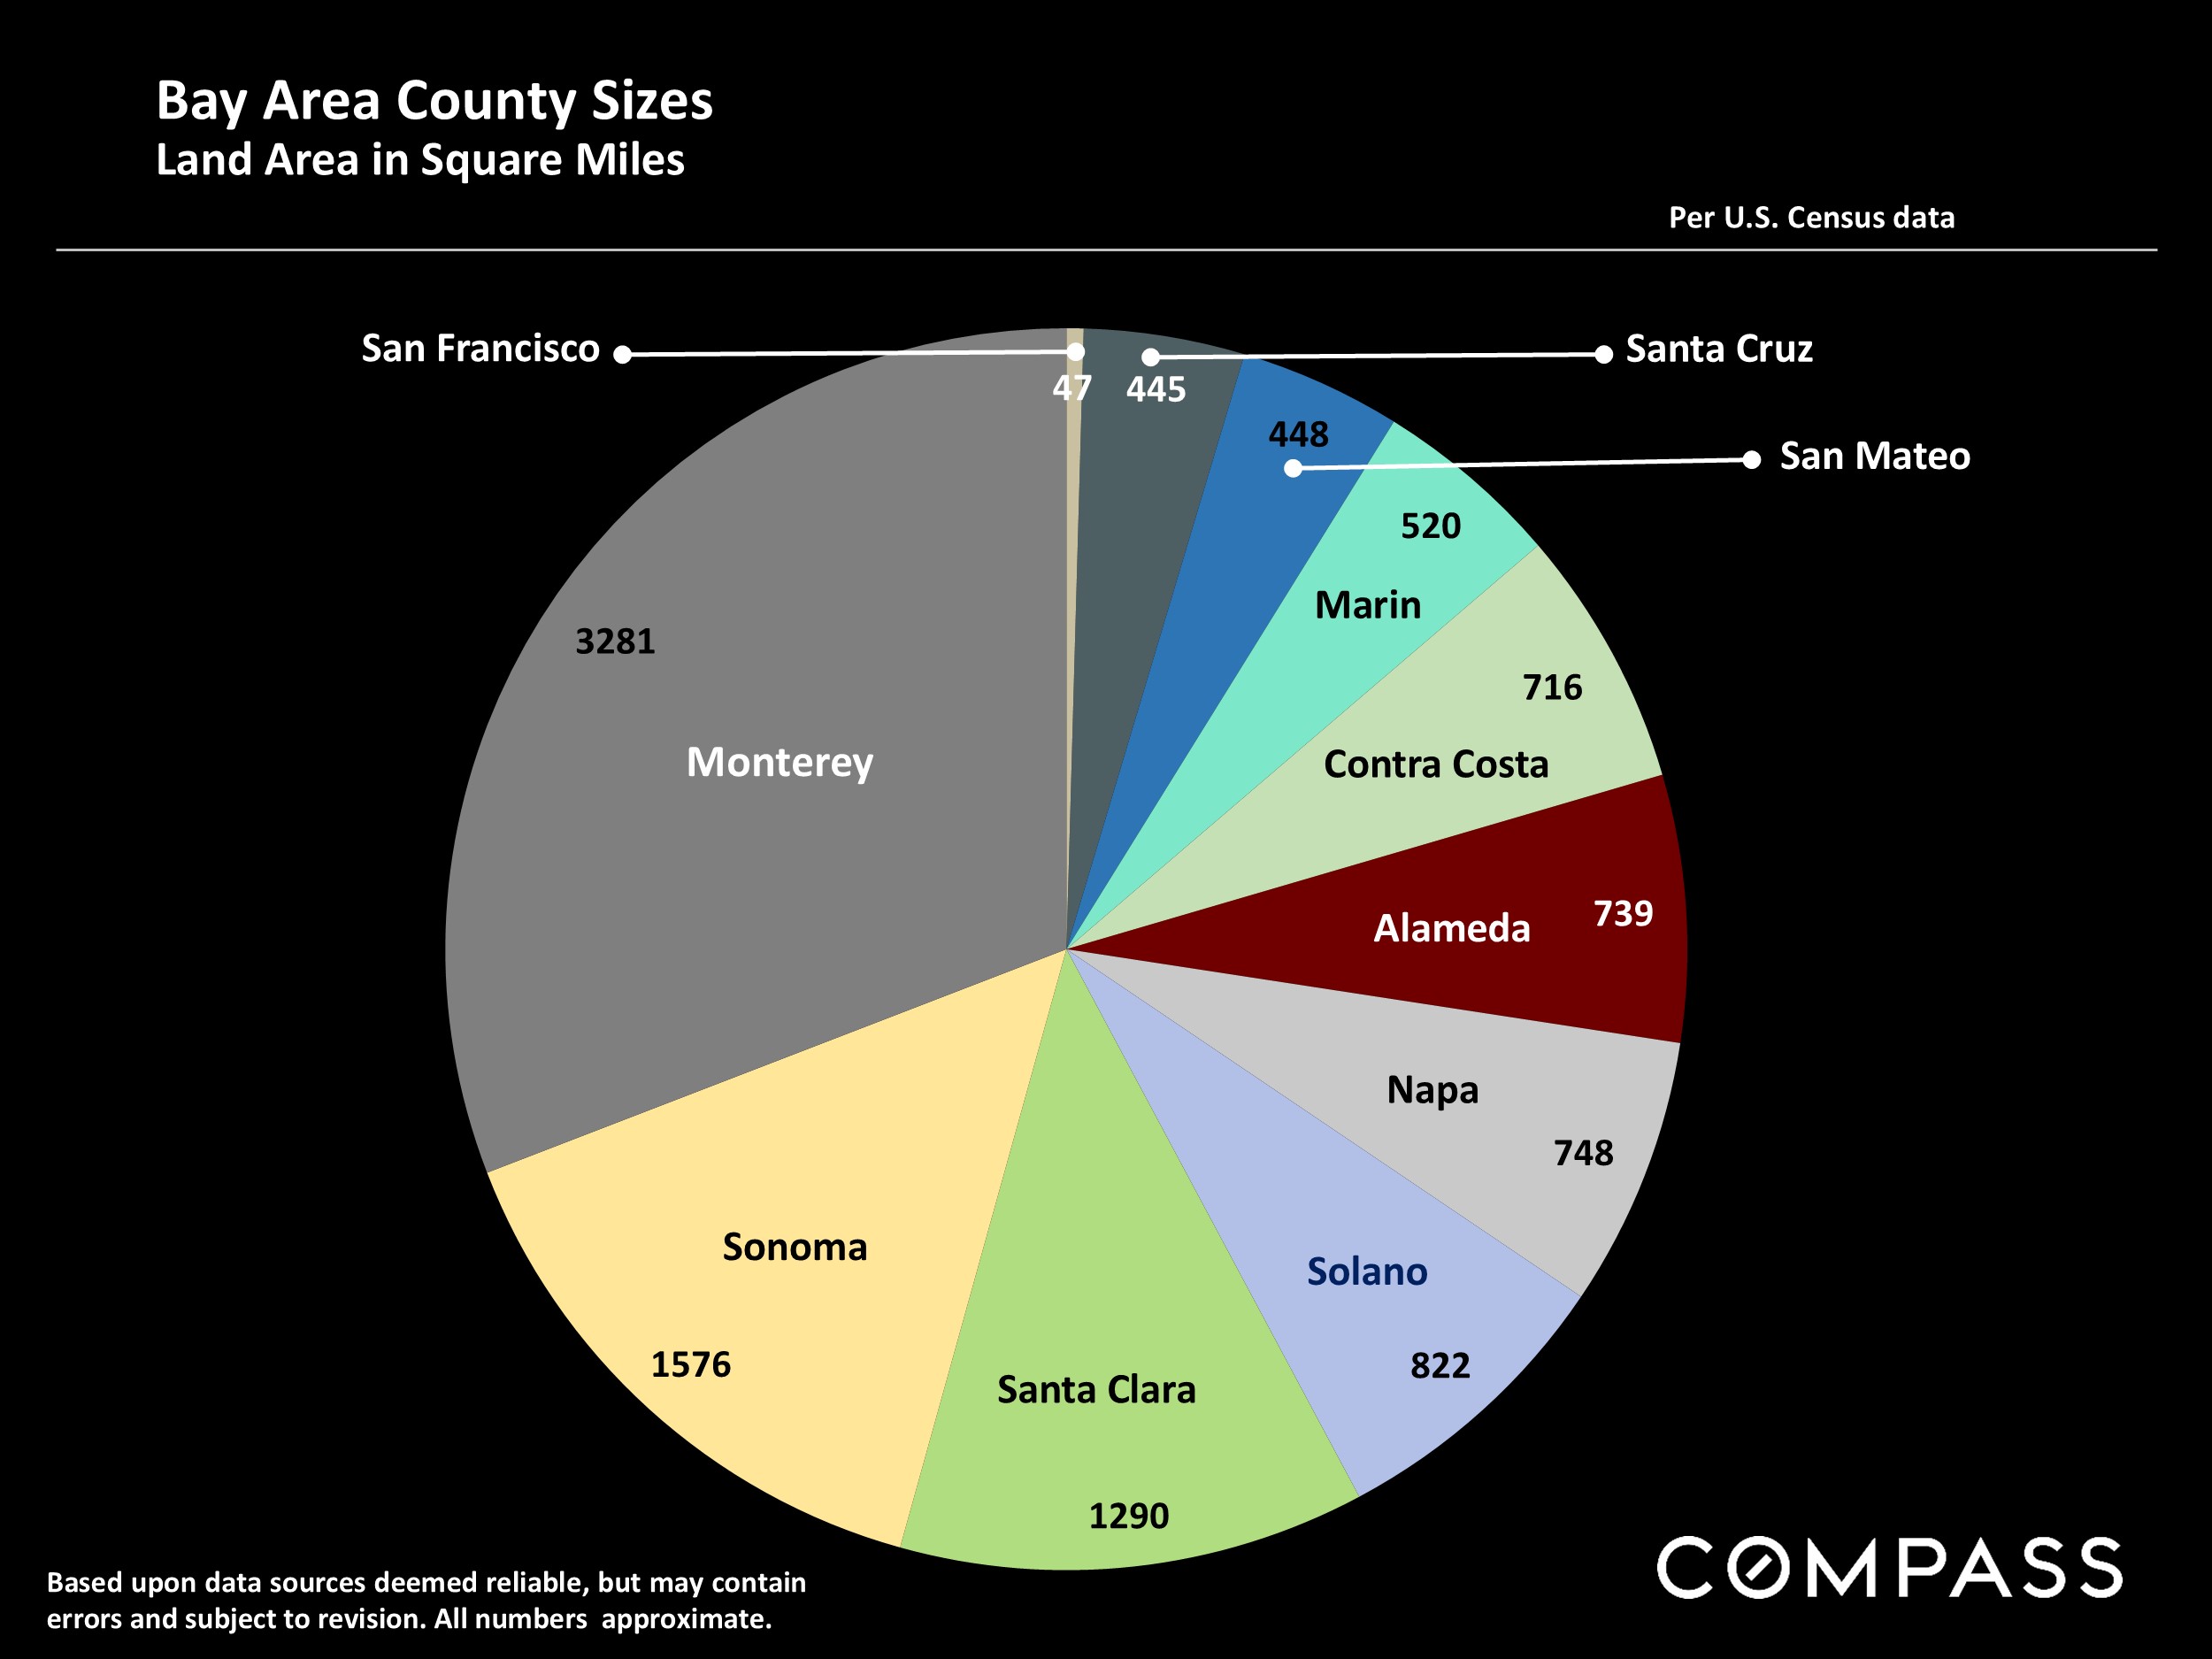
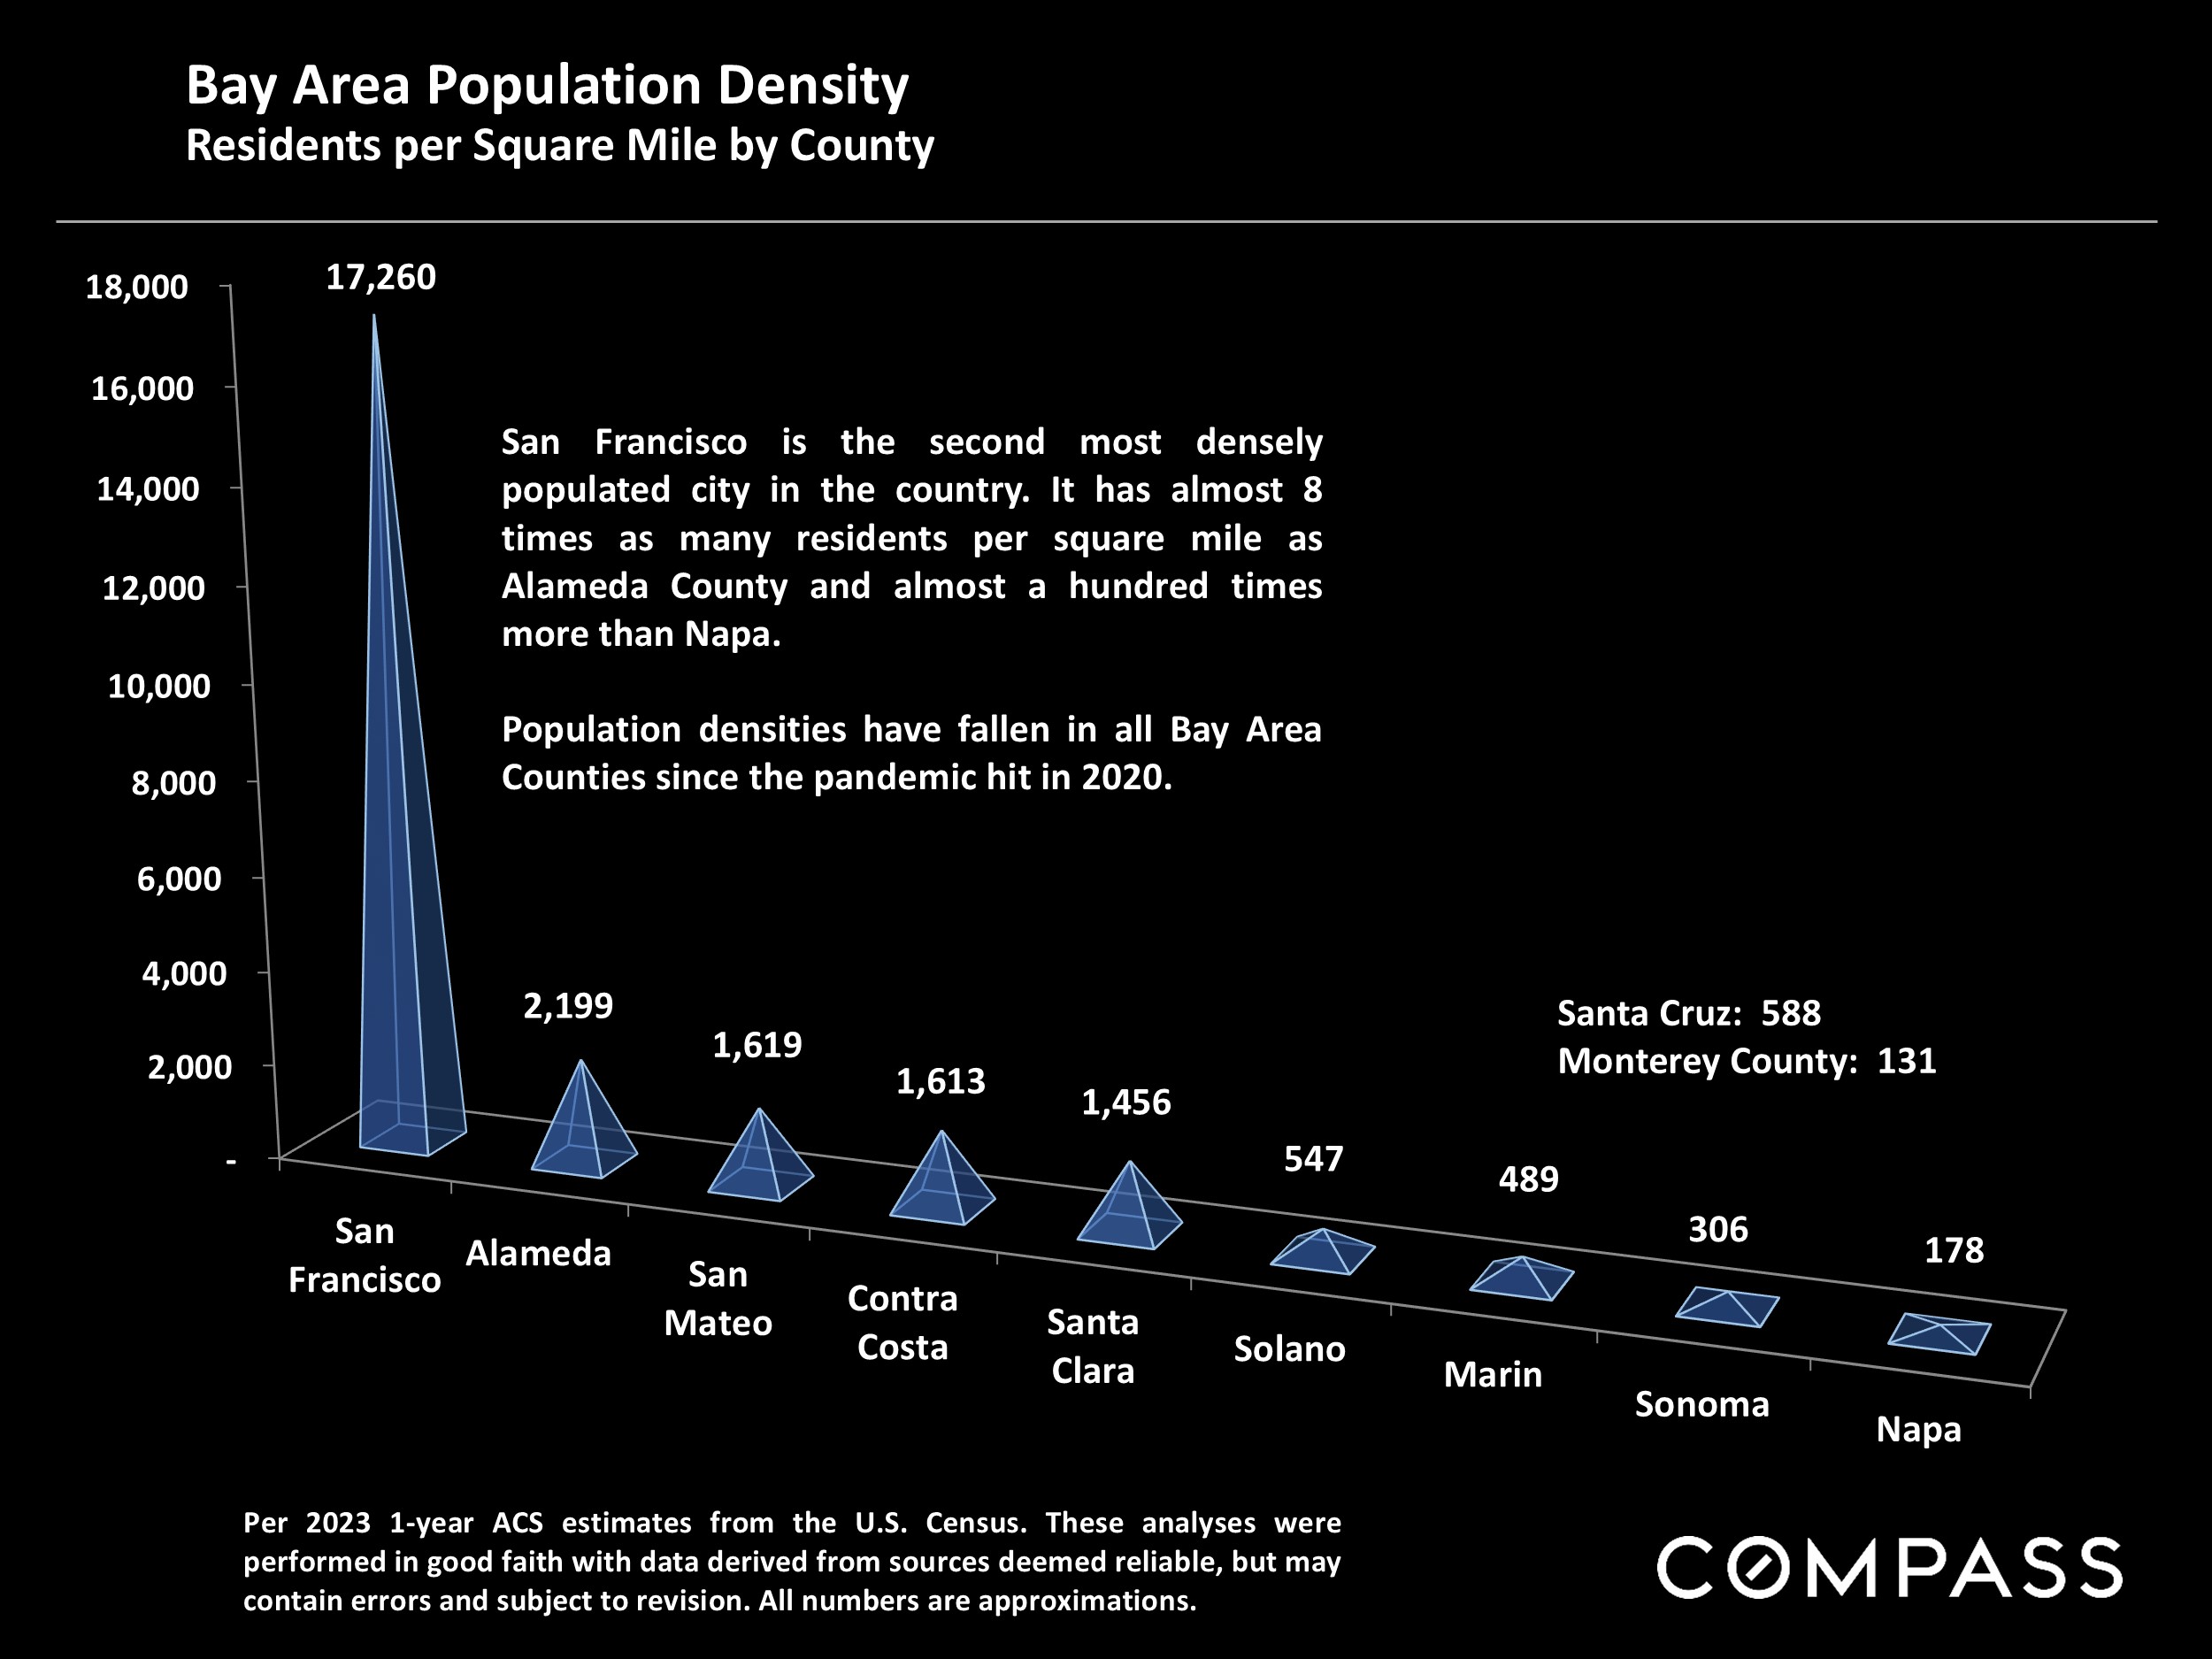
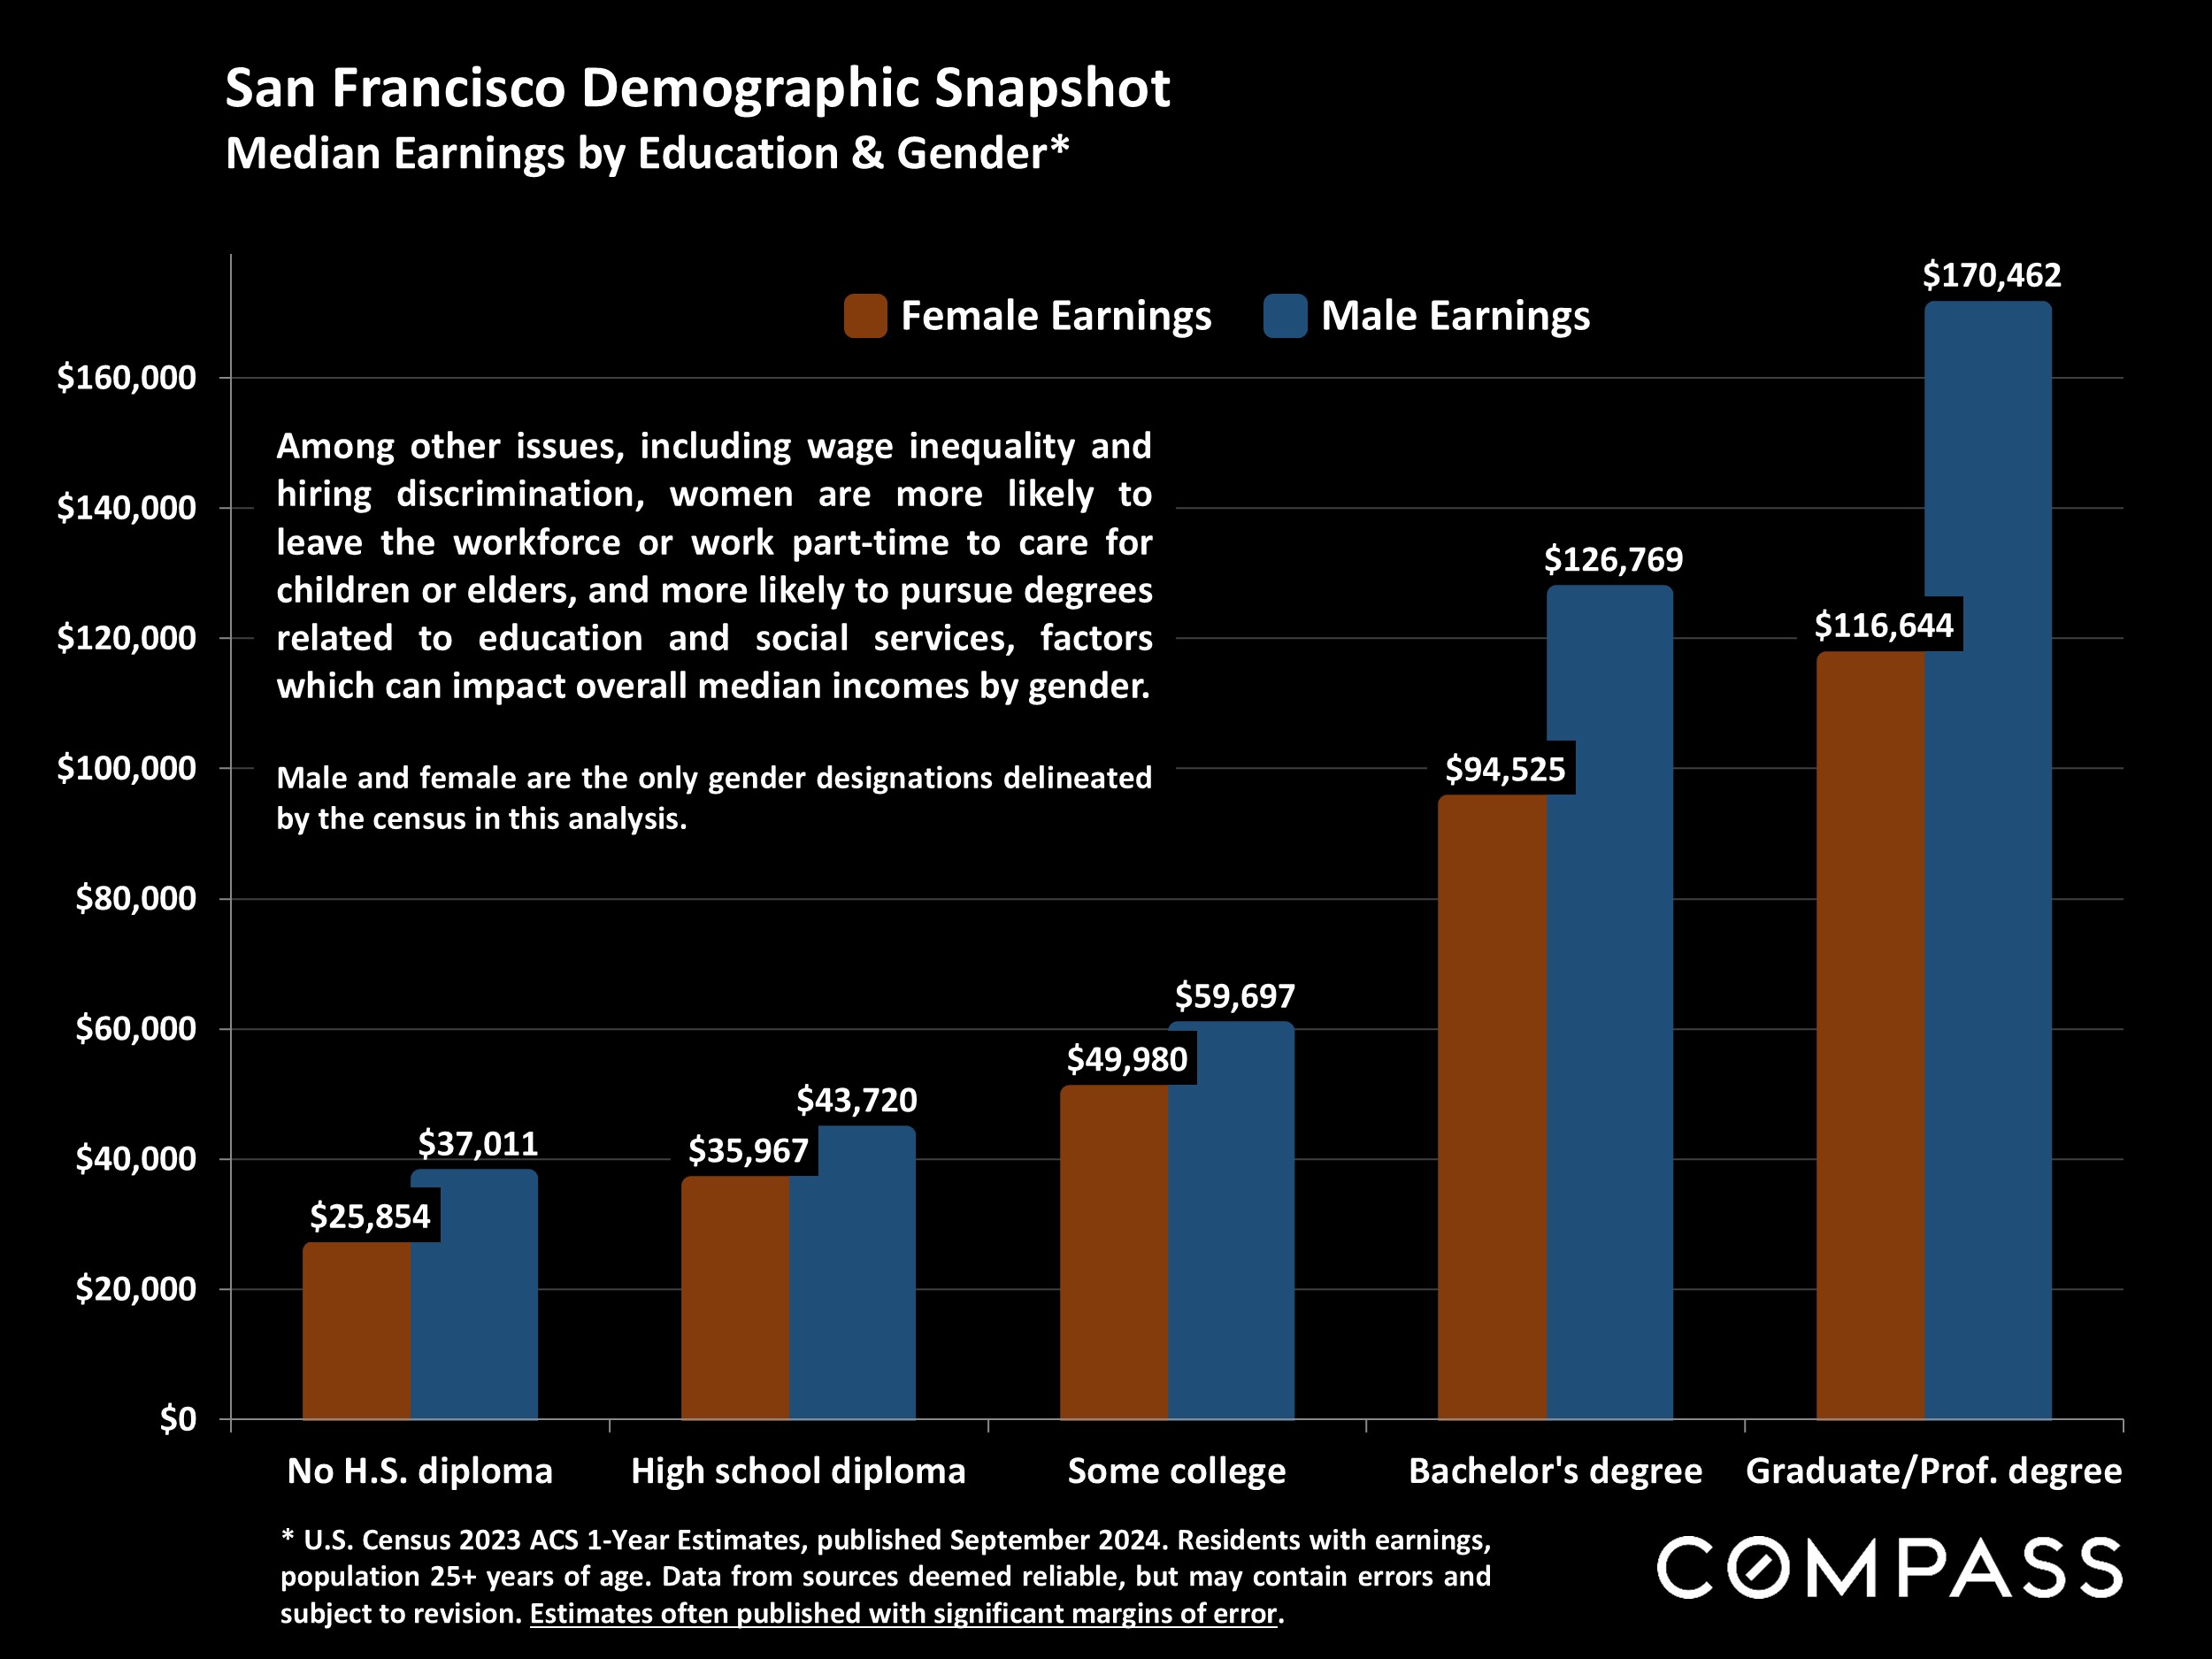
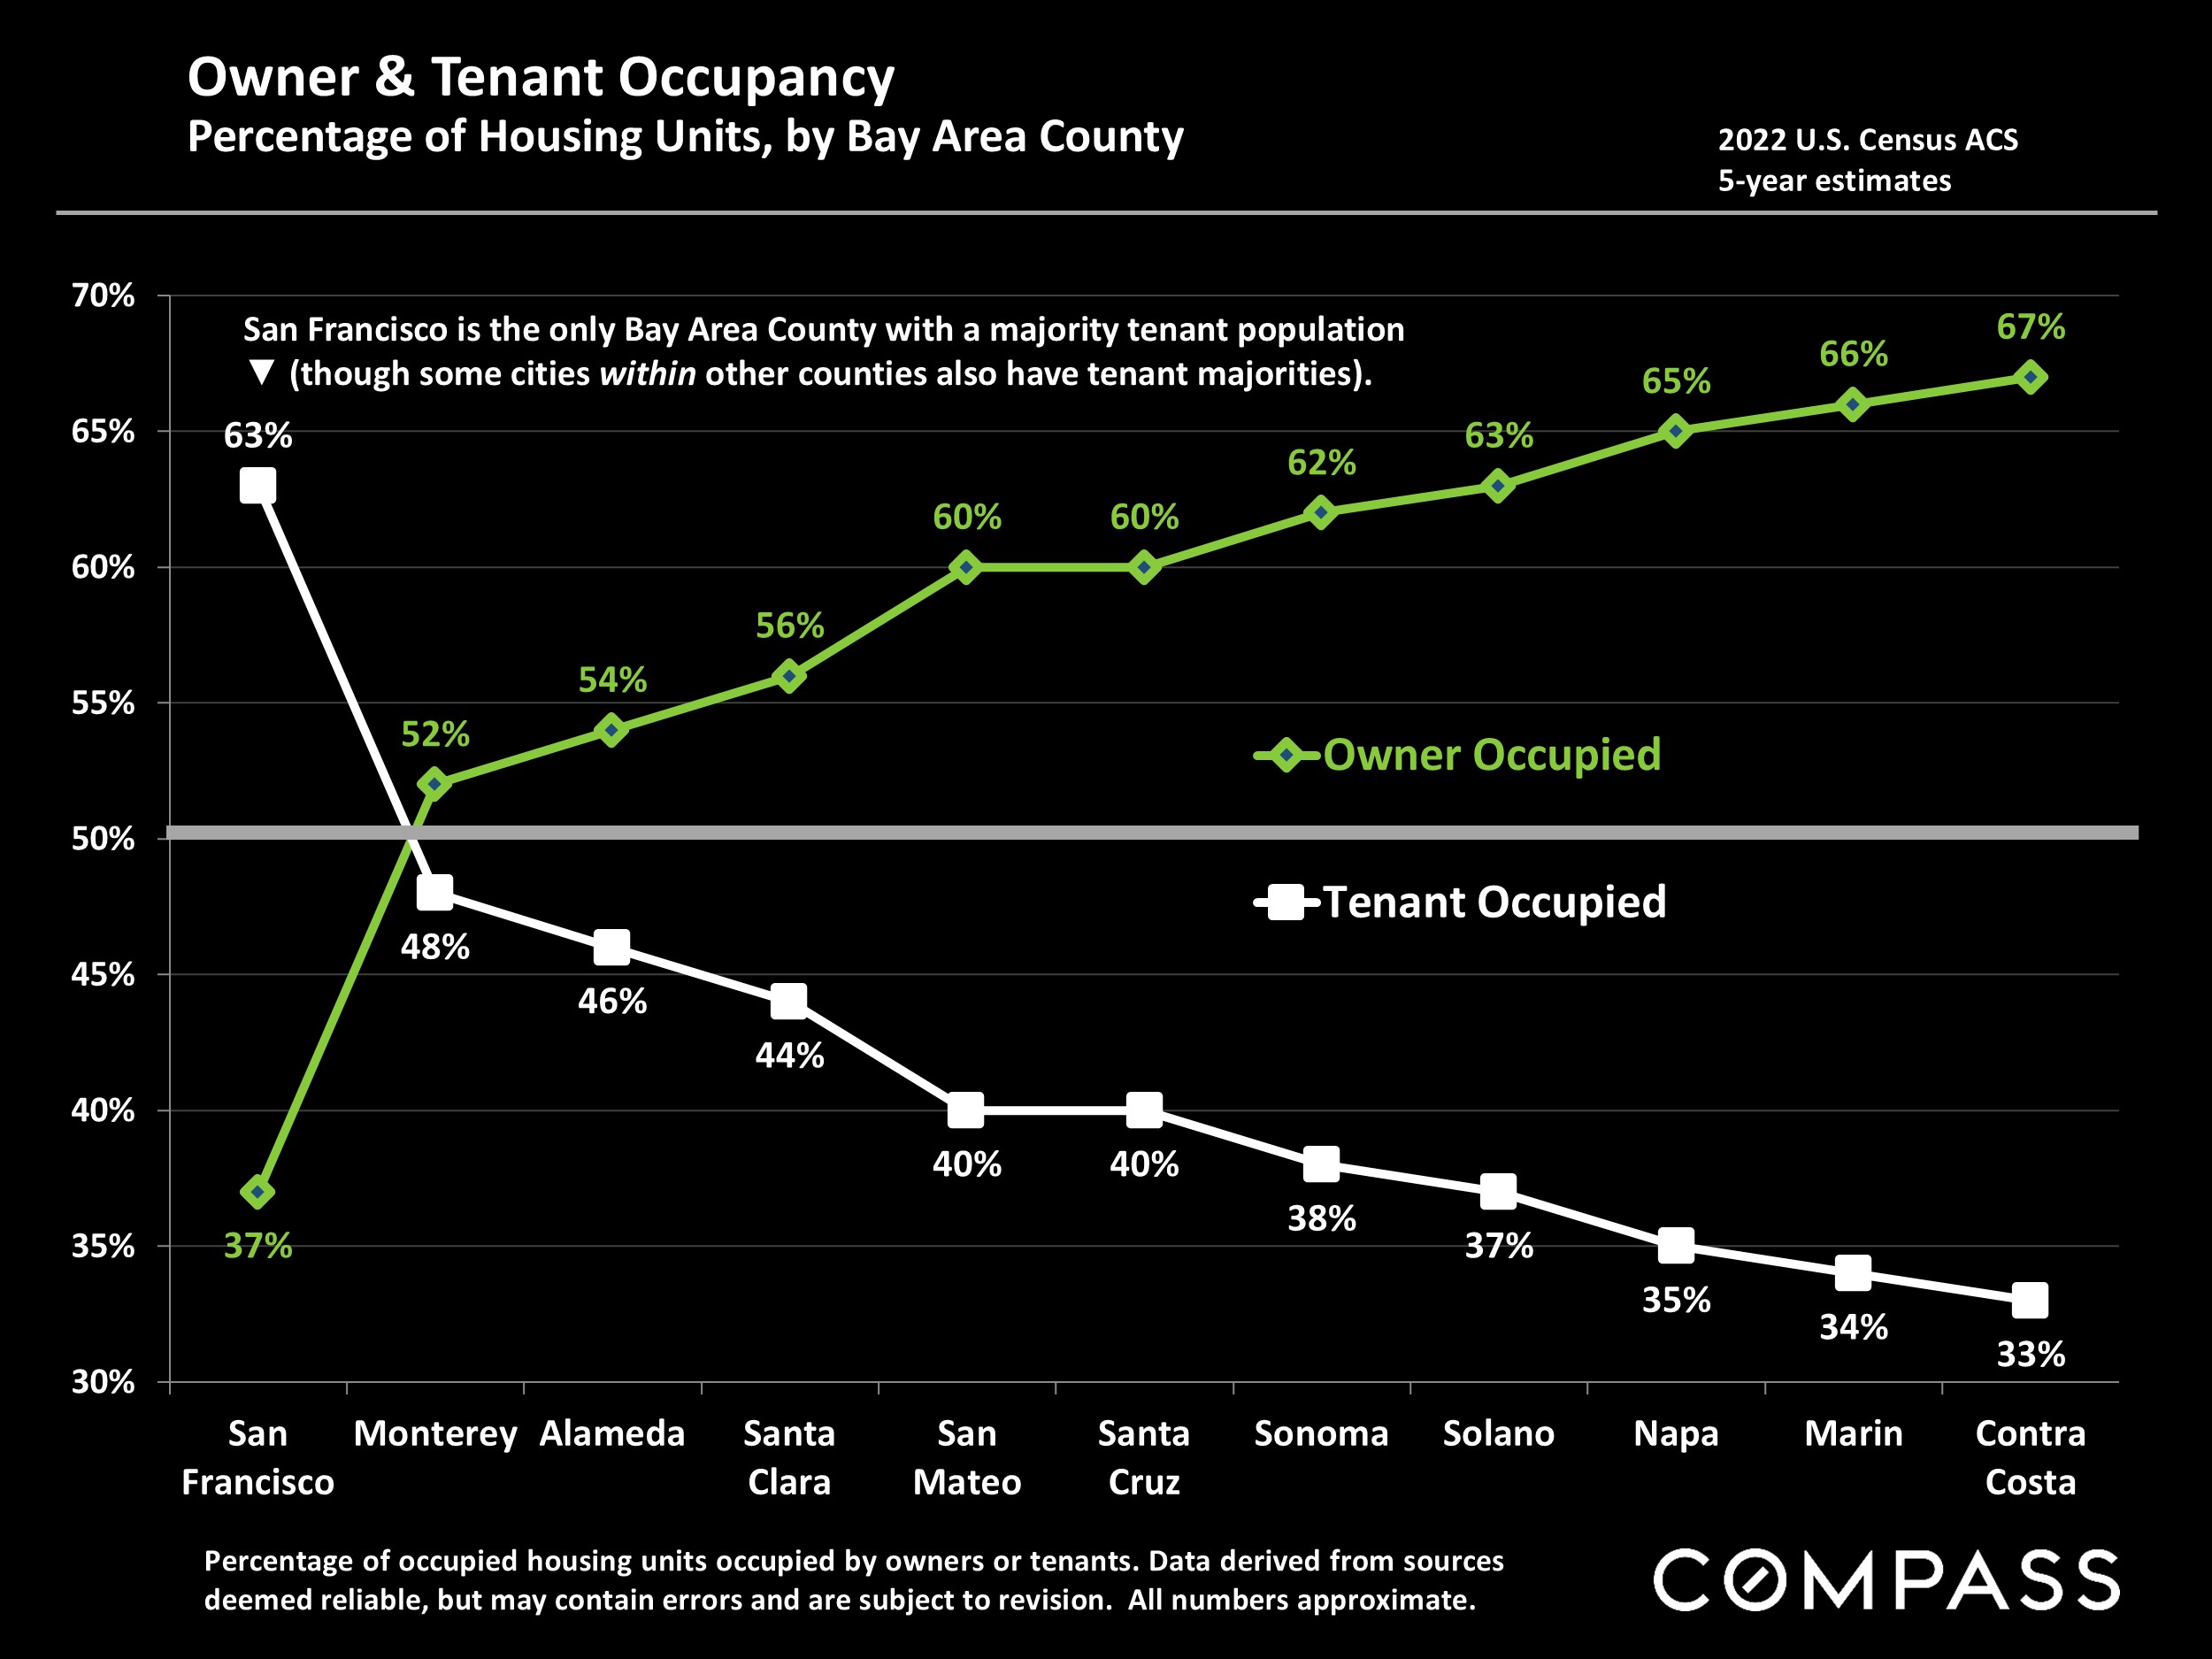
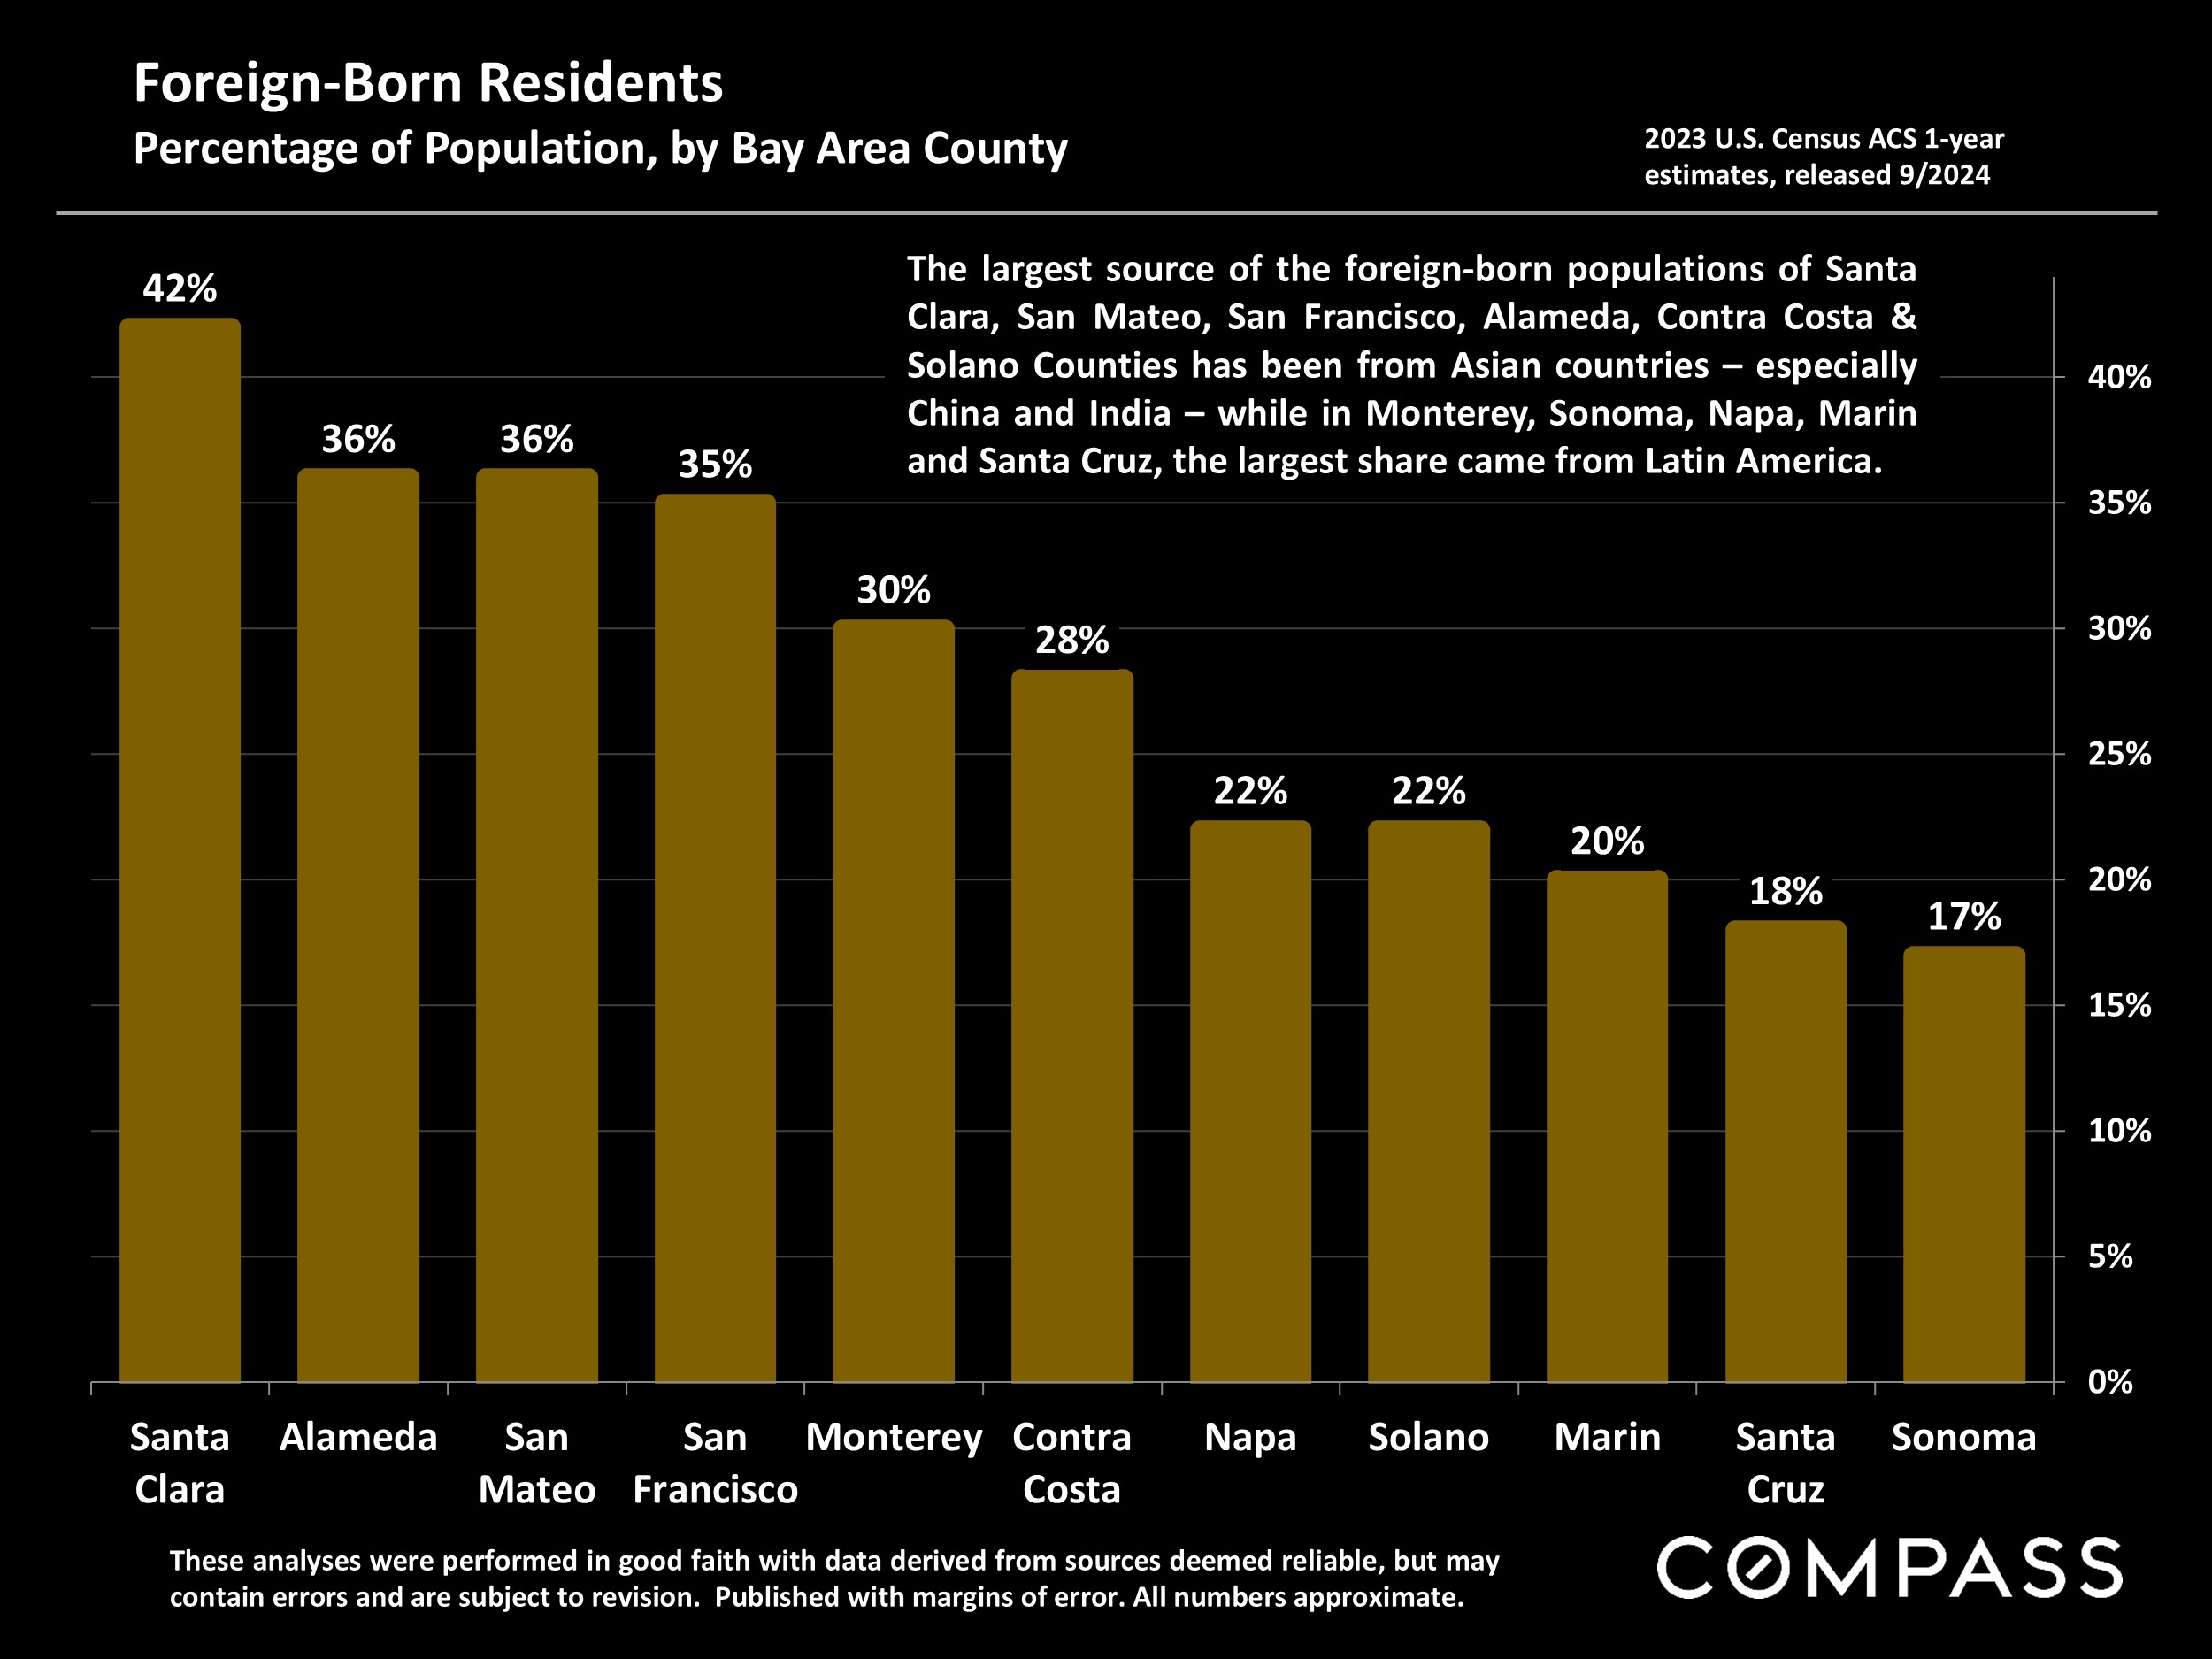
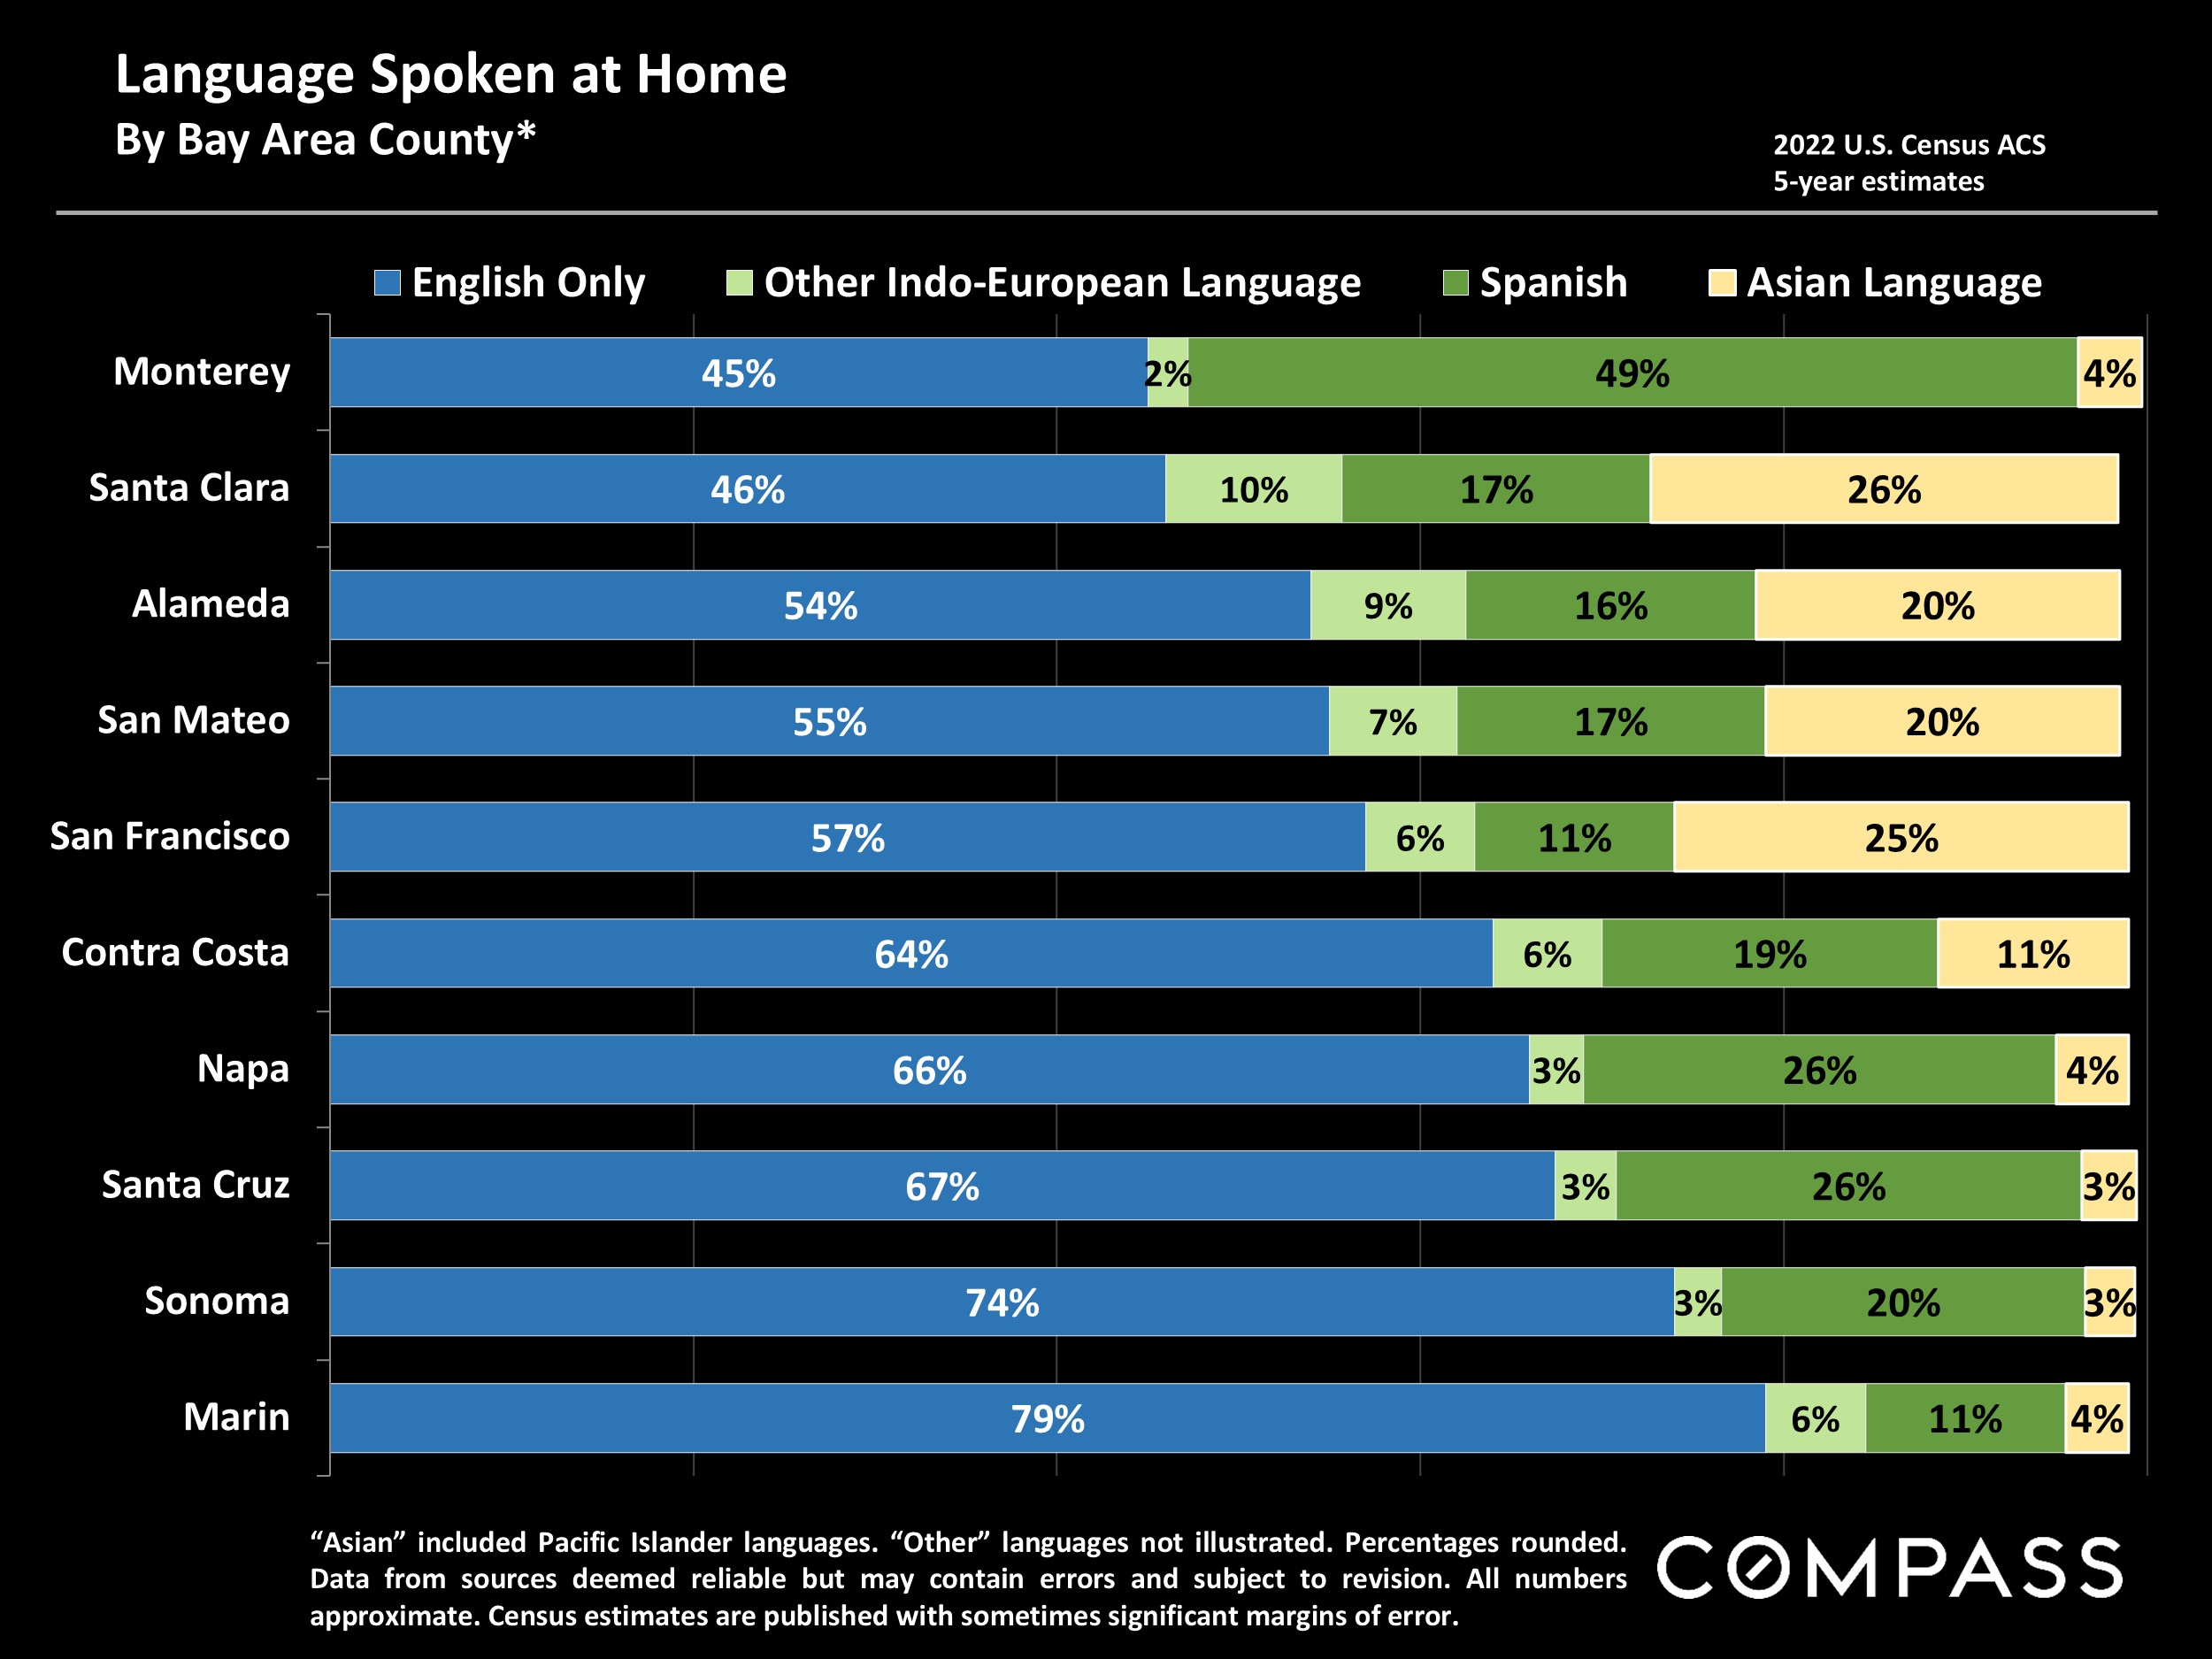
Mortgage Interest Rates in 2023-2024 30-Year Conforming Fixed-Rate Loans, Weekly Average Readings*Financial Markets in 2023-2024 Percentage Increases in S&P 500 & Nasdaq since 1/1/23San Francisco HOUSE Price Trends since 1990 Monthly Median House Sales Prices, 3-Month RollingSan Francisco CONDO Price Trends since 2005. Median Cono Price, 3 Month rollingSan Francisco CONDO Prices: Downtown vs. Non-Downtown 6-Month-Rolling, Median 2-Bedroom Condo Sales Prices since 2005*San Francisco Value Trends since 2005 3-Month-Rolling, Median Dollar per Square Foot Values*New Listings Coming on Market San Francisco Market Dynamics & SeasonalitySan Francisco: Homes for Sale Active/Coming-Soon Listings*San Francisco: Homes for Sale Active/Coming-Soon Listings by Realtor District*San Francisco Homes Market Active & Coming-Soon Listings on 15t of Month*Listings Accepting Offers (Going into Contract) San Francisco Market Dynamics & SeasonalityPercentage of Listings Accepting Offers San Francisco: Absorption Rate by MonthPrice Reductions on Active Listings San Francisco Market Dynamics & SeasonalityMonthly Home Sales Volume* San Francisco Market Dynamics & SeasonalitySan Francisco: Not Every Home Sells Listings Taken Off Market Without Selling*San Francisco Luxury House Sales* Houses Selling for $5 Million+ since 2018San Francisco Luxury Condo & Co-op Sales* Units Selling for $2.5 Million+ since 2018Average Days on Market - Speed of Sale San Francisco Market Dynamics & SeasonalityOverbidding List Prices in San Francisco Percentage of Home Sales Closing over List PriceAverage Sales Price to Original List Price Percentage San Francisco Over/Under Bidding: Market Dynamics & SeasonalityCalifornia 2023 Migration Trends*Bay Area Housing Number of Housing Units by CountyMedian House Sales Prices by Bay Area County, 2024 YTD Sales through Q3Median House Dollar per Square Foot Value by Bay Area County, 2024 YTD Sales through Q3Median 2-Bedroom Condo Sales Prices by Bay Area County, 2024 YTD Sales through Q3San Francisco Bay Area Home Sales 2024 YTD, Percentage of Sales by Price Segment*Bay Area Population Trends 2010 - 2023, by CountyBay Area County Sizes Land Area in Square MilesBay Area Population Density Residents per Square Mile by CountyEducational Attainment by Bay Area County Bachelor & Graduate/Professional DegreesOwner & Tenant Occupancy Percentage of Housing Units, by Bay Area CountyForeign-Born Residents Percentage of Population, by Bay Area CountyLanguage Spoken at Home By Bay Area County*

Want to learn more about Bay Area market trends?

Let’s connect! With relationships and networks across the city, there are a variety of ways I can help you make informed real estate decisions. Call, email, or text – I’m here to help.


Contact