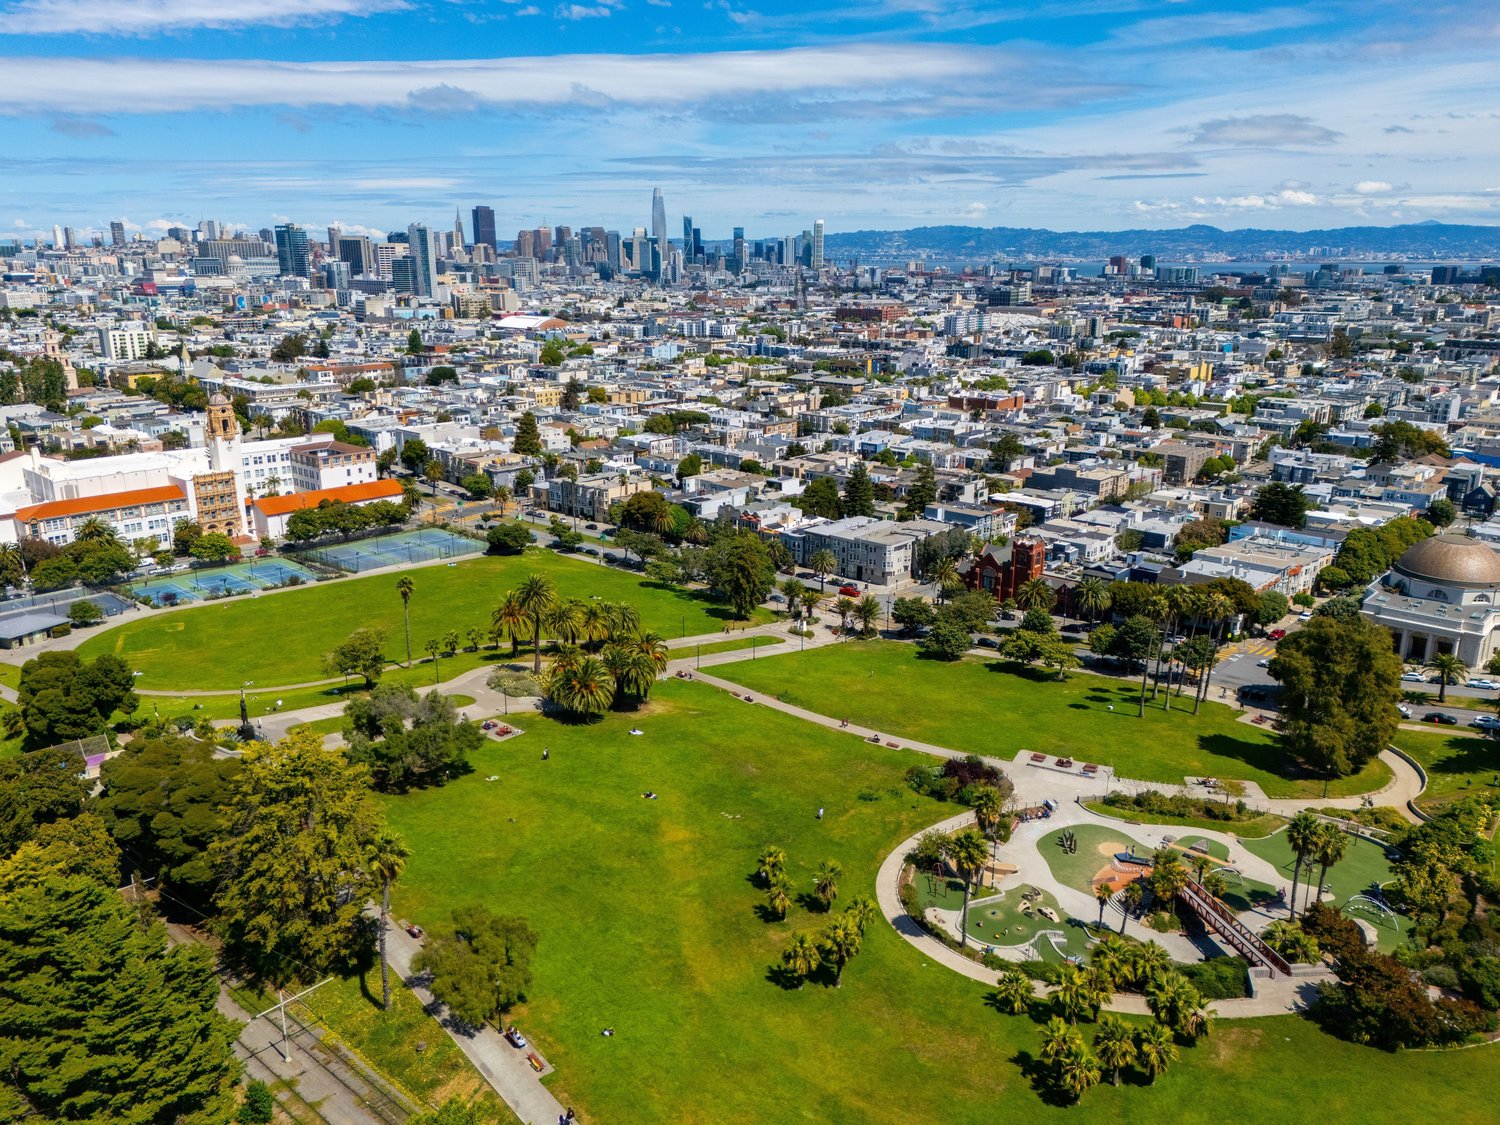
Feature image for SF: November 2026 Market Stats

November 12, 2026

SF: November 2026 Market Stats

By Compass

San Francisco Recap

Overall Market Sentiment

San Francisco's single-family market was exceptionally tight in October. Active listings fell 20% from a year ago to 222, leaving 0.9 months of supply, and homes sold in 14 days on average, the fastest of any month since at least 2020. 86% of homes sold above list, up 9%, the highest October level since at least 2020. The median rose 29% to $2,390,000, the highest of any month since at least 2020. Condos were also strong, with overbidding at 68%, though condo price cuts rose from a low base.

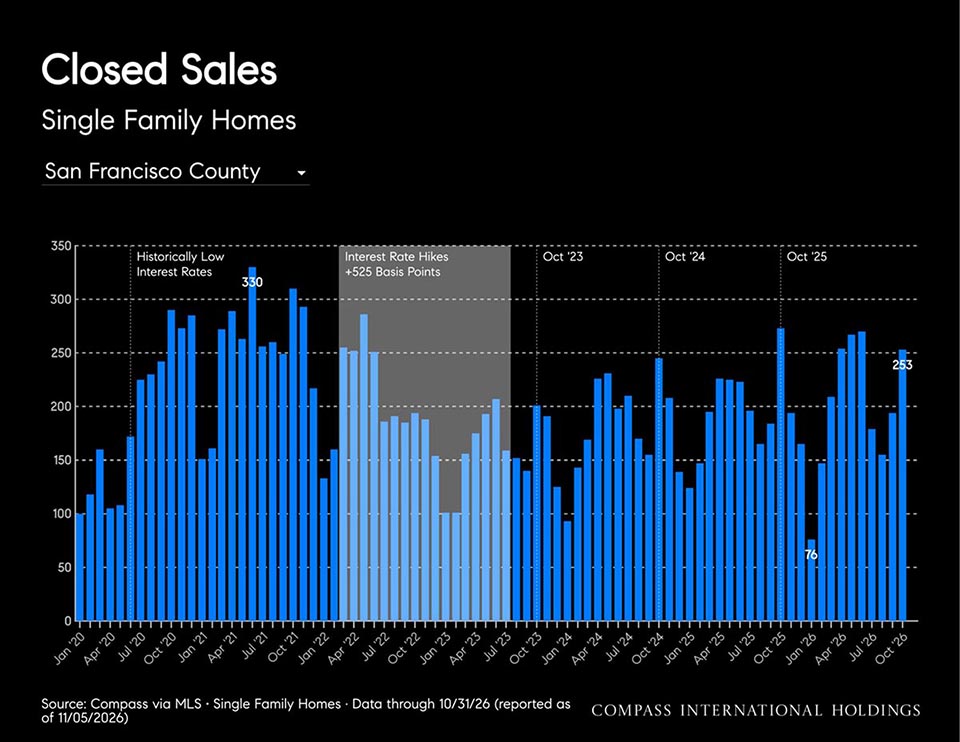
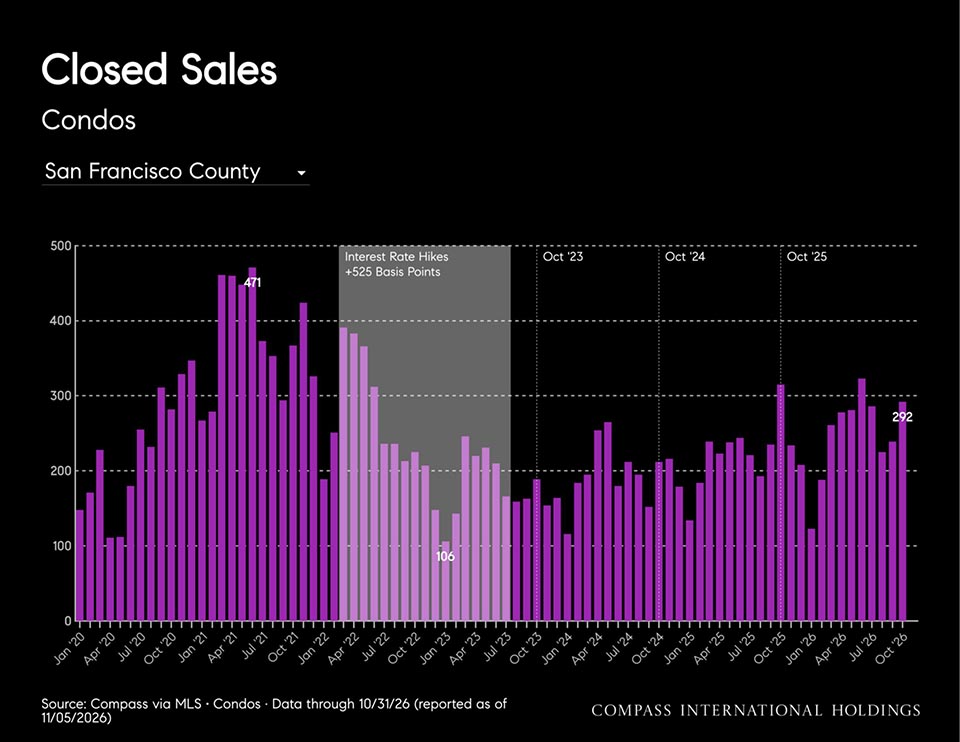
  • Sales: 253 single-family homes closed in October, down 7% YoY and up 30% from September. Condo closings fell 7% YoY to 292.

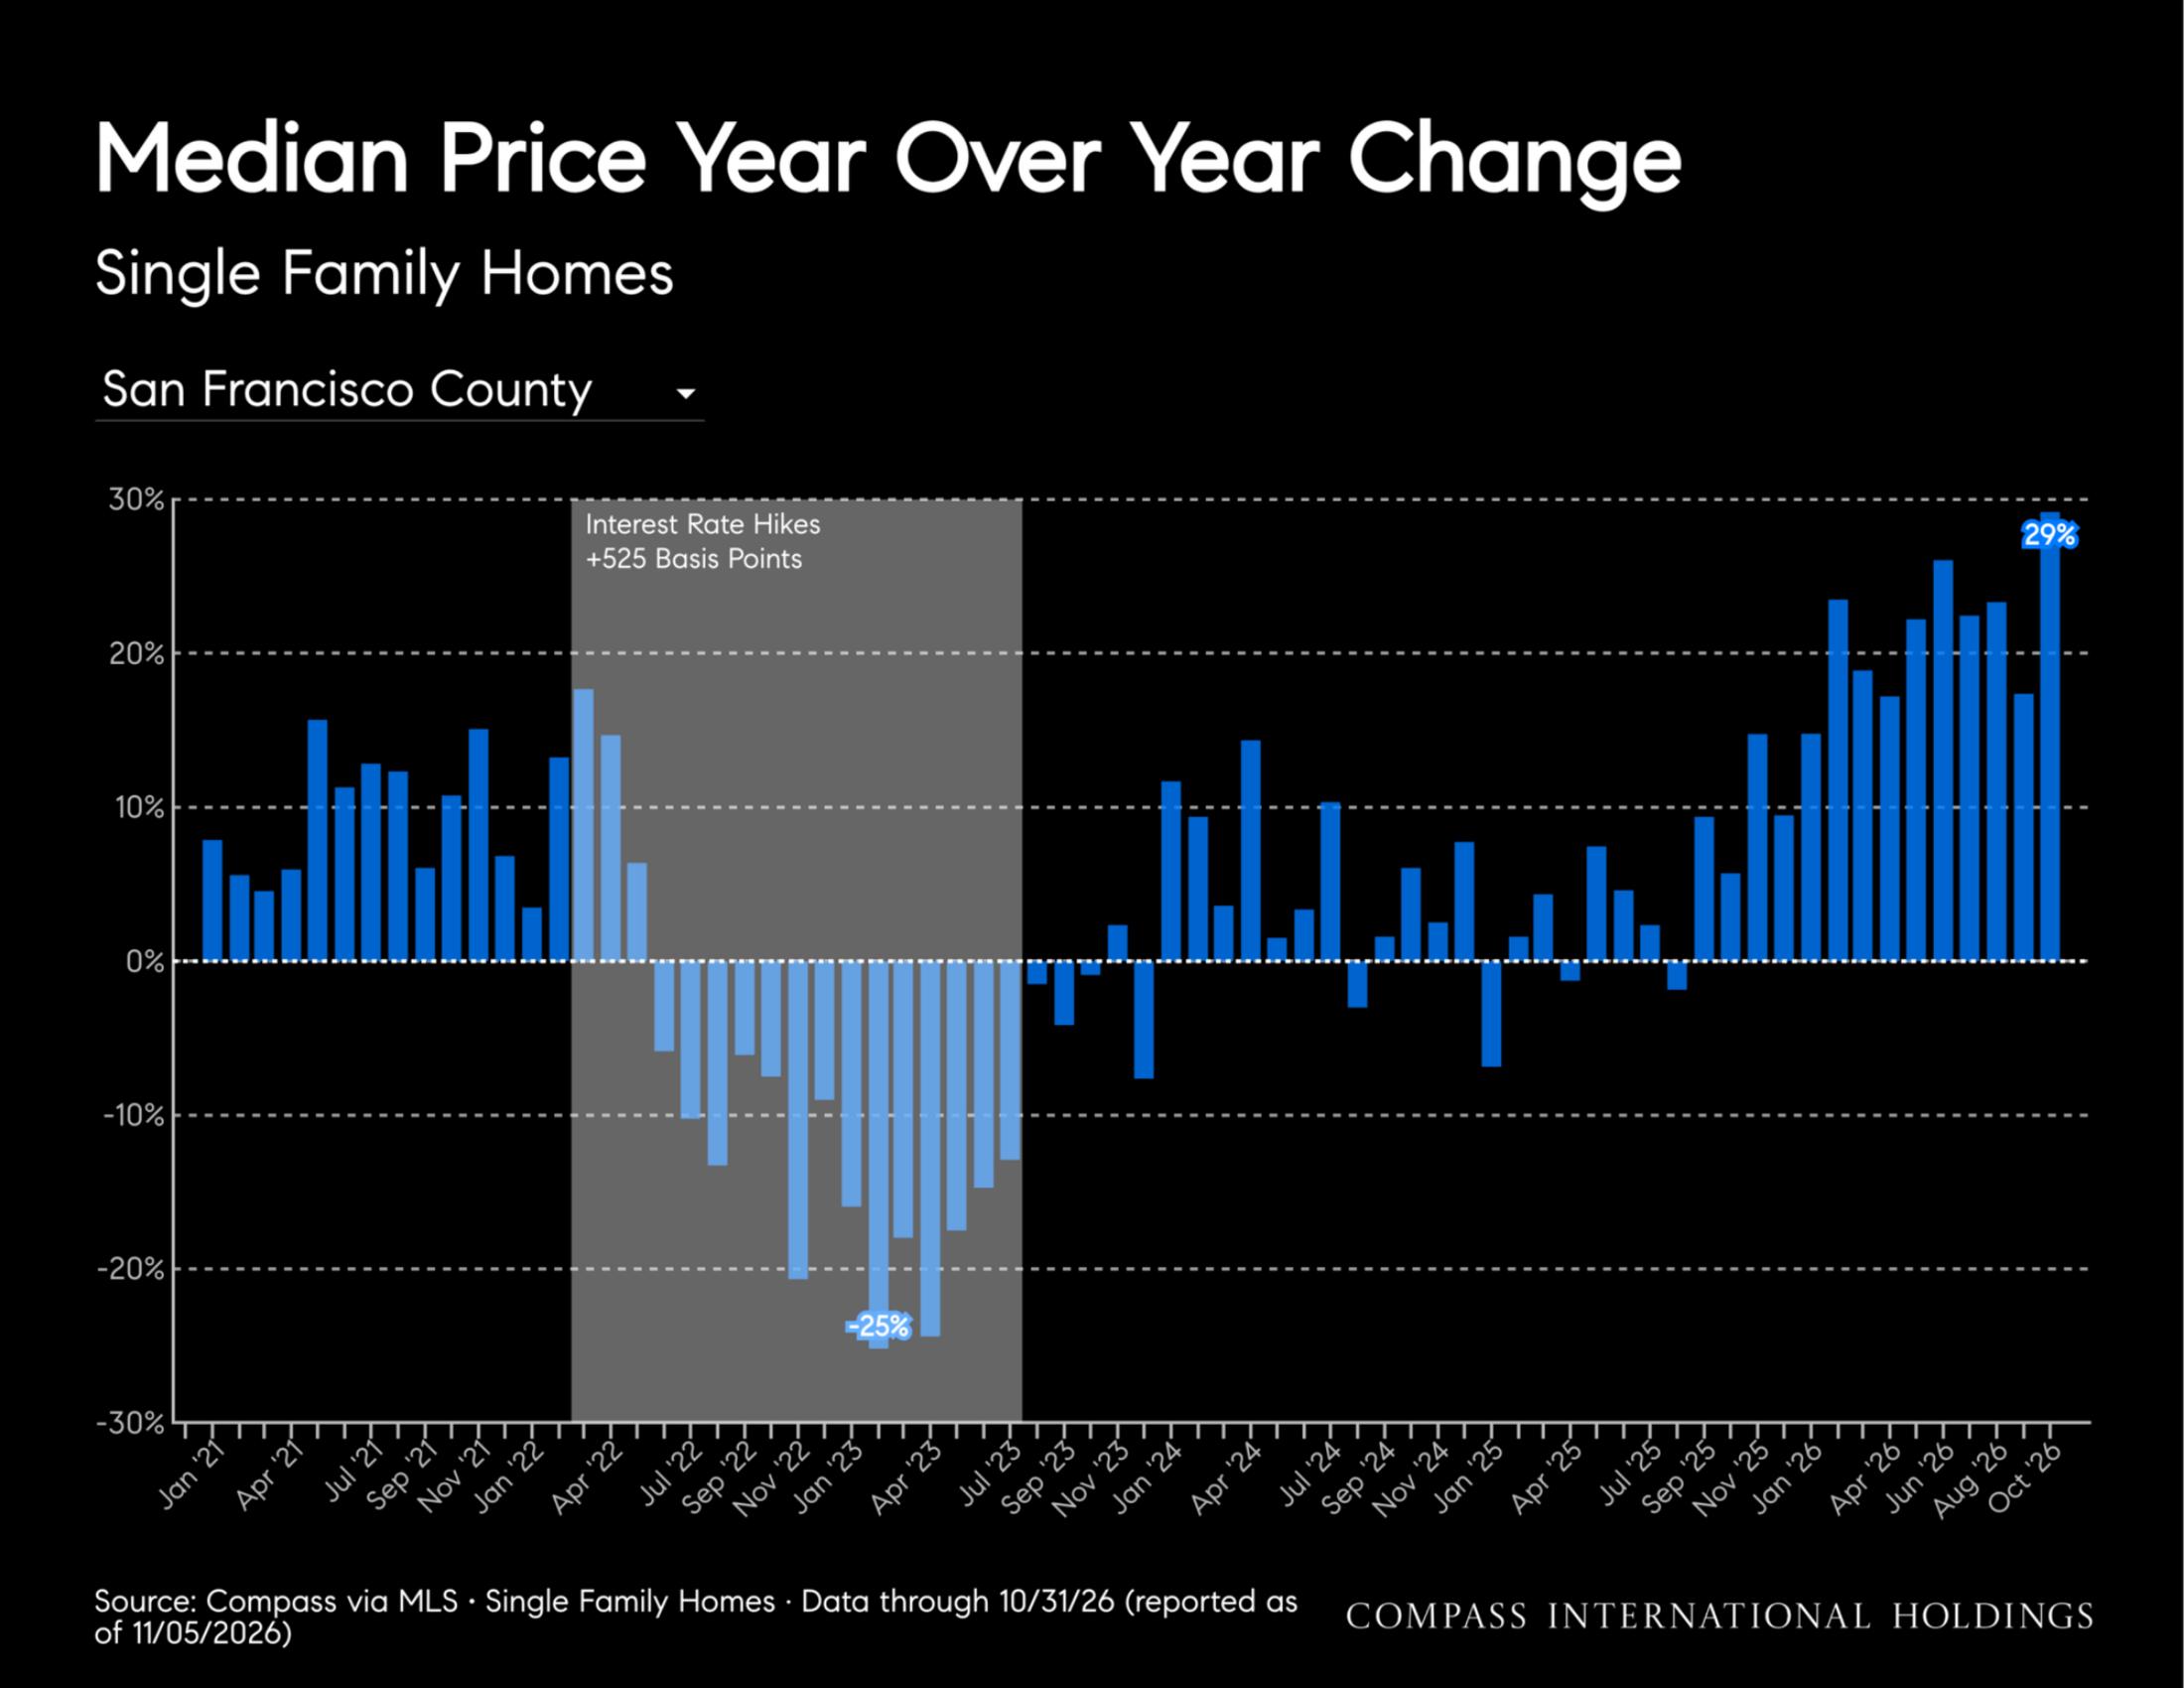
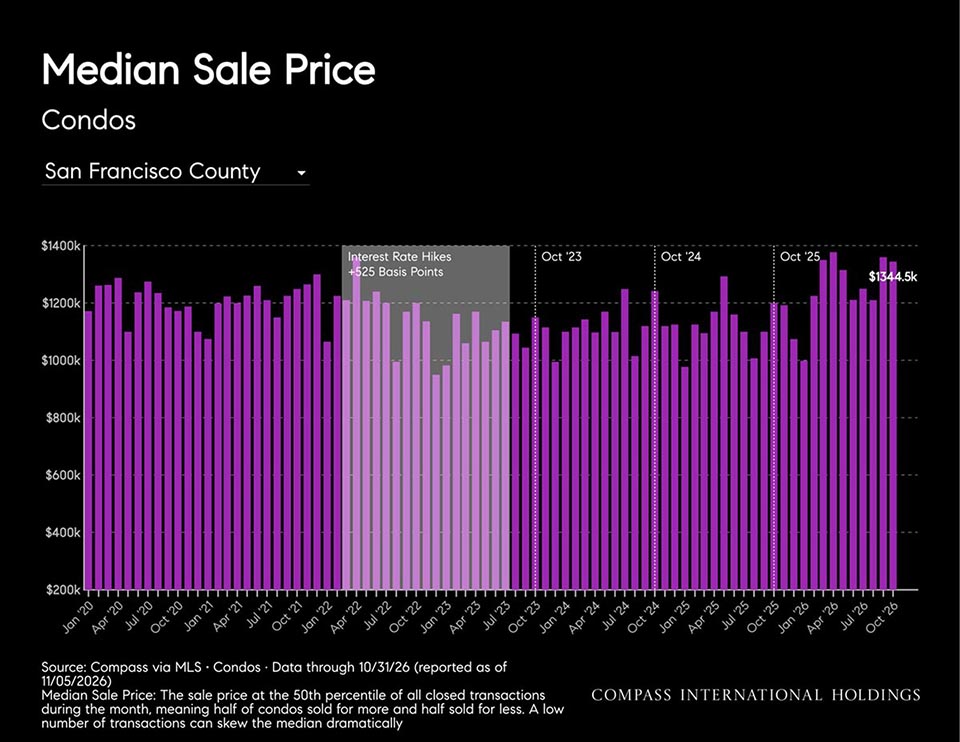
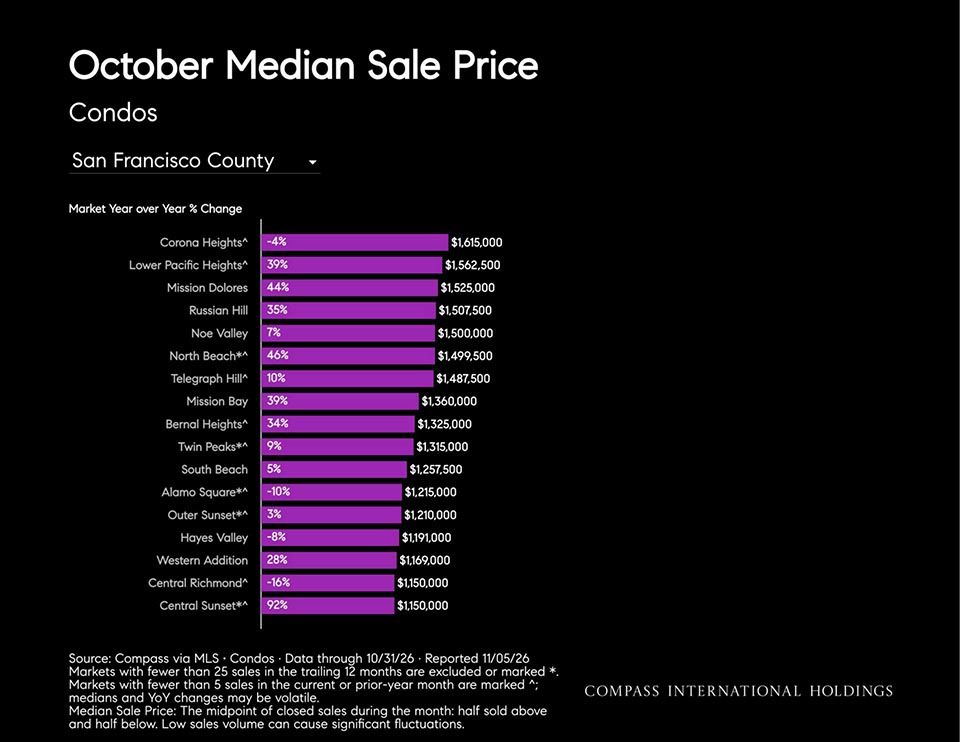
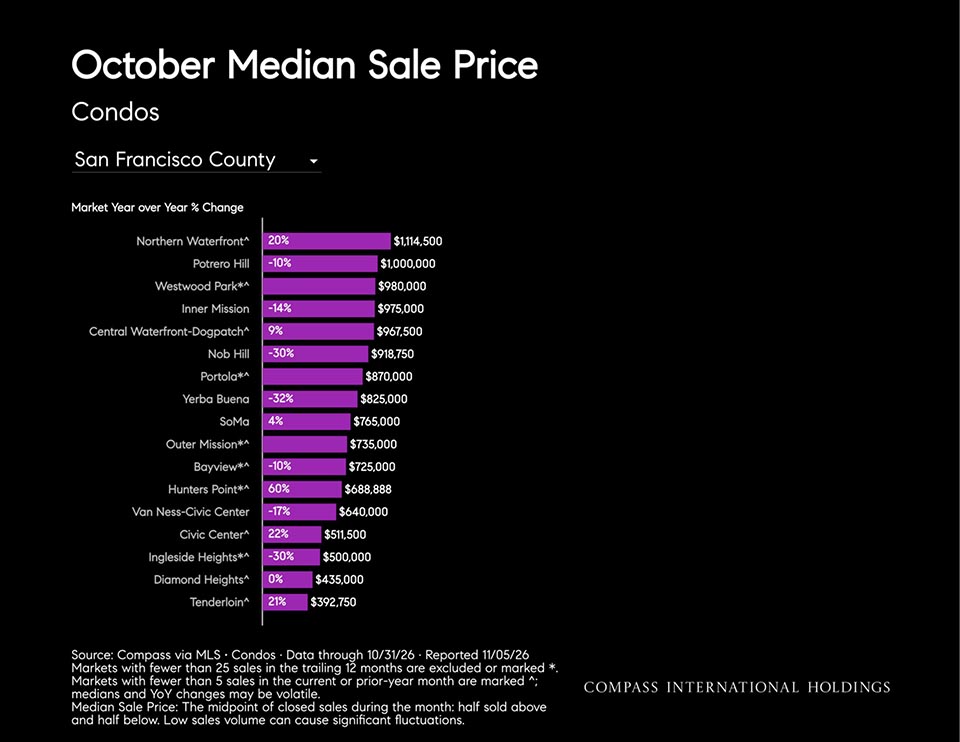
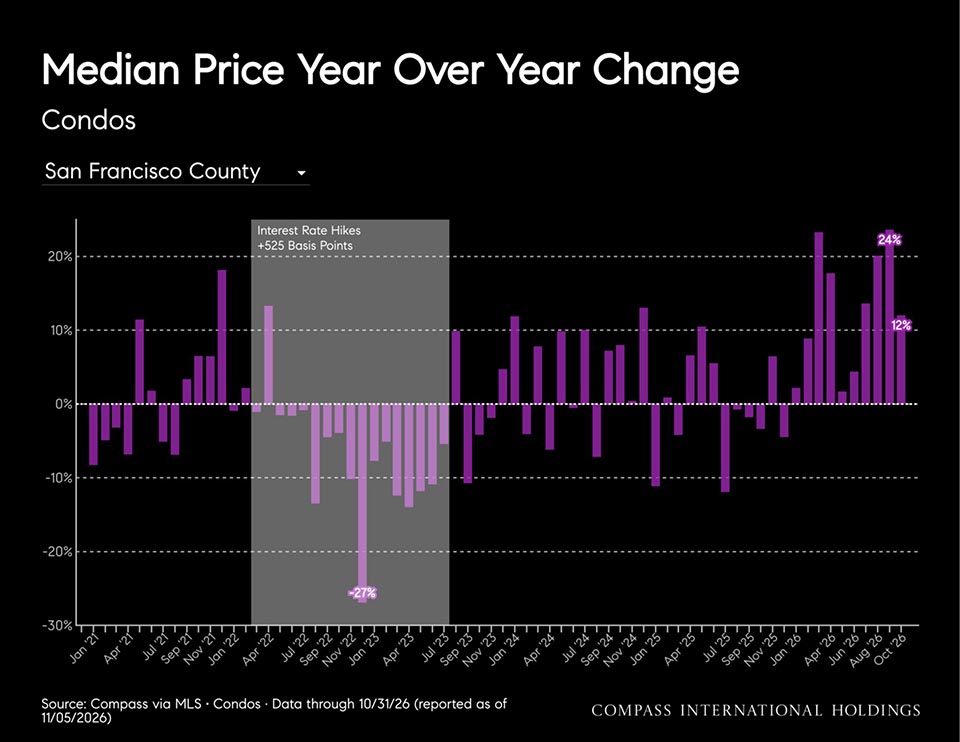
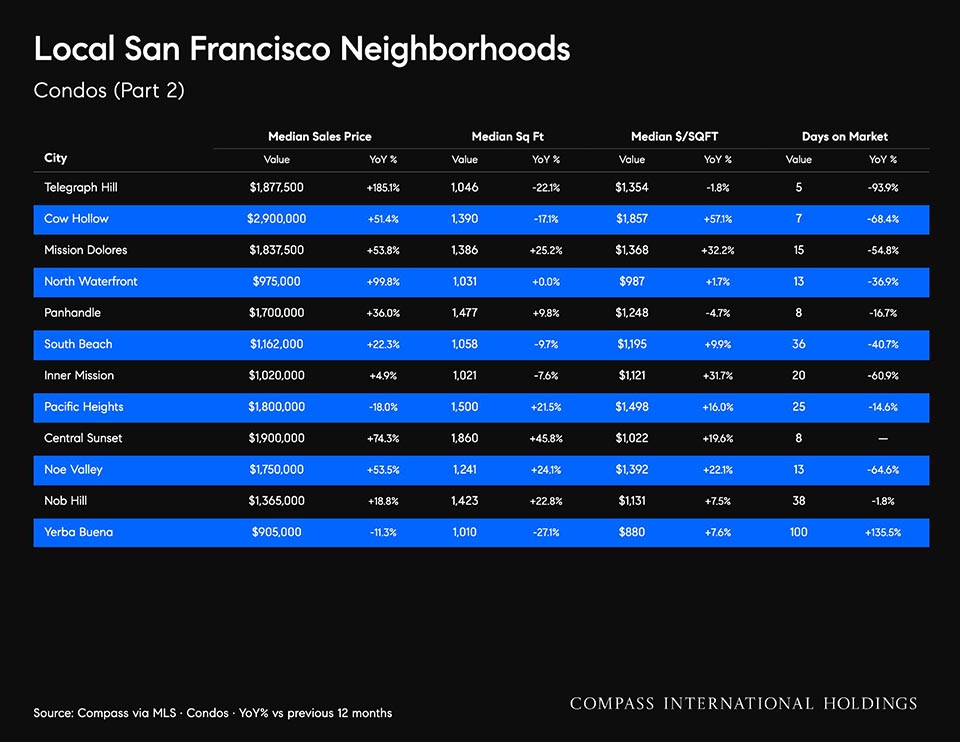
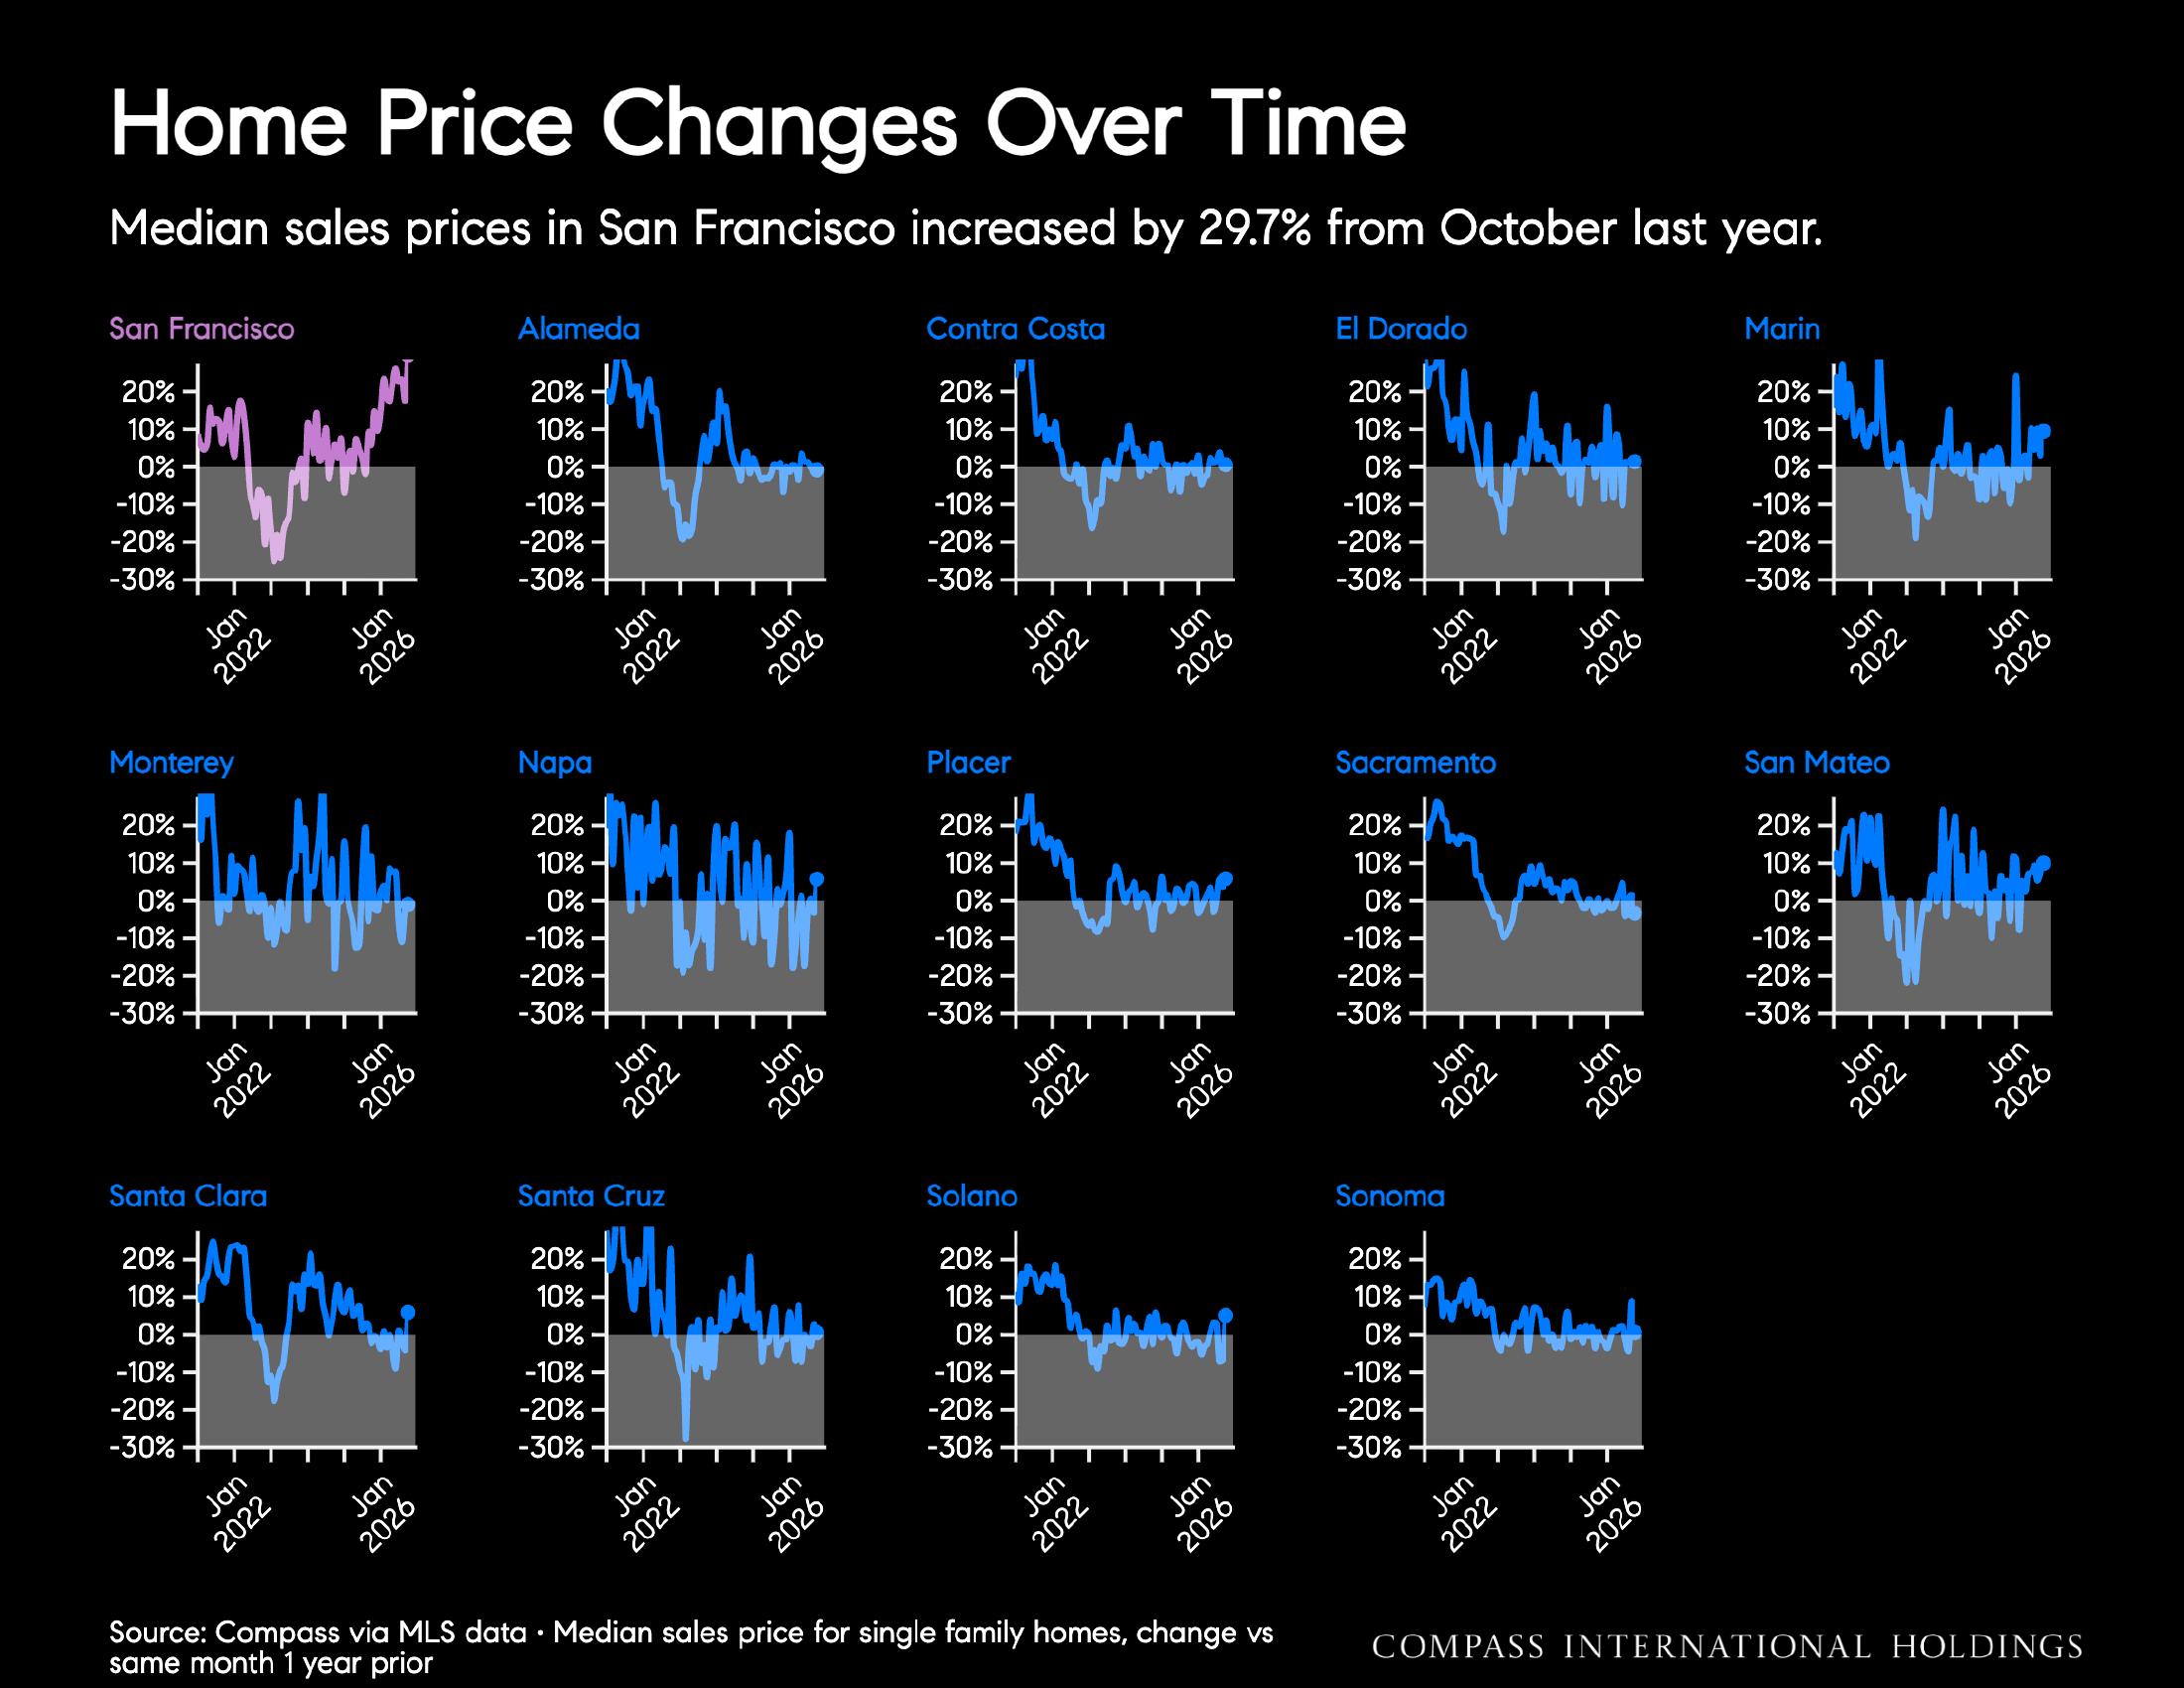
  • Prices: The single-family median rose 29% YoY to $2,390,000. The condo median rose 12% YoY to $1,344,500, the highest October median since at least 2020.

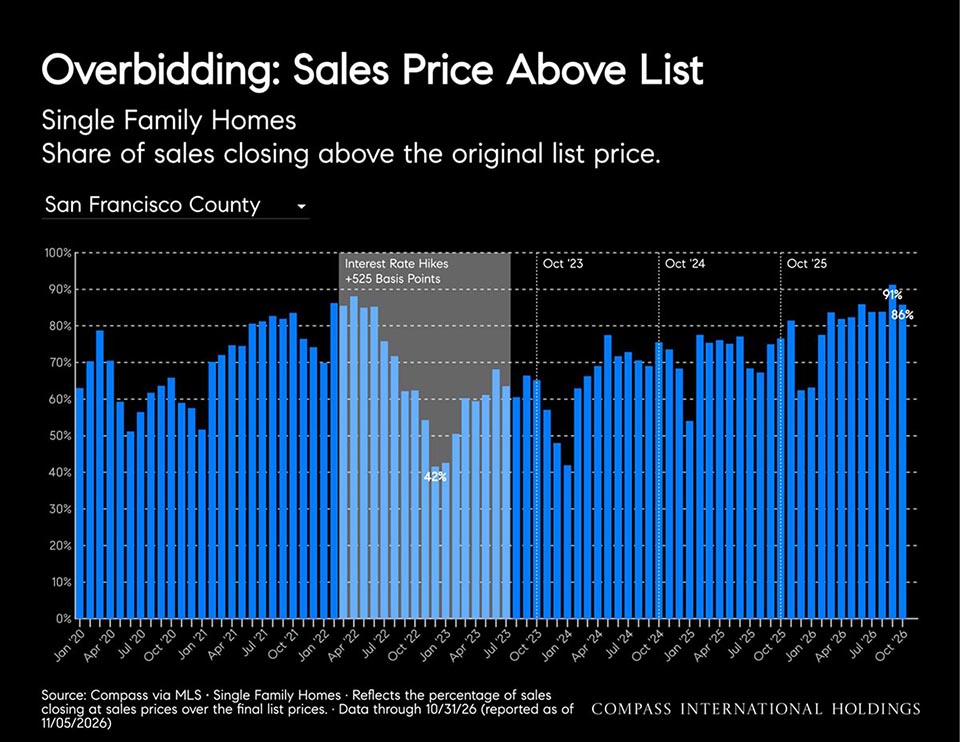
  • Competition: 86% of single-family sales closed above list, up 9% YoY. Condo overbidding was 68%, up 25%; both are the highest October levels since at least 2020.

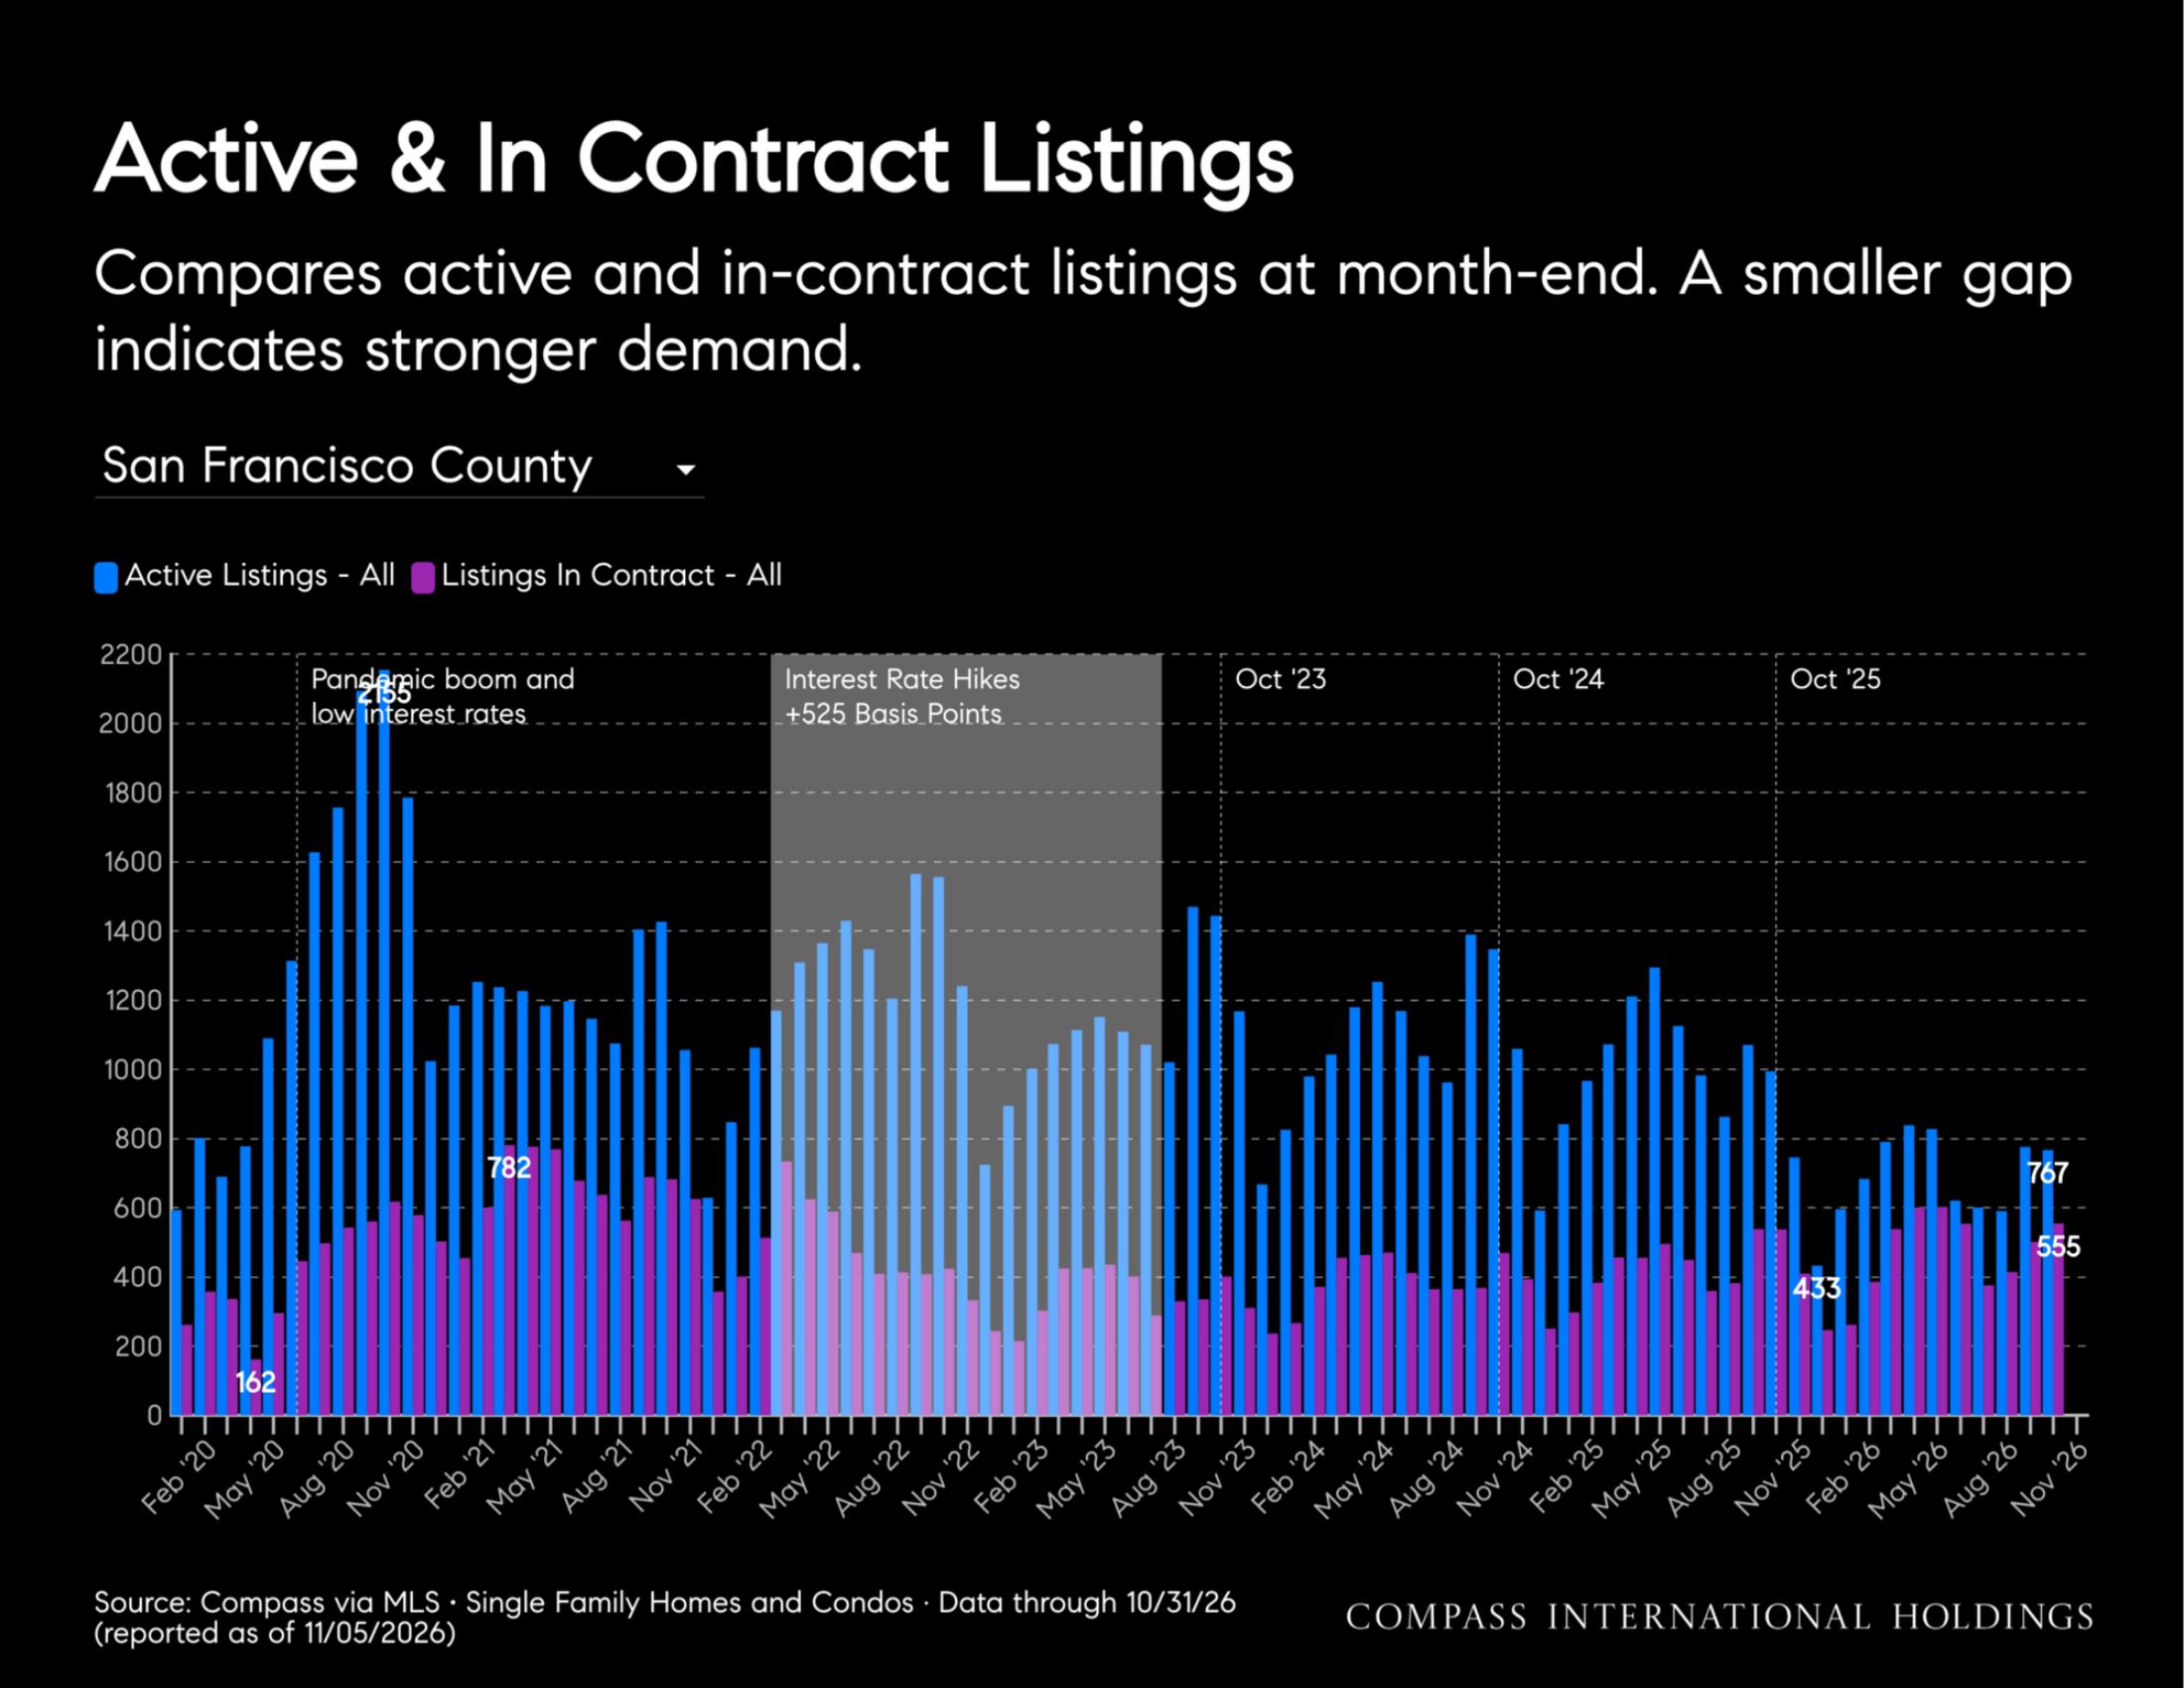
  • Inventory: Active single-family listings fell 20% YoY to 222, while new listings rose 5% to 287. Condo active listings fell 24% to 545. Both active counts are the lowest October levels since at least 2020.

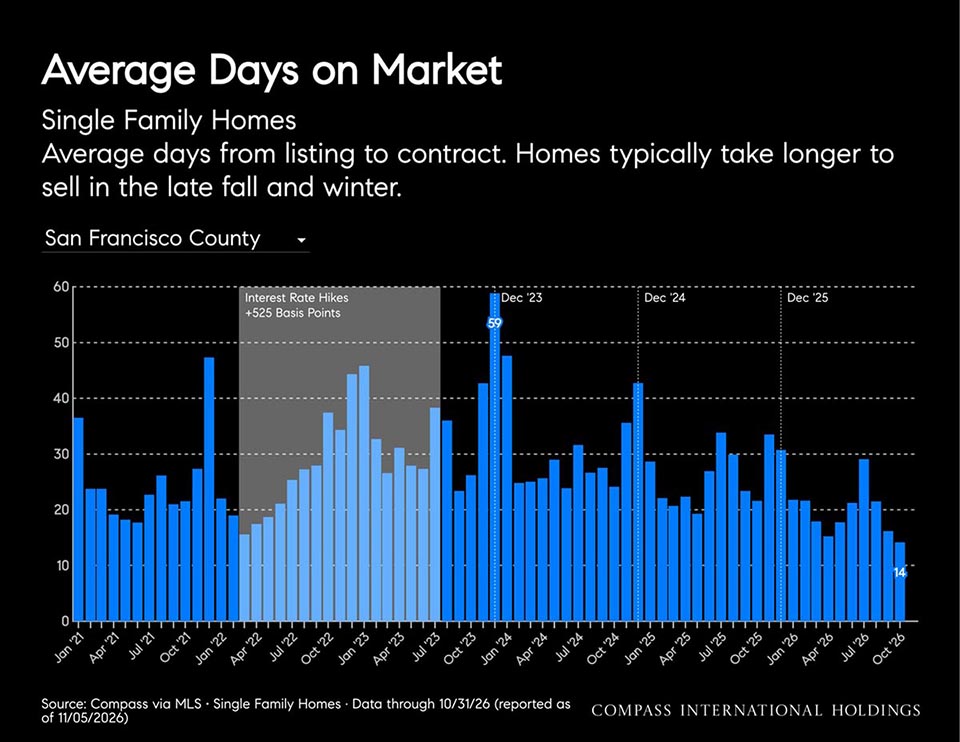
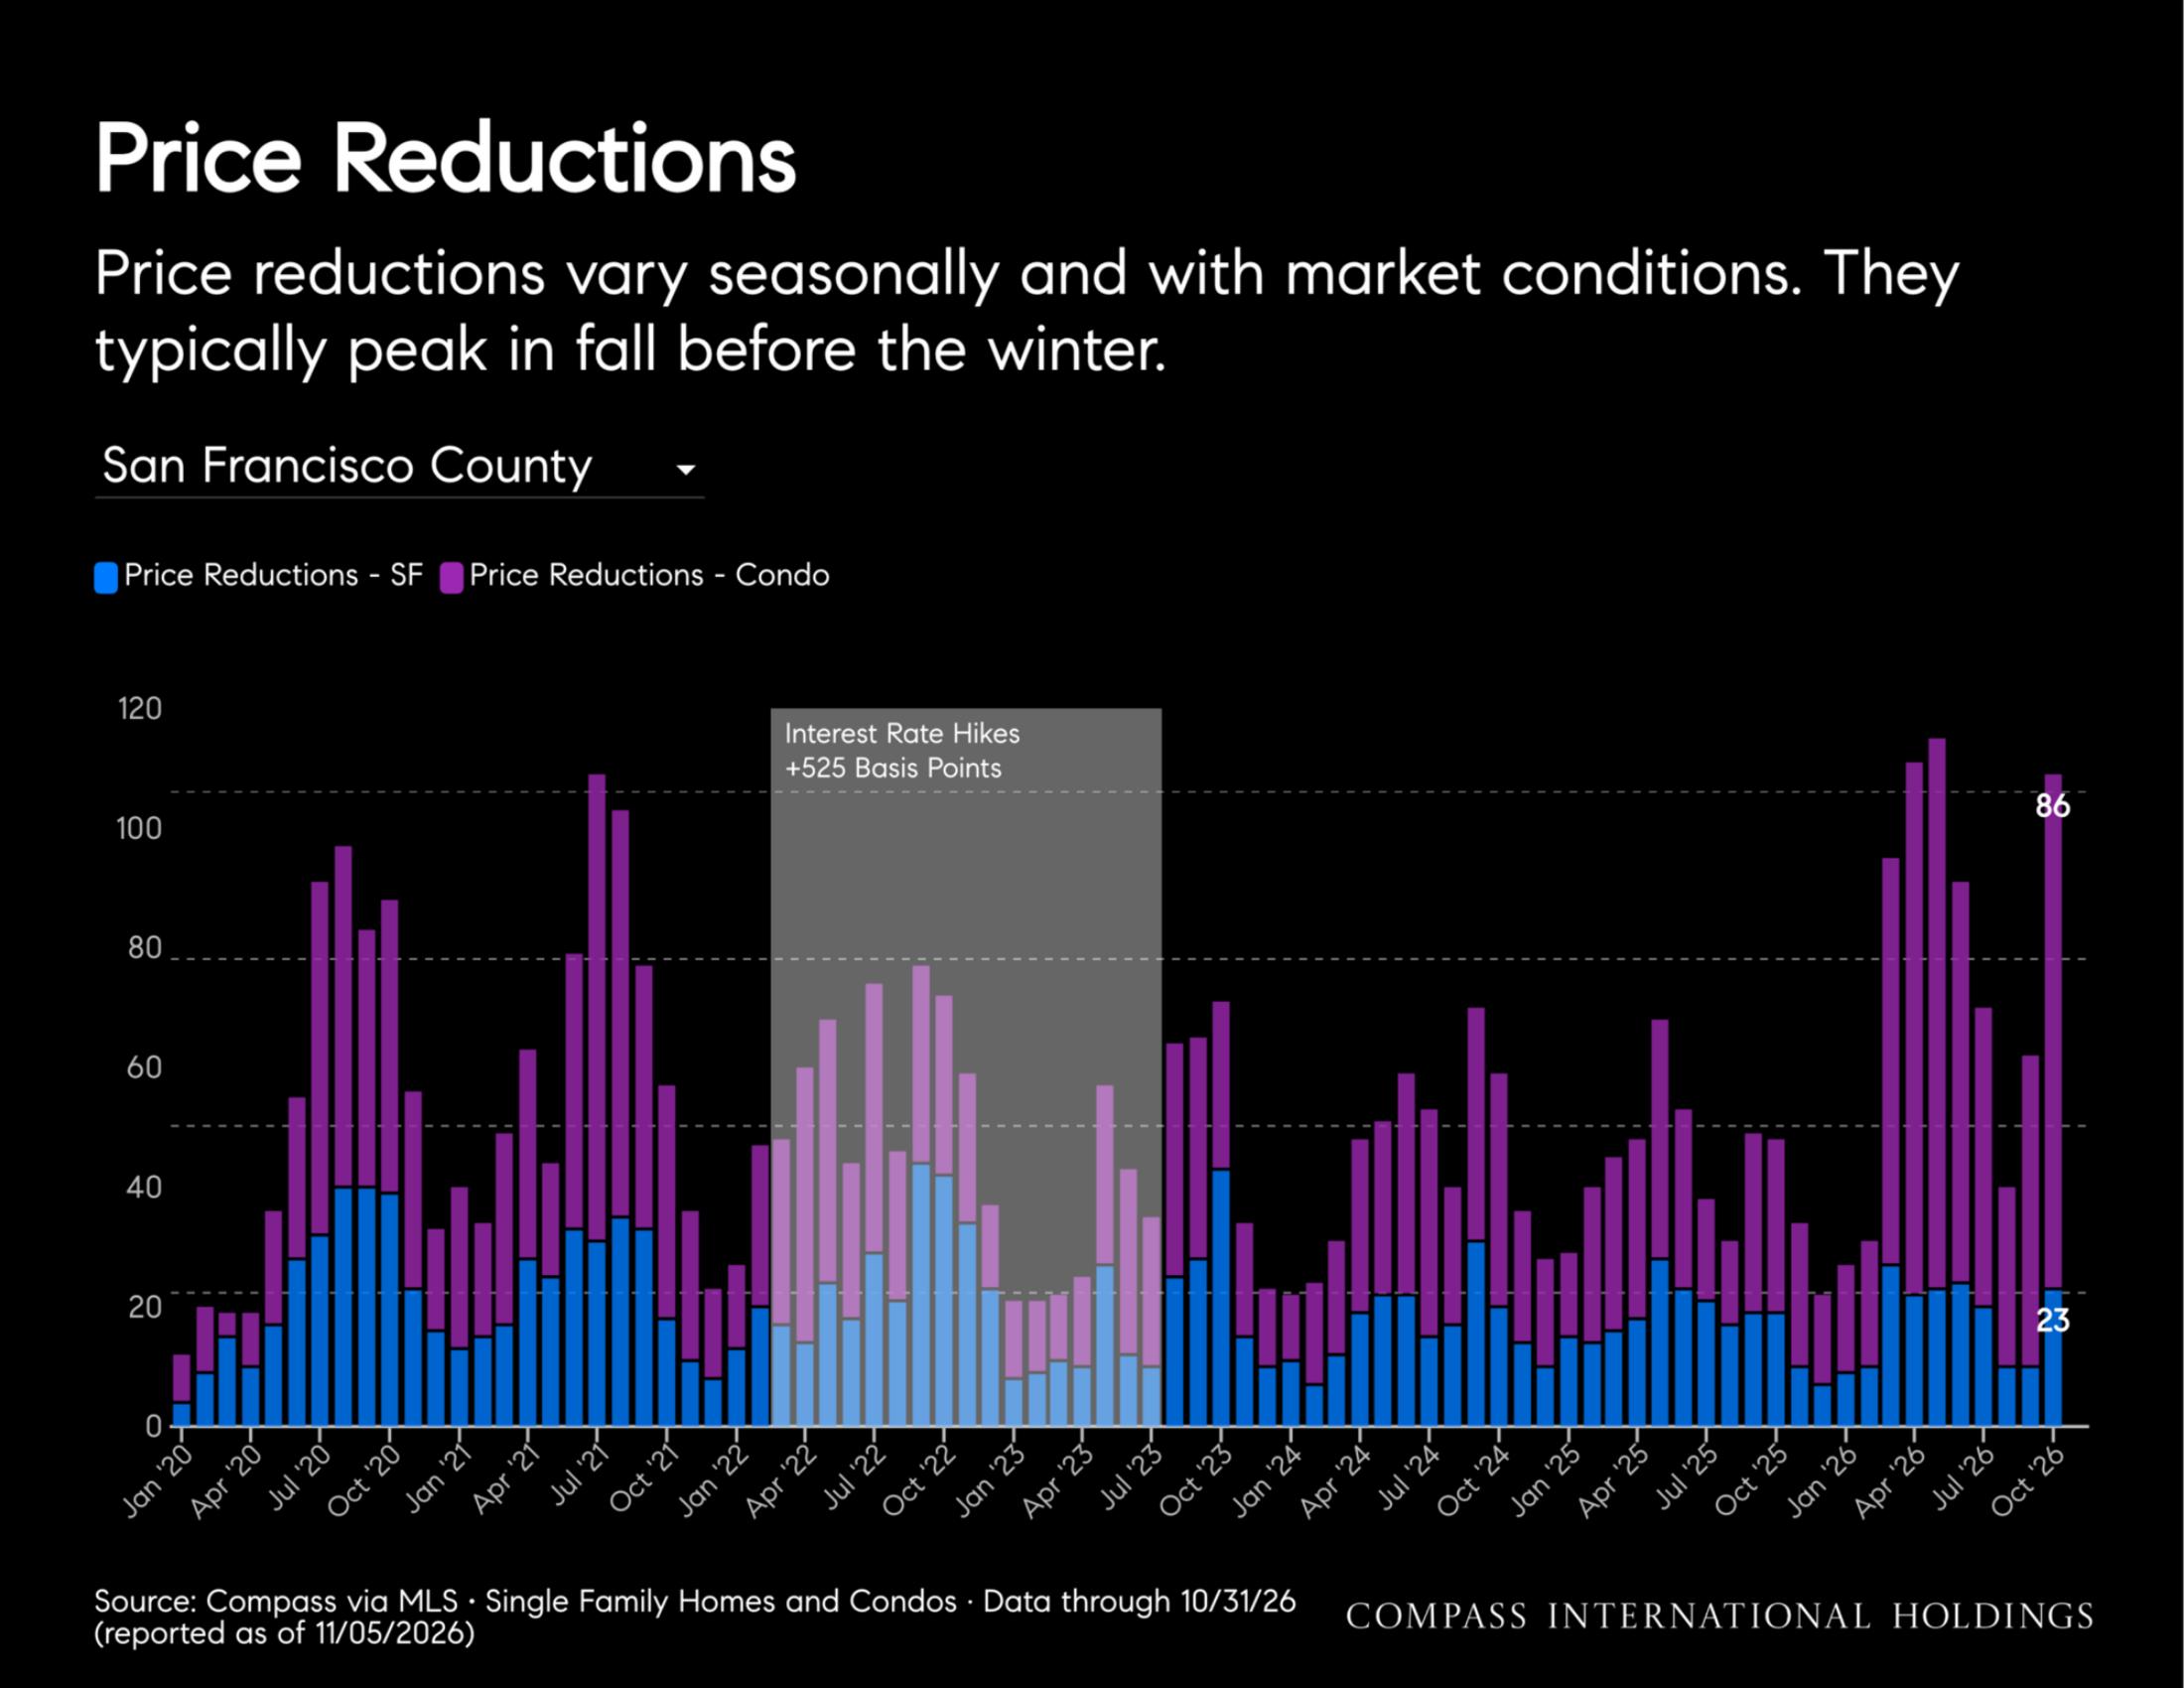
  • Single family: Days on market fell to 14 days from 22 a year ago, while months of supply was 0.9, the lowest October level since at least 2020. Price reductions rose to 23 from 19, with the reduction rate at 7%.

  • Condos: Condo supply fell to 1.9 months from 2.3 and condo days on market fell 16% to 36. Price cuts rose from a low base: 18% of condo listings took one, up 13%, the highest October level since at least 2020.

  • MoM: Single-family closings rose 30% from September and the median rose 16%, while months of supply fell to 0.9 from 1.2. Overbidding eased 5% to 86%. Condo price reductions rose 65%.

  • Bottom line: A very tight, highly competitive market for both property types; rising condo price cuts are the one sign of buyer pushback.

• • Data quality: A 16% one-month rise in the single-family median likely reflects the mix of homes sold, so the 29% YoY gain should be interpreted cautiously.
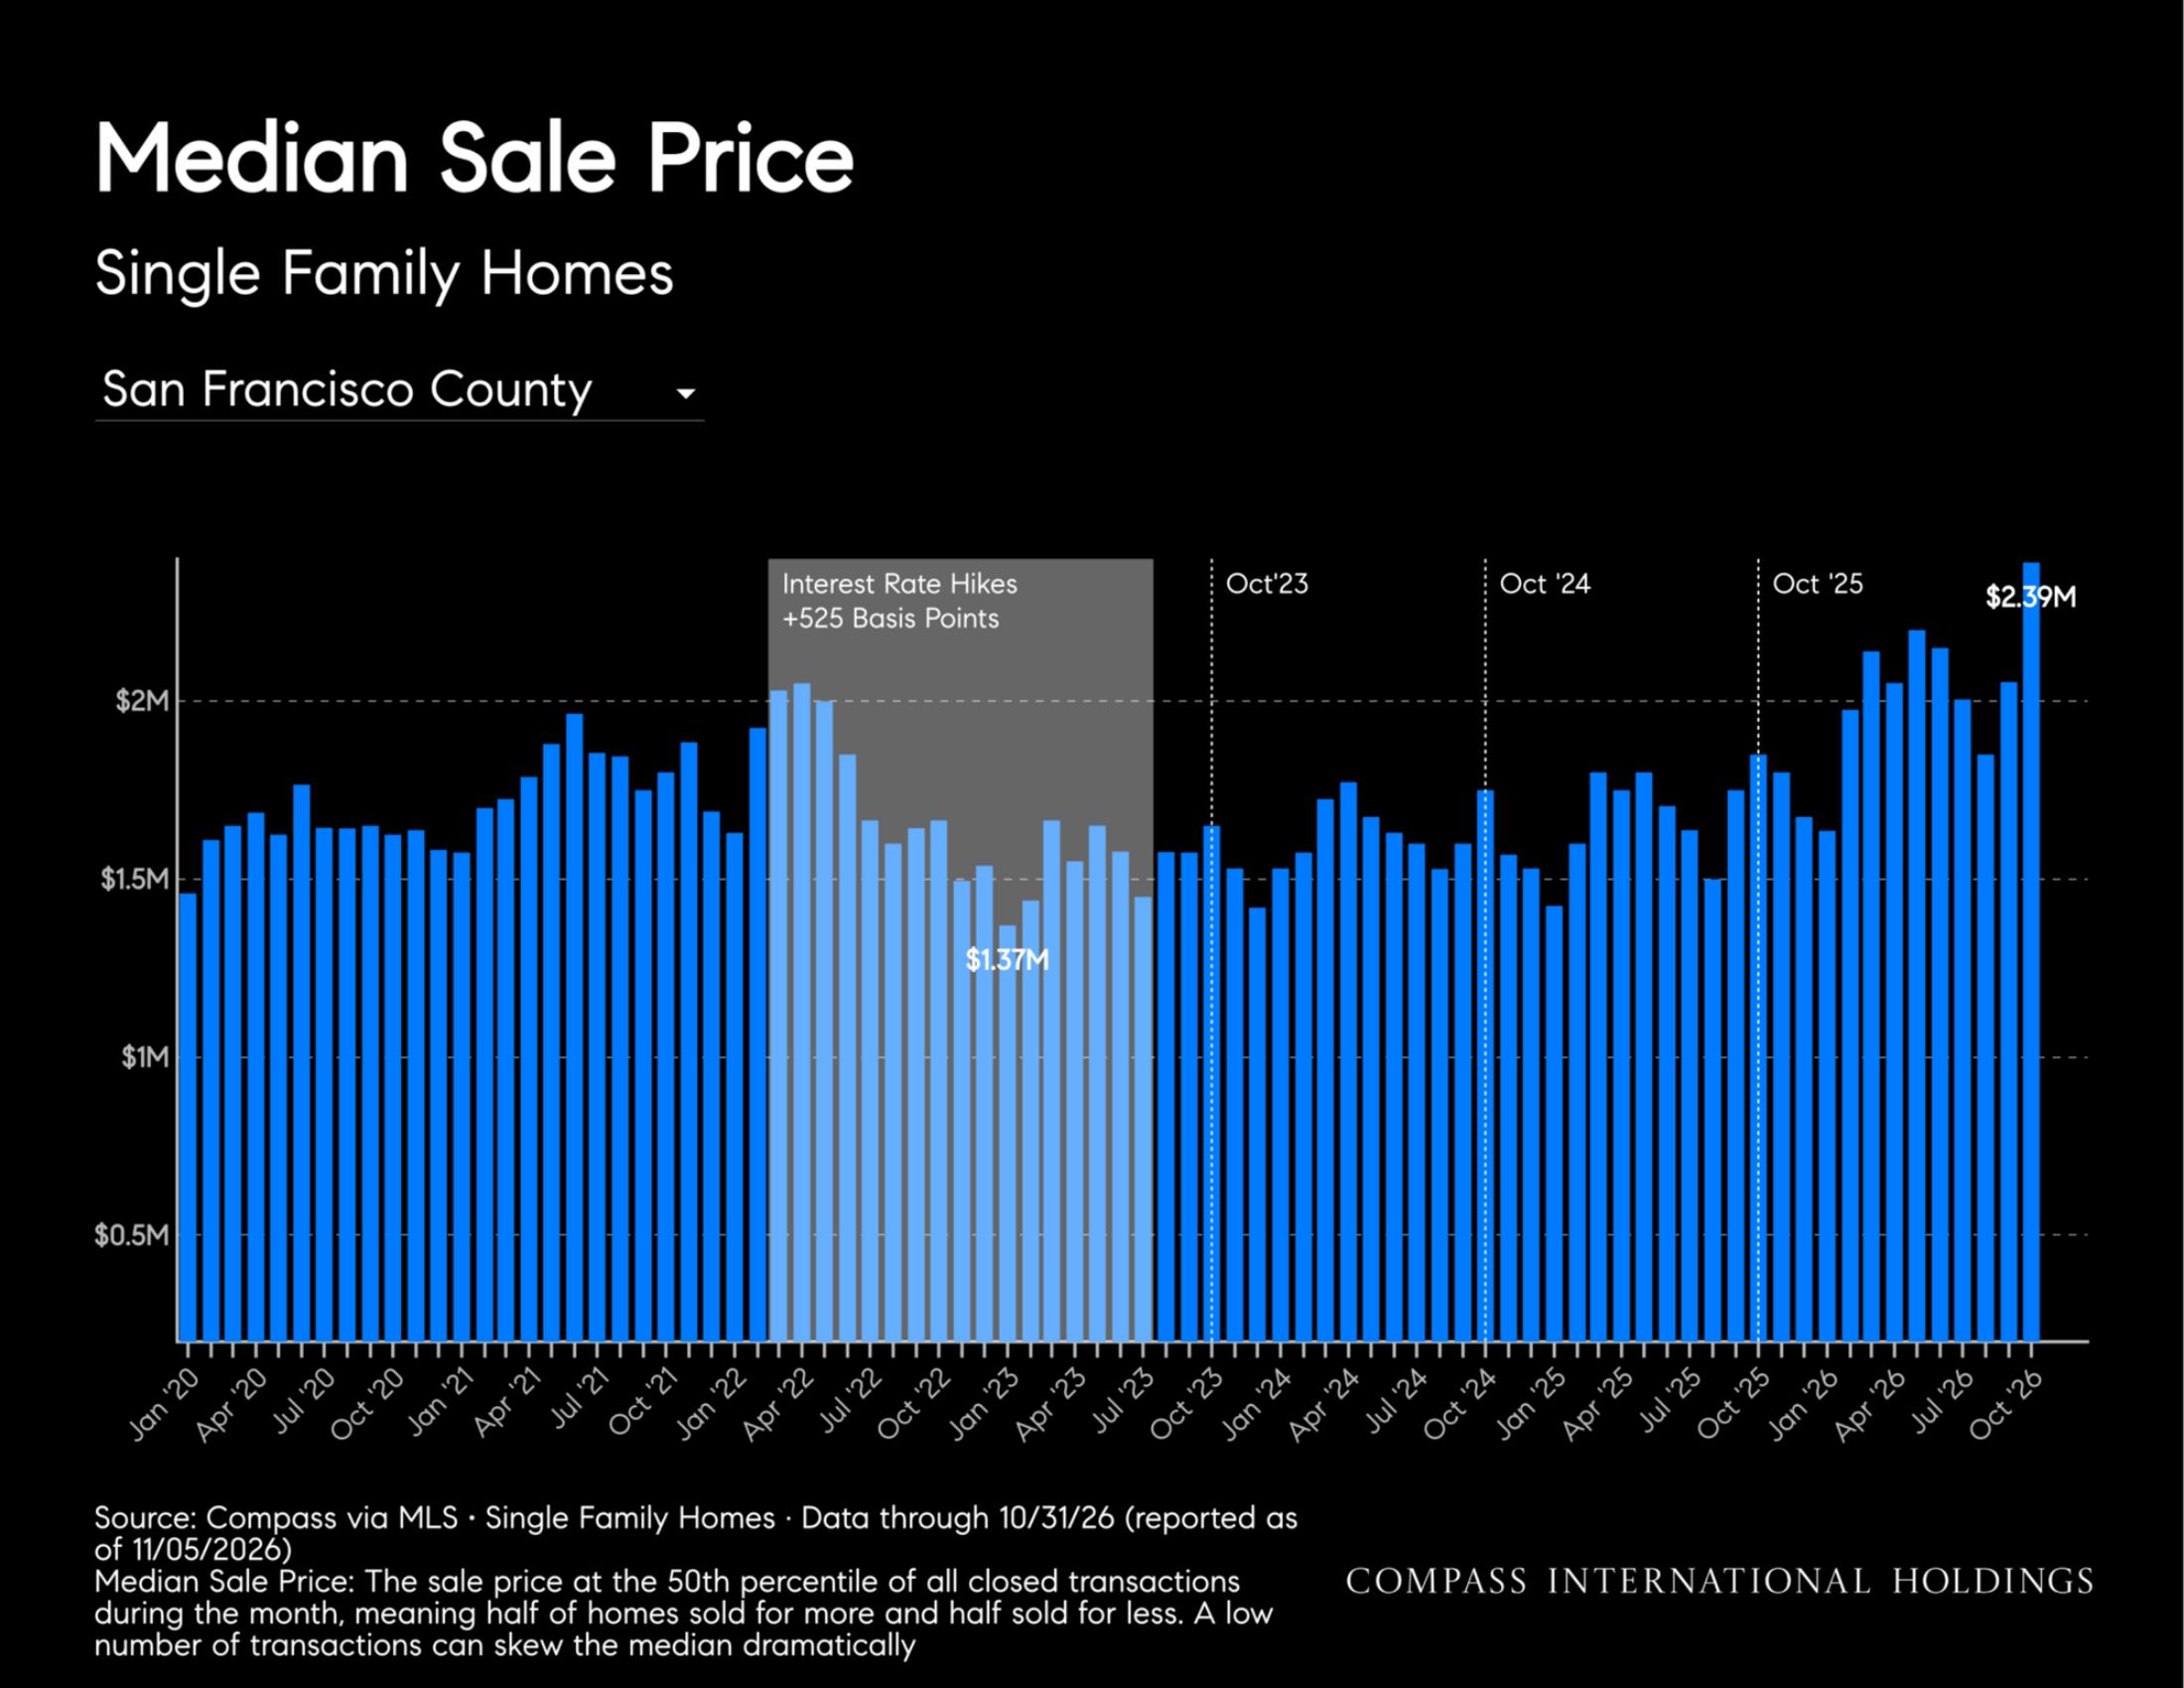
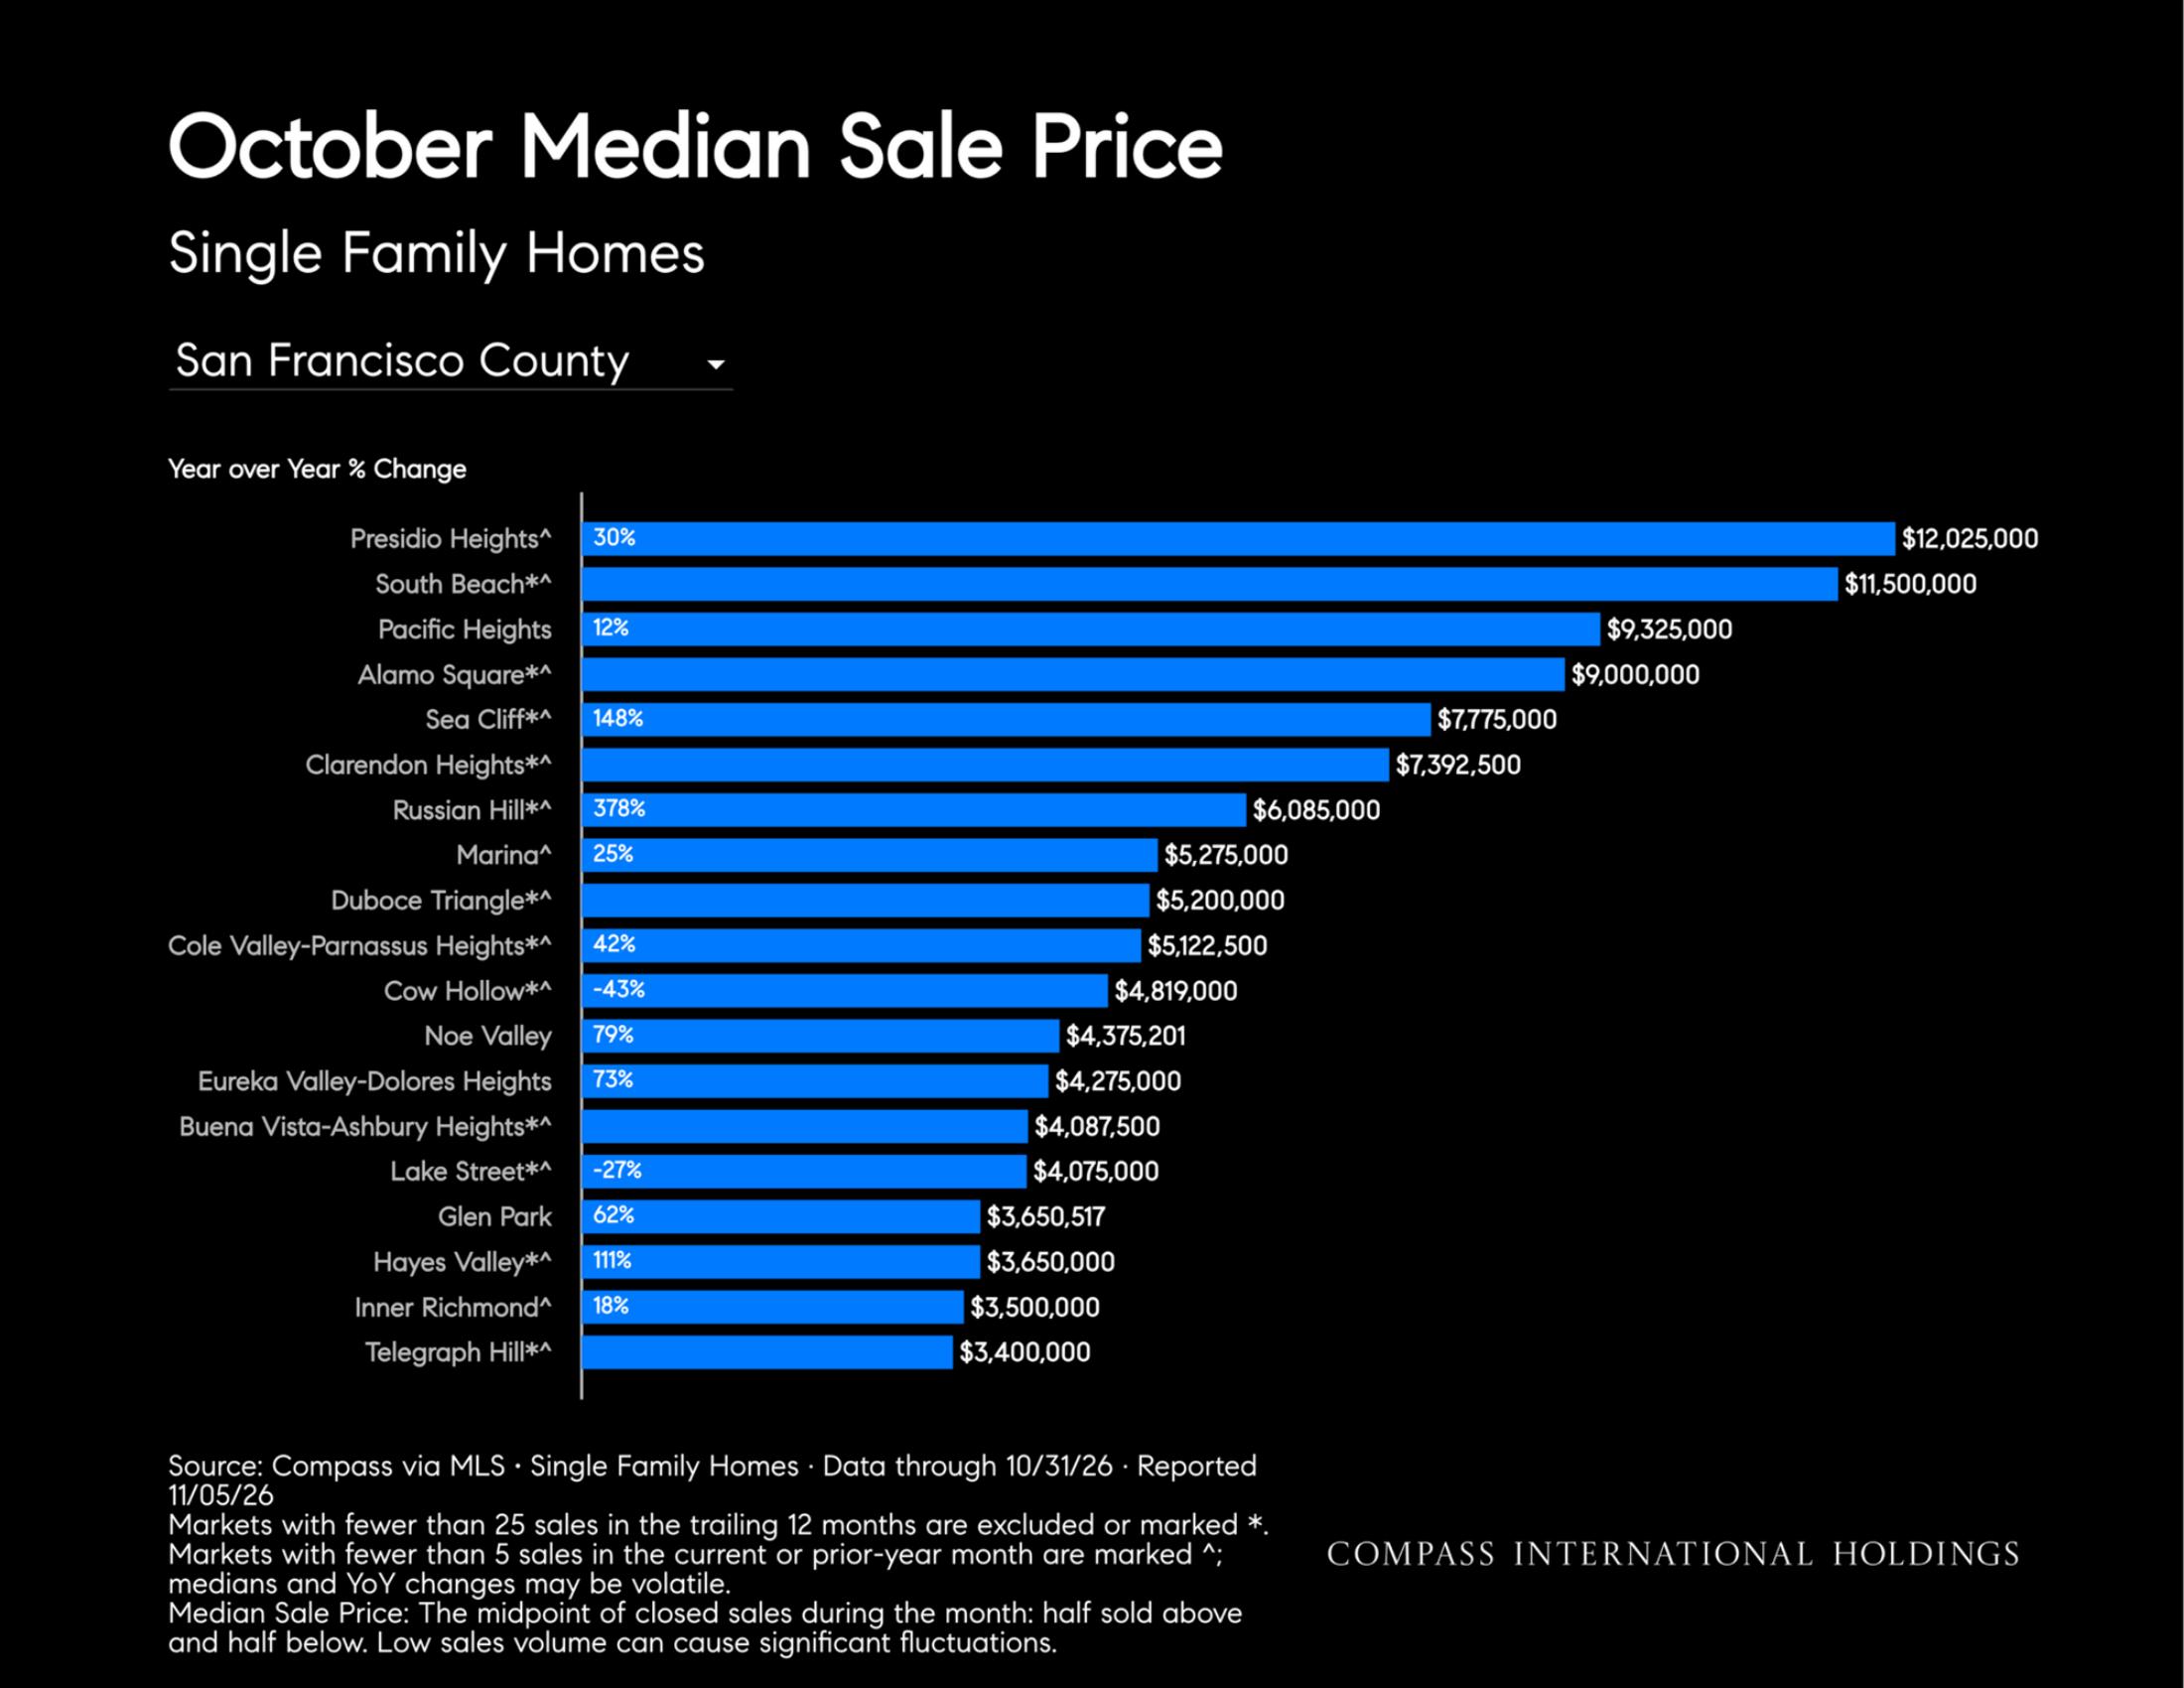
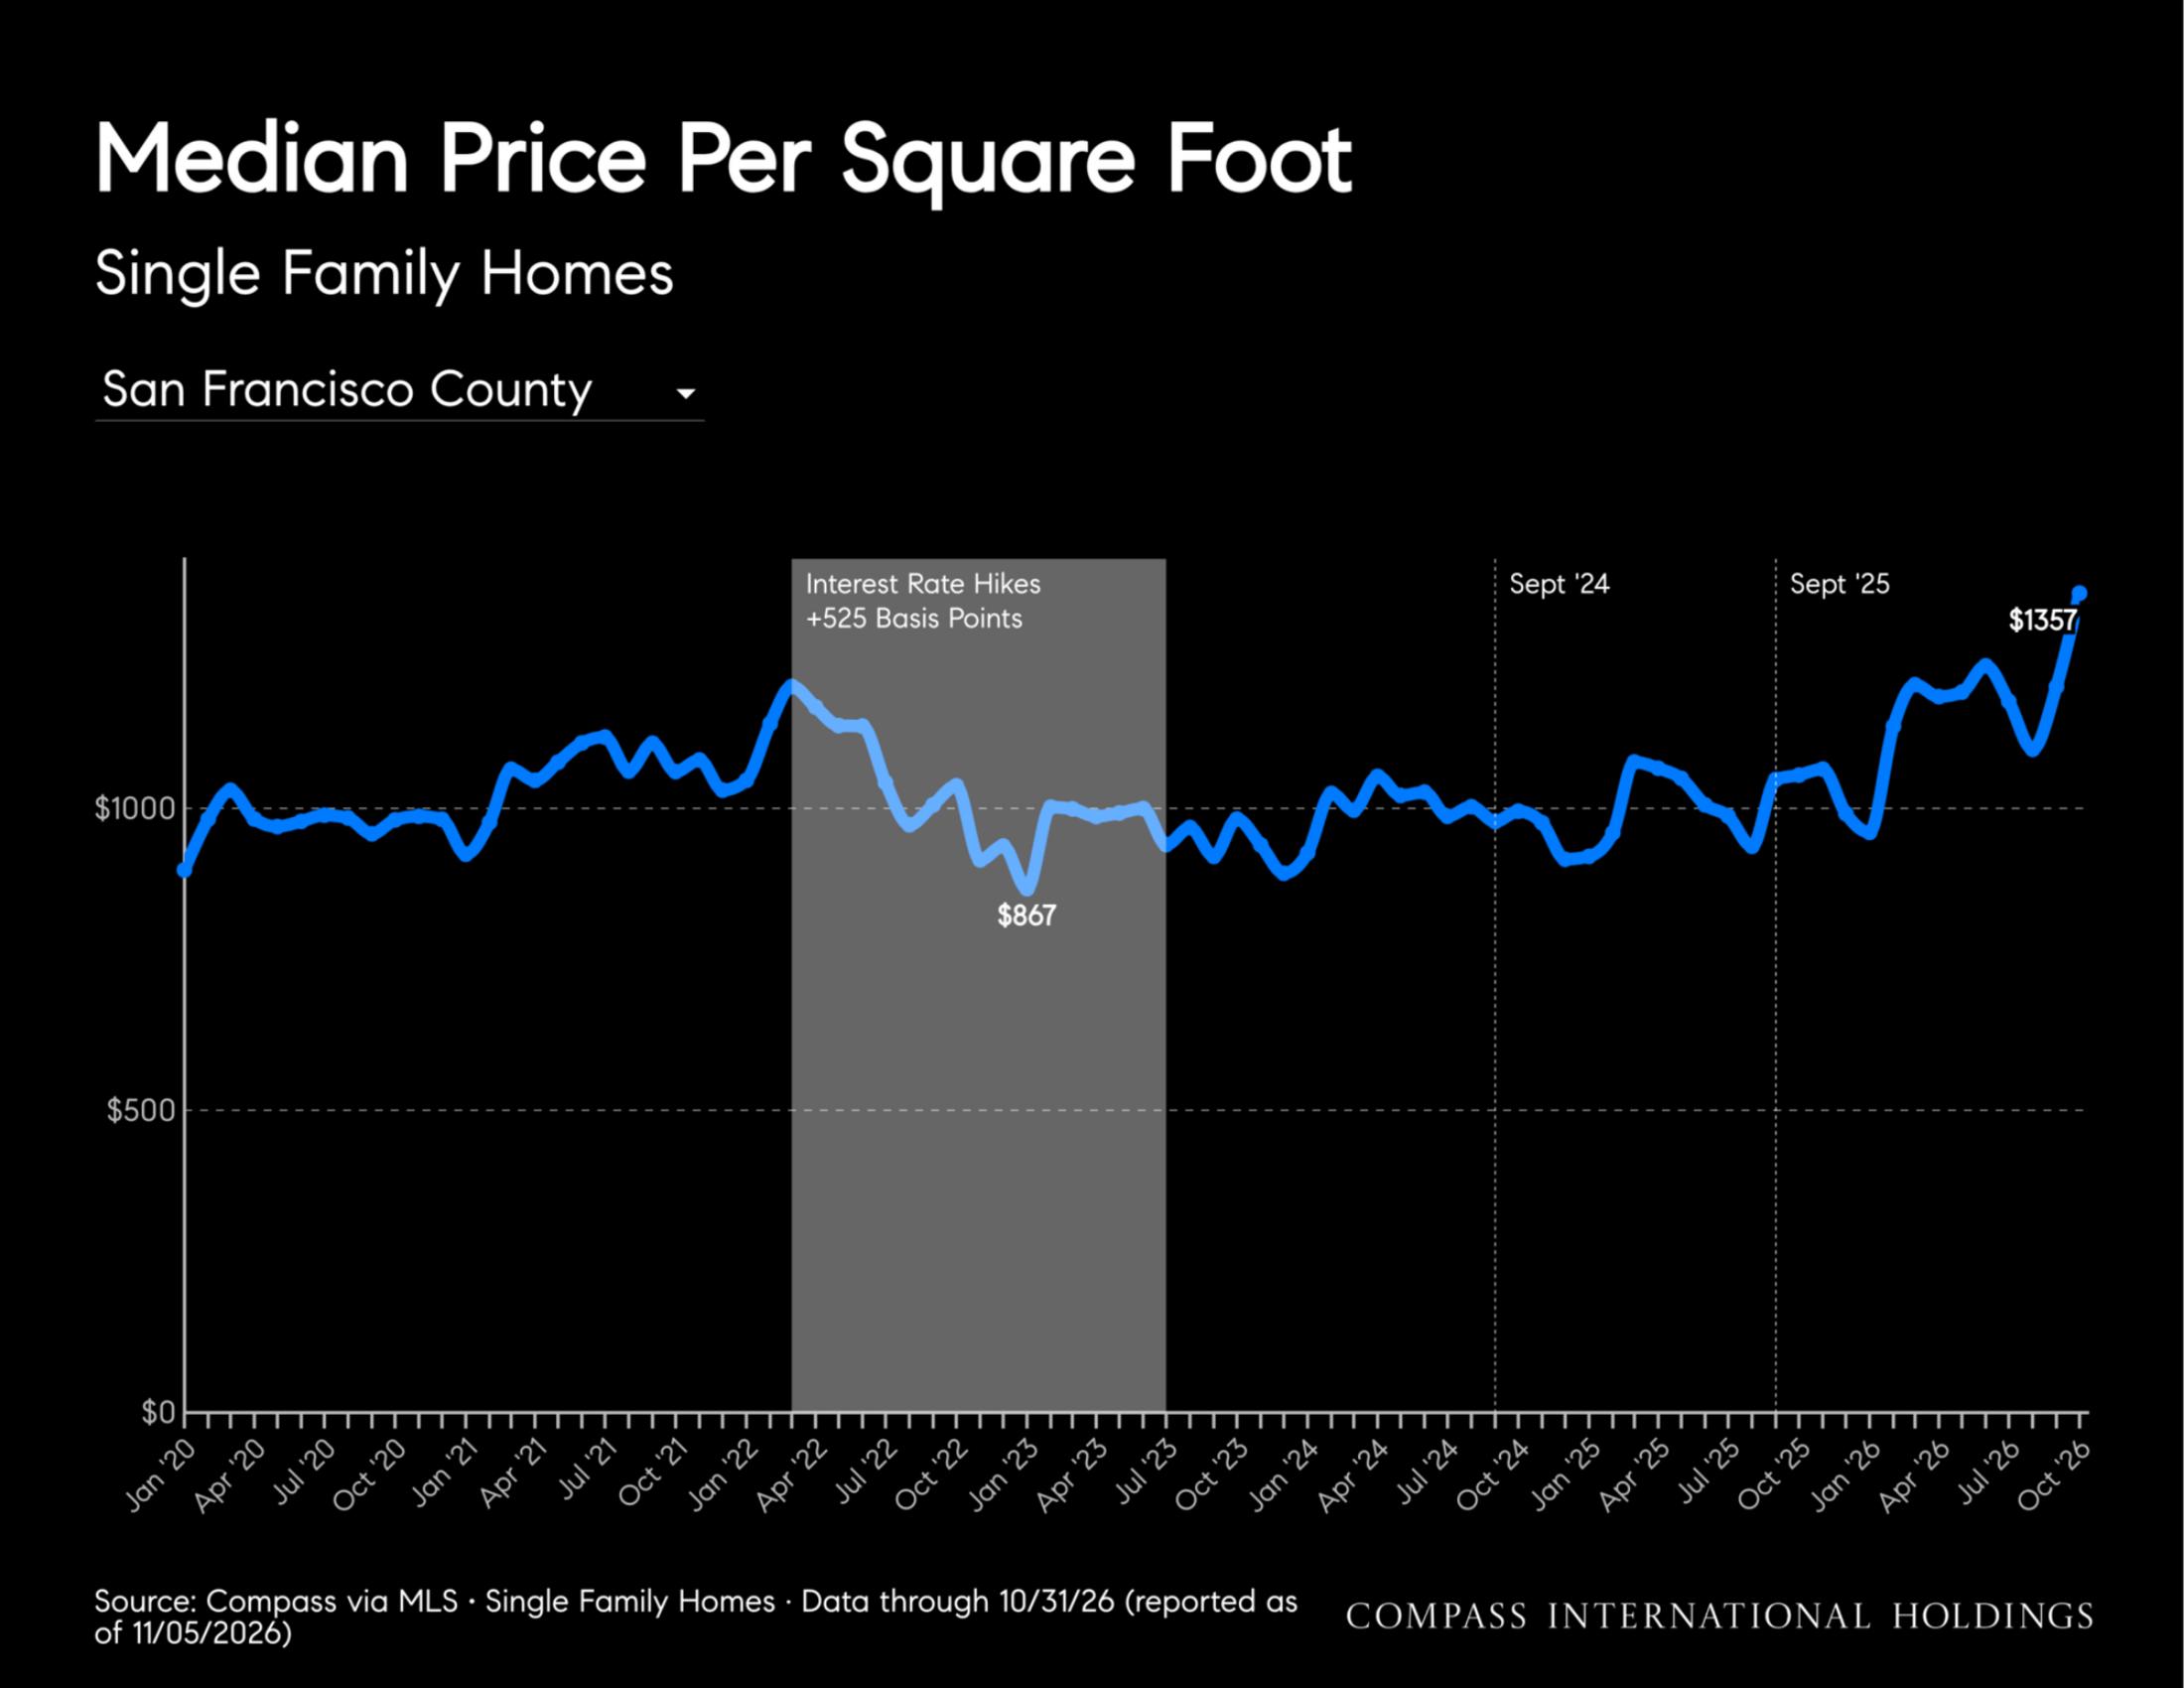
Median Sale Price Single Family HomesOctober Median Sale Price Single Family HomesOctober Median Sale Price Single Family HomesOctober Median Sale Price Single Family HomesMedian Price Year Over Year Change Single Family HomesMedian Price Per Square Foot Single Family Homes

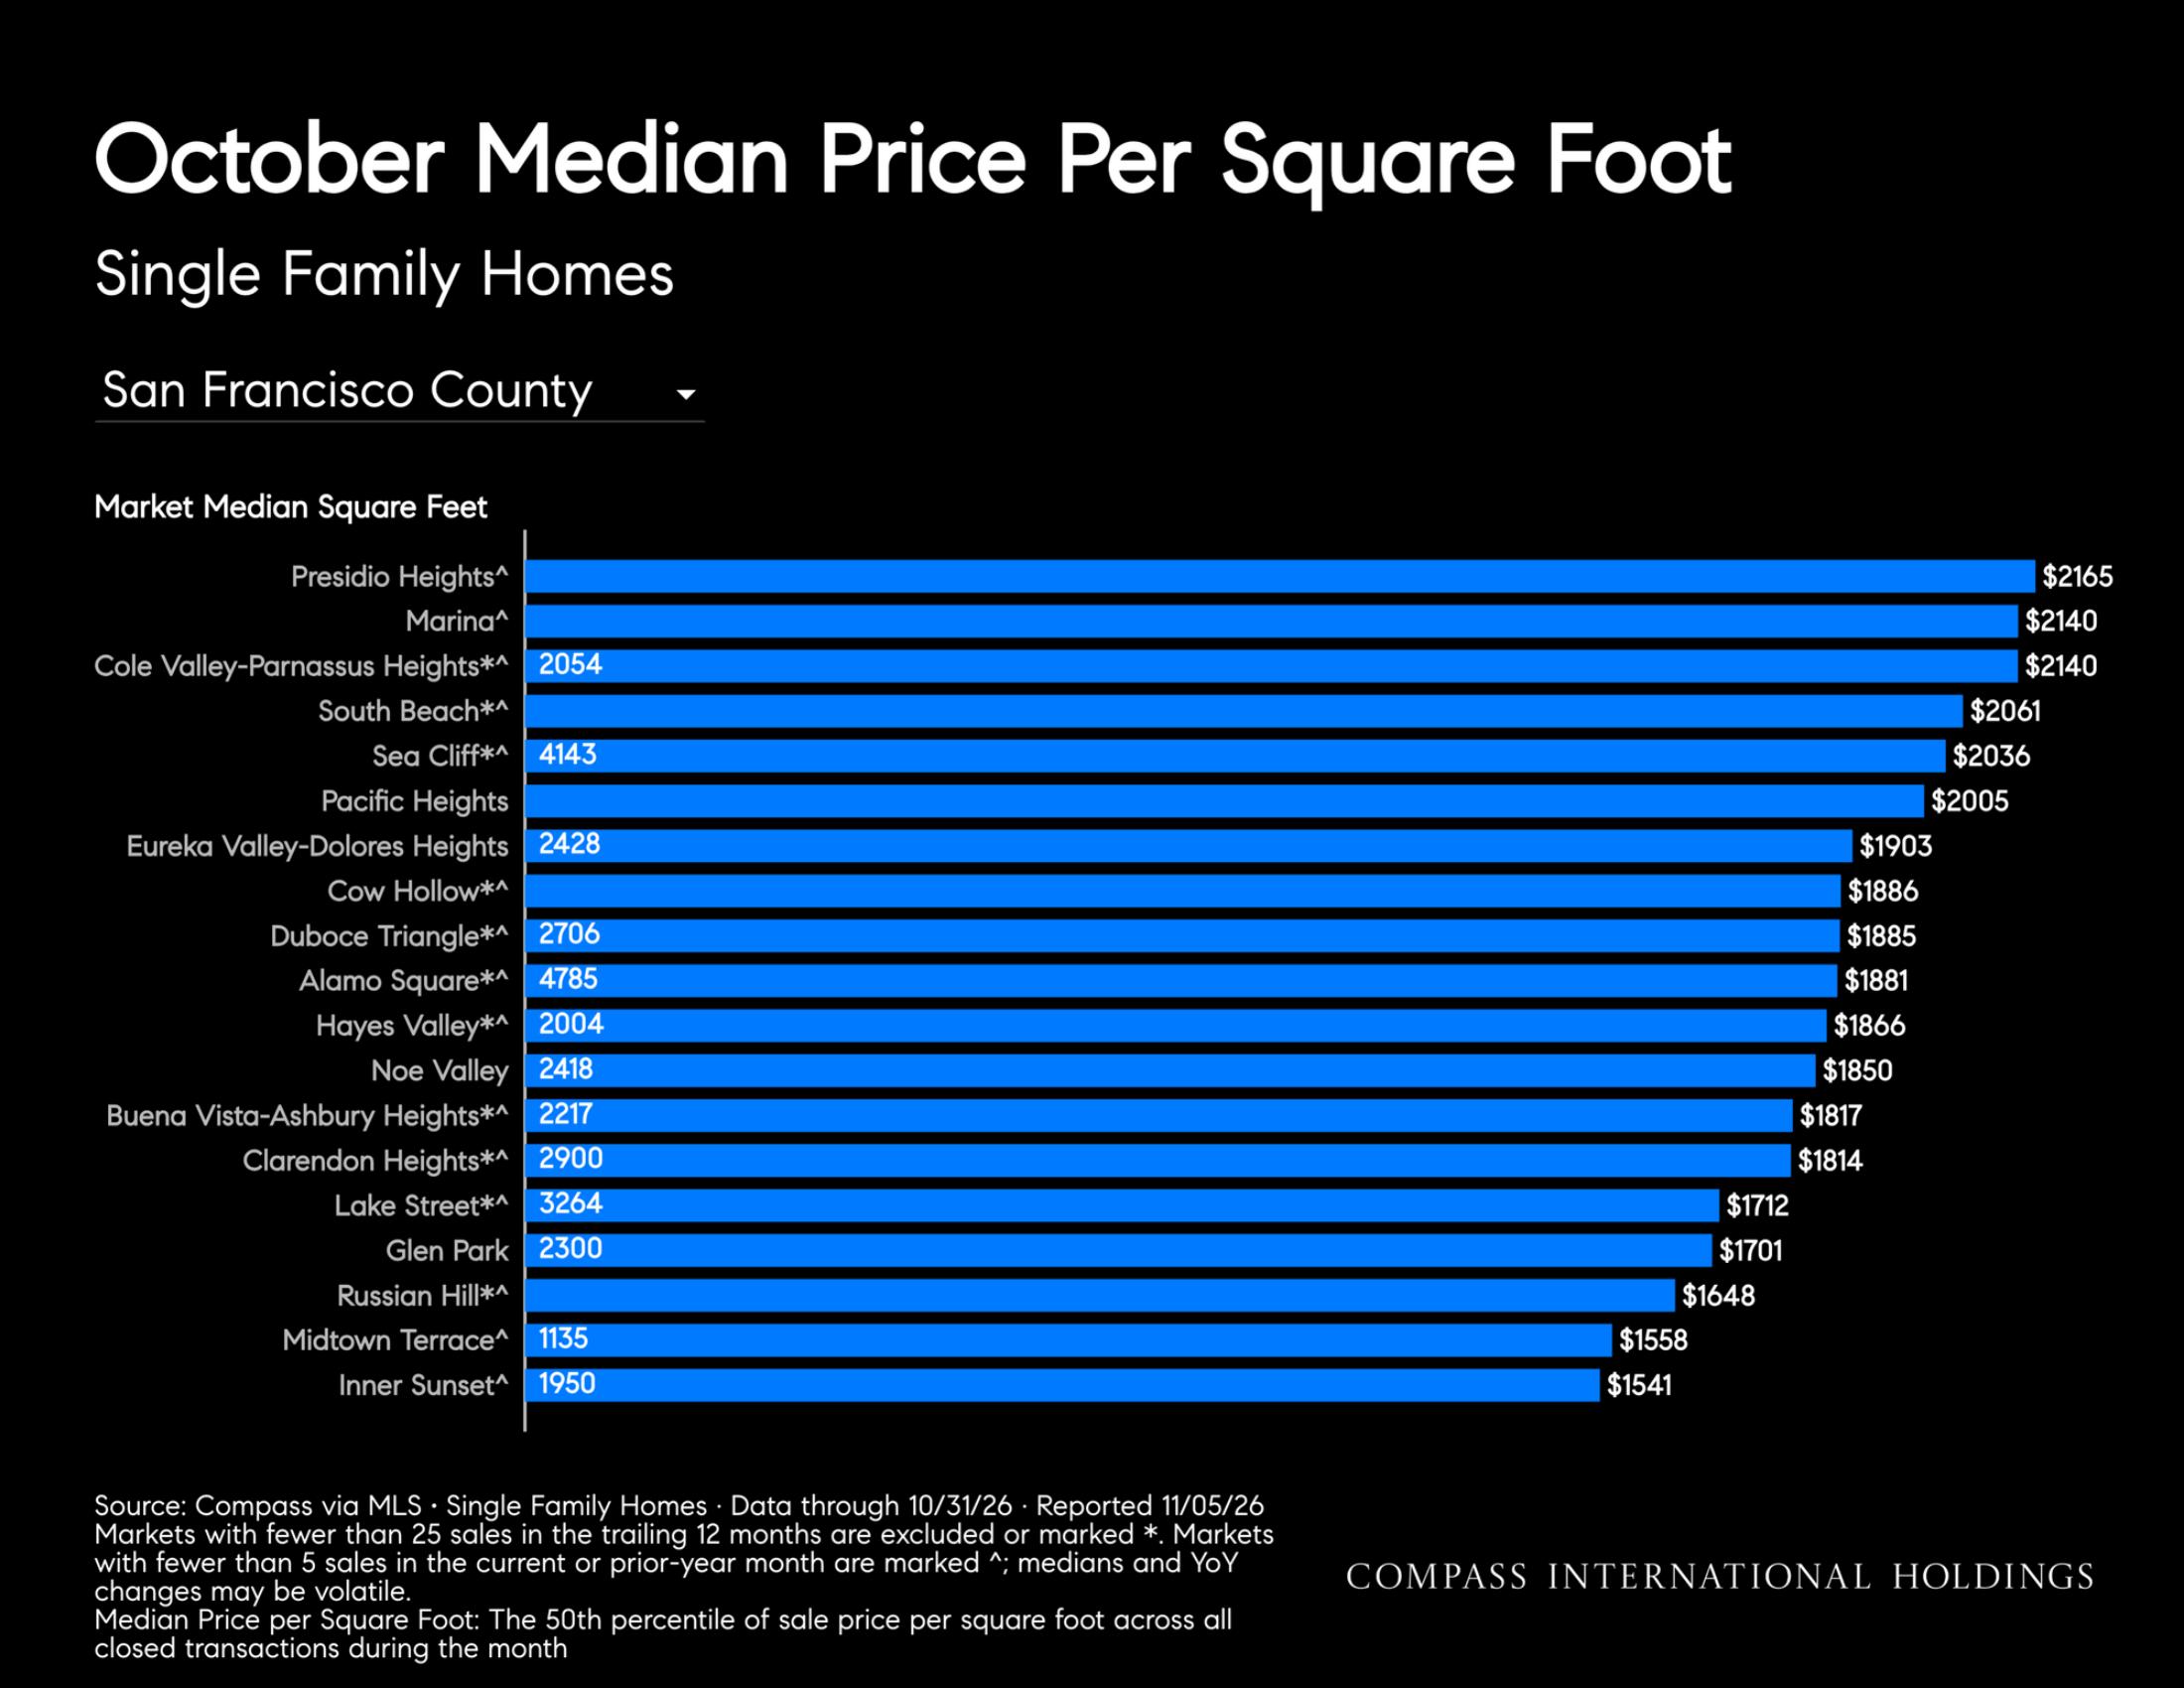
October Median Price Per Square Foot Single Family Homes

Incorrect server response.October Median Price Per Square Foot Single Family HomesOctober Median Price Per Square Foot Single Family Homes

Overbidding: Sales Price Above List Single Family Homes

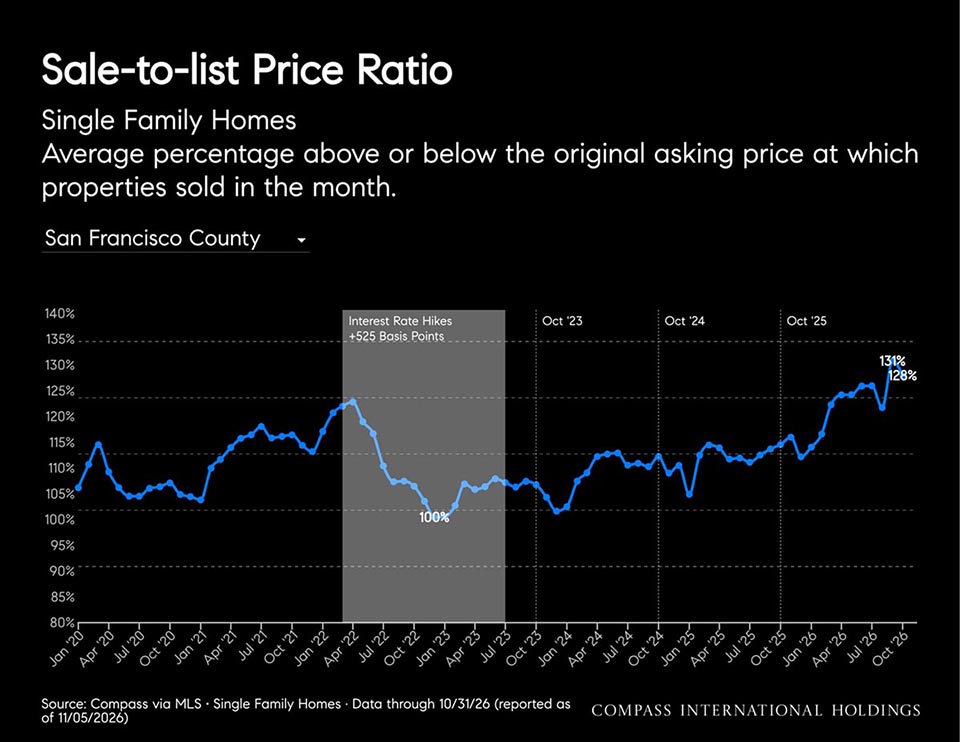
Sale-to-list Price Ratio Single Family Homes Average percentage above or below the original asking price at which properties sold in the month.
Average Days on Market Single Family Homes Average days from listing to contract. Homes typically take longer to sell in the late fall and winter.

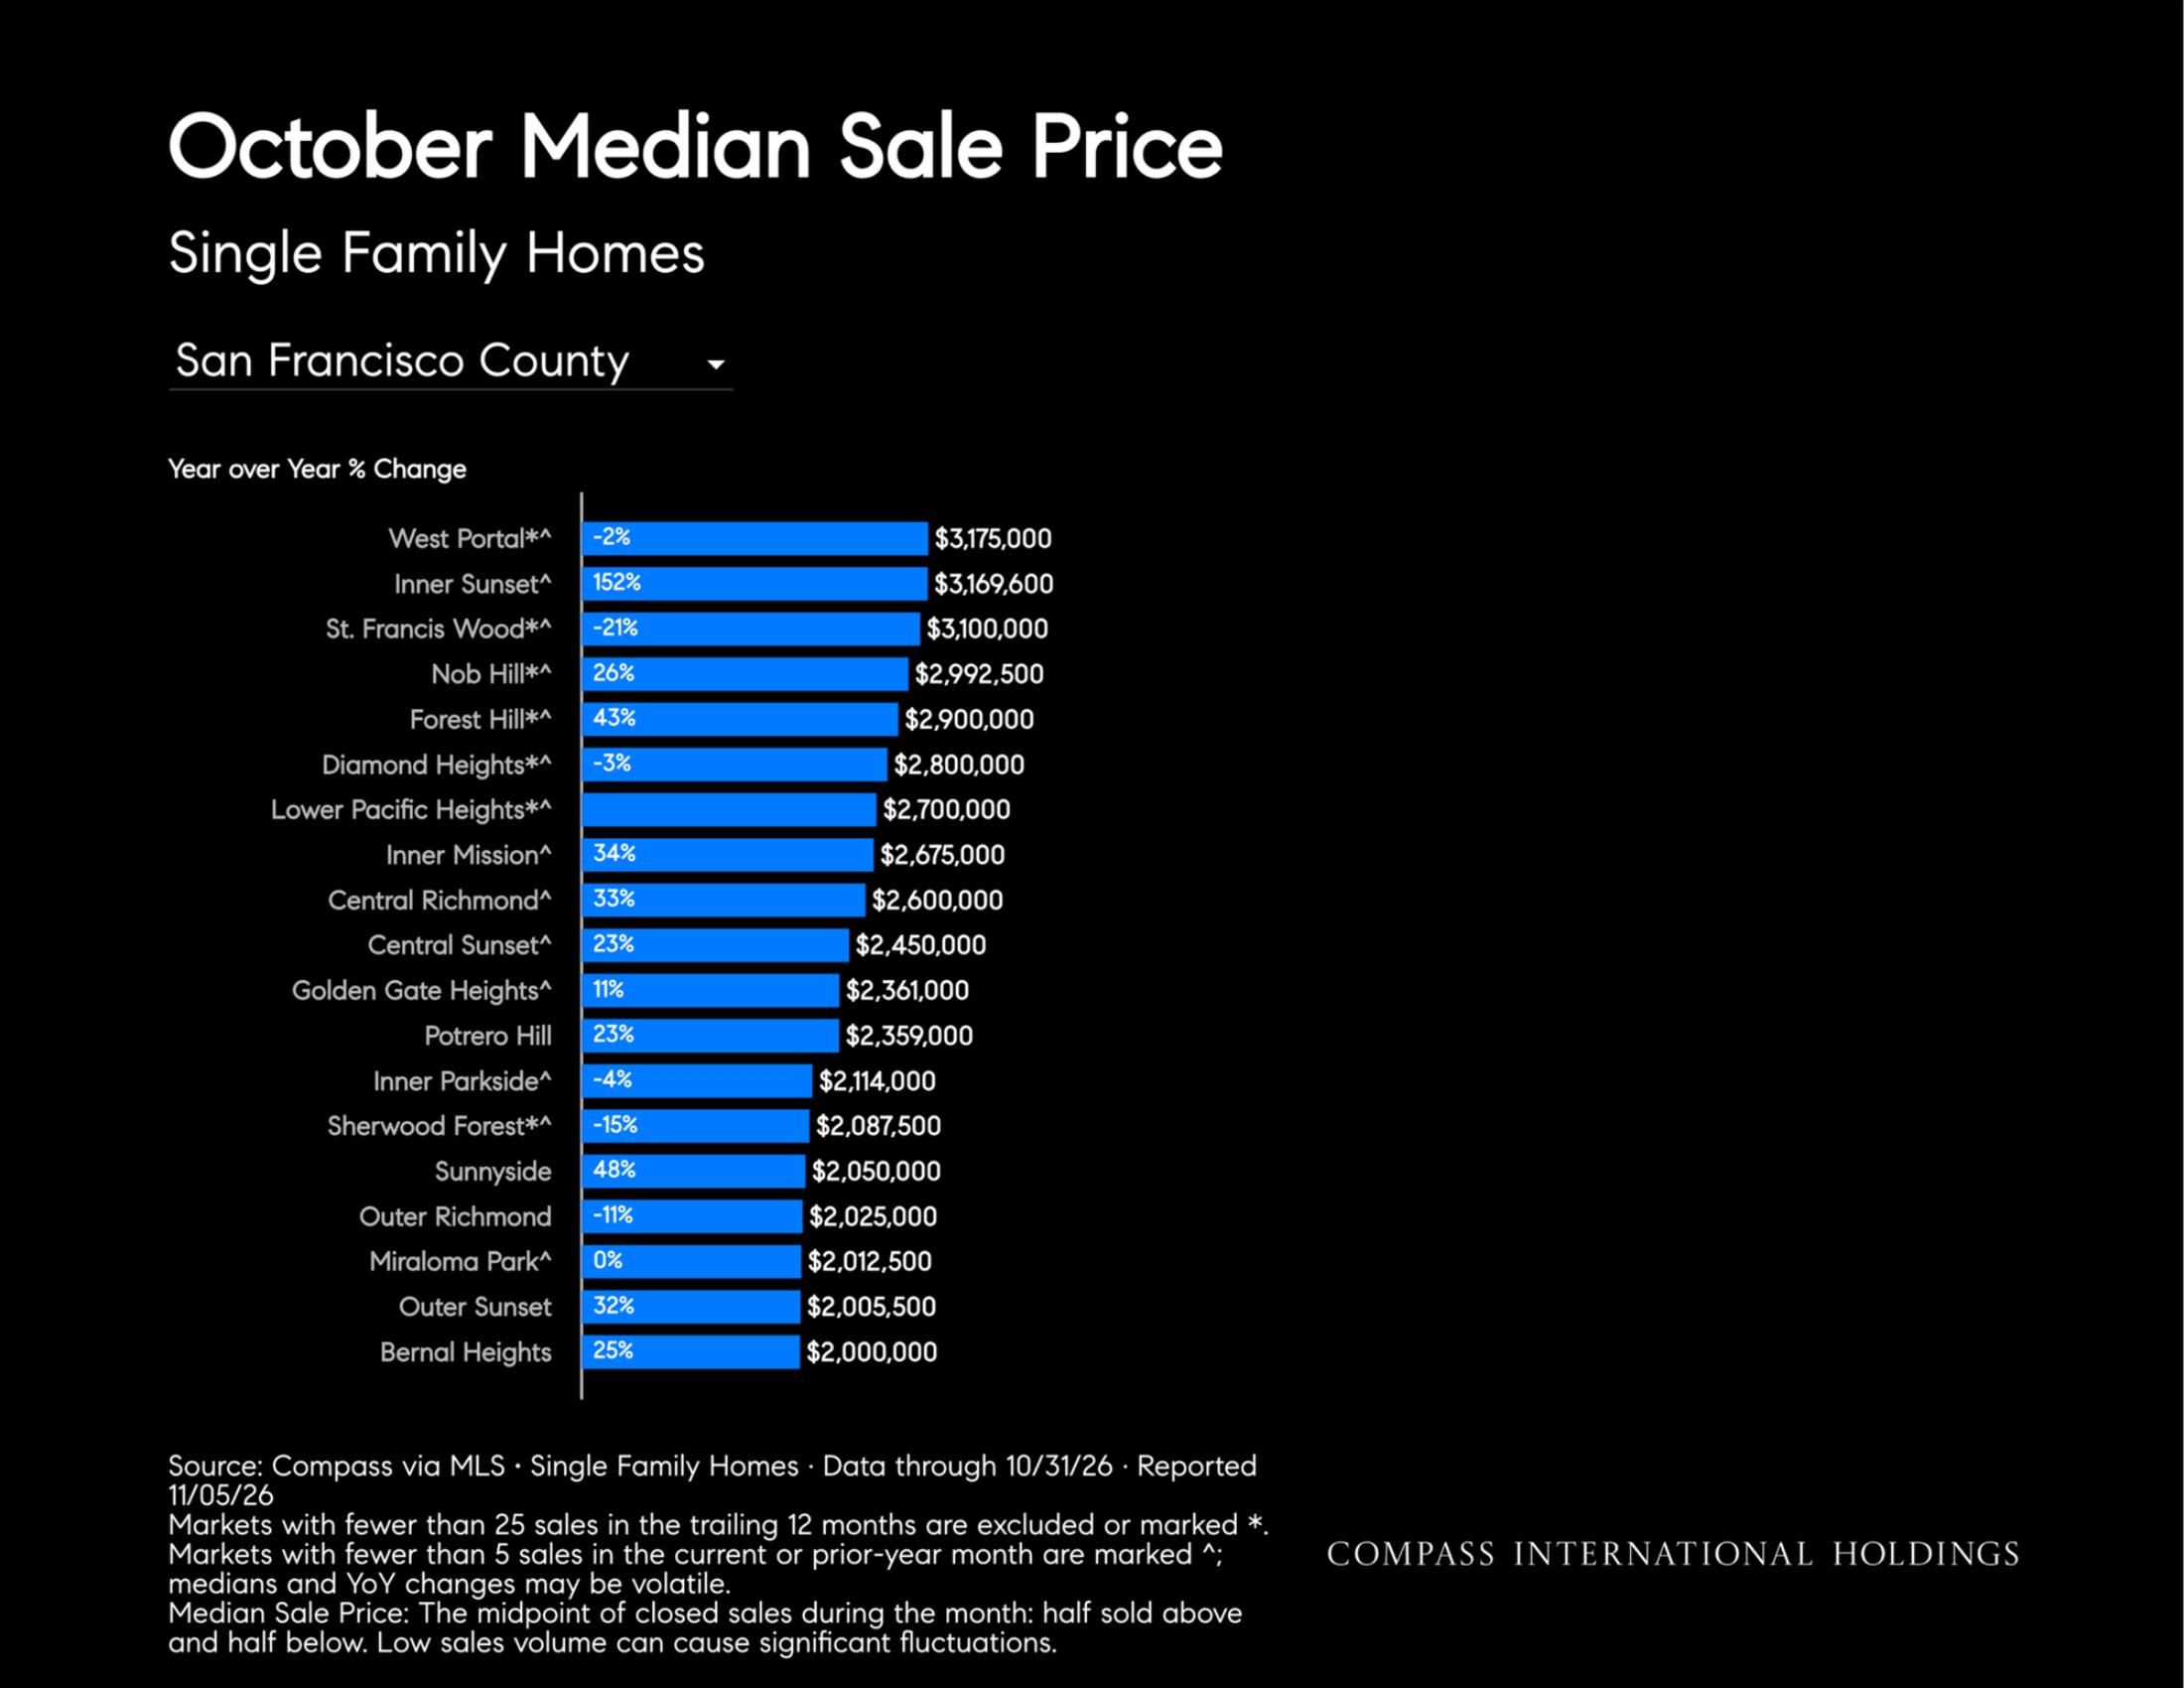
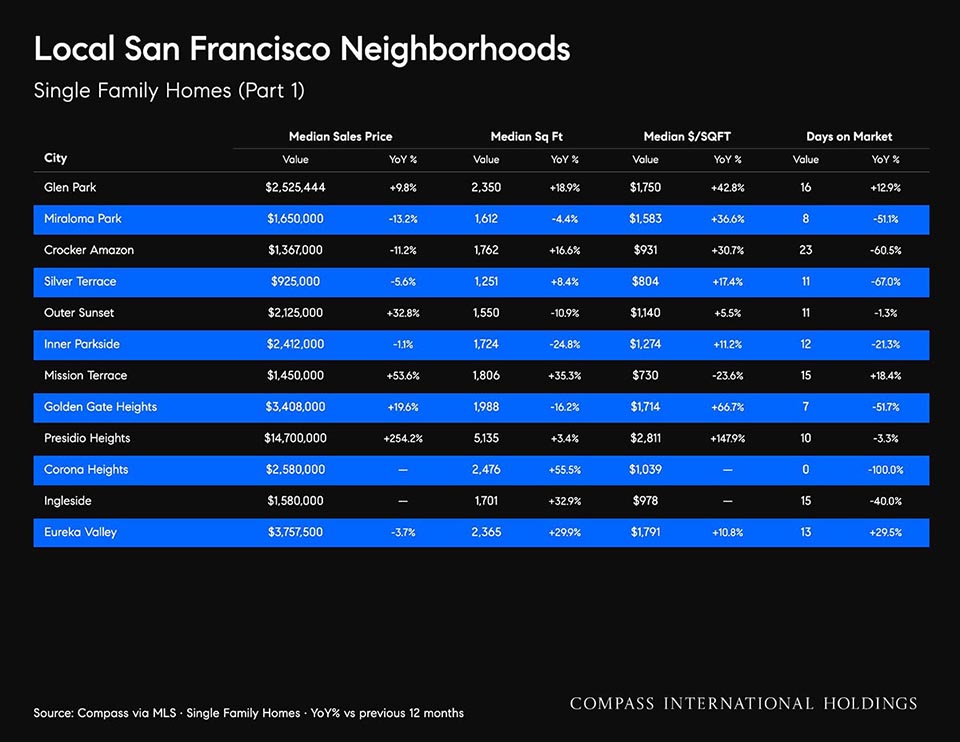
Local San Francisco Neighborhoods Single Family Homes (Part 1)

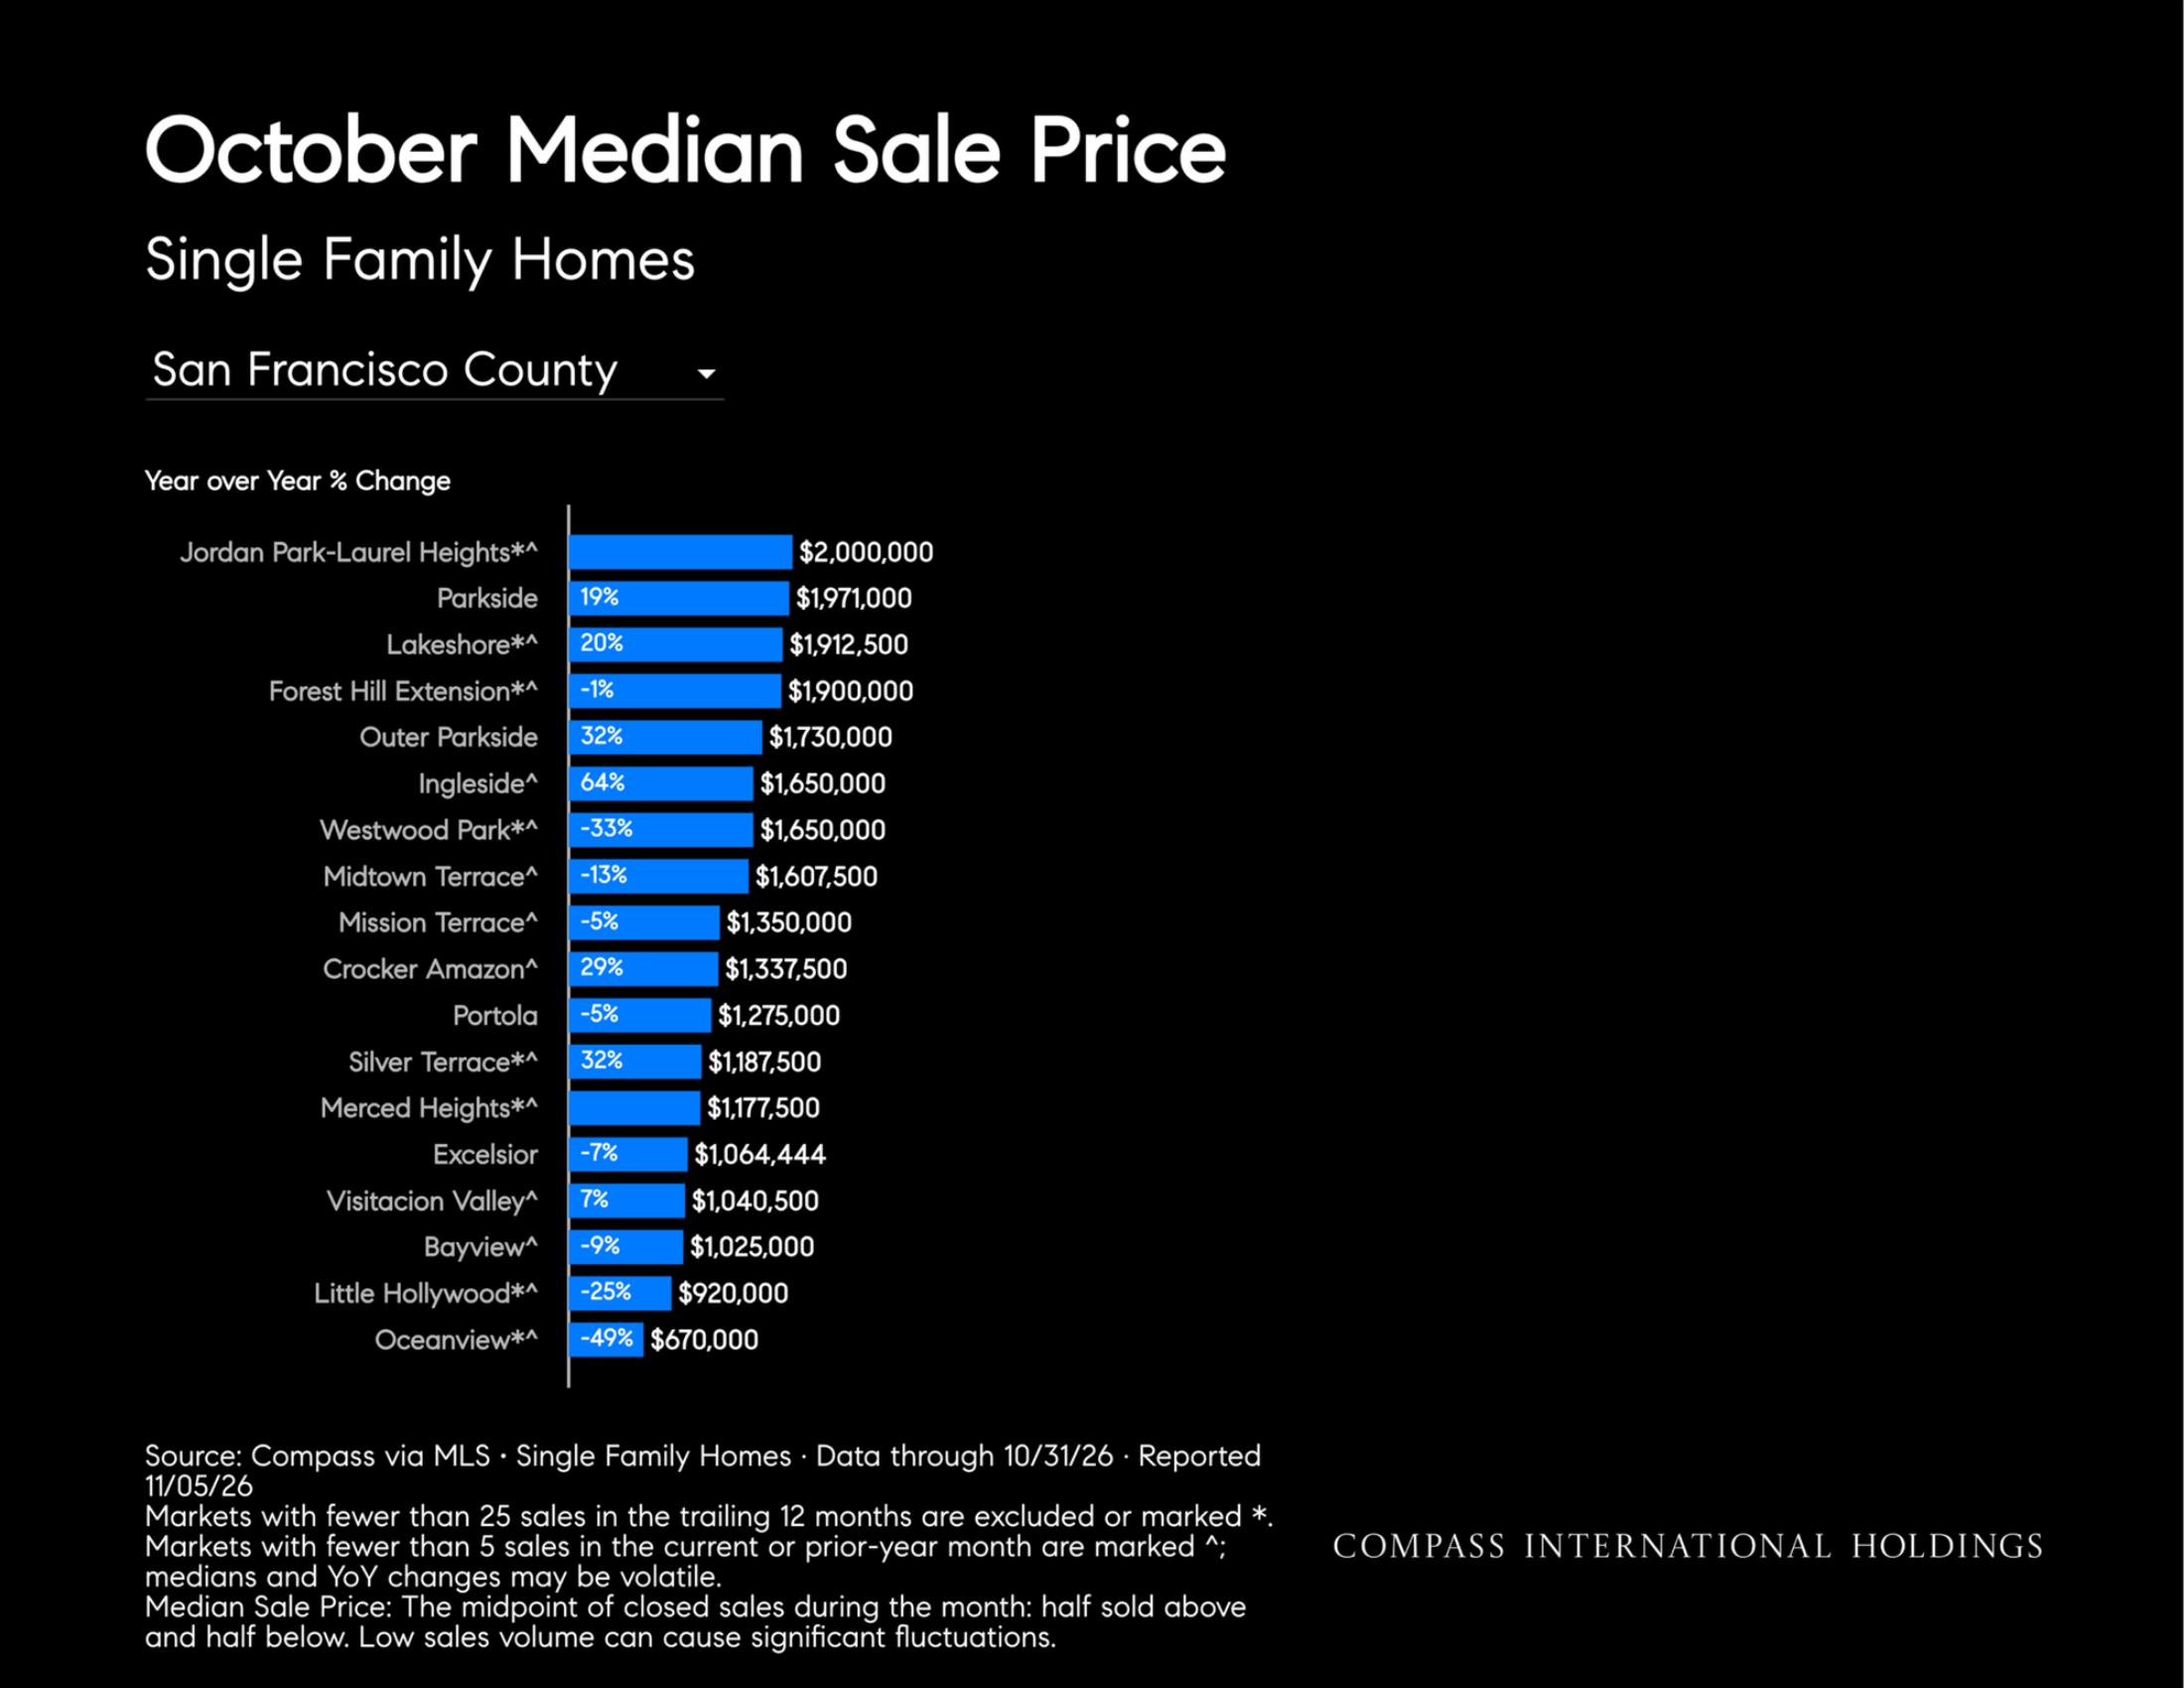
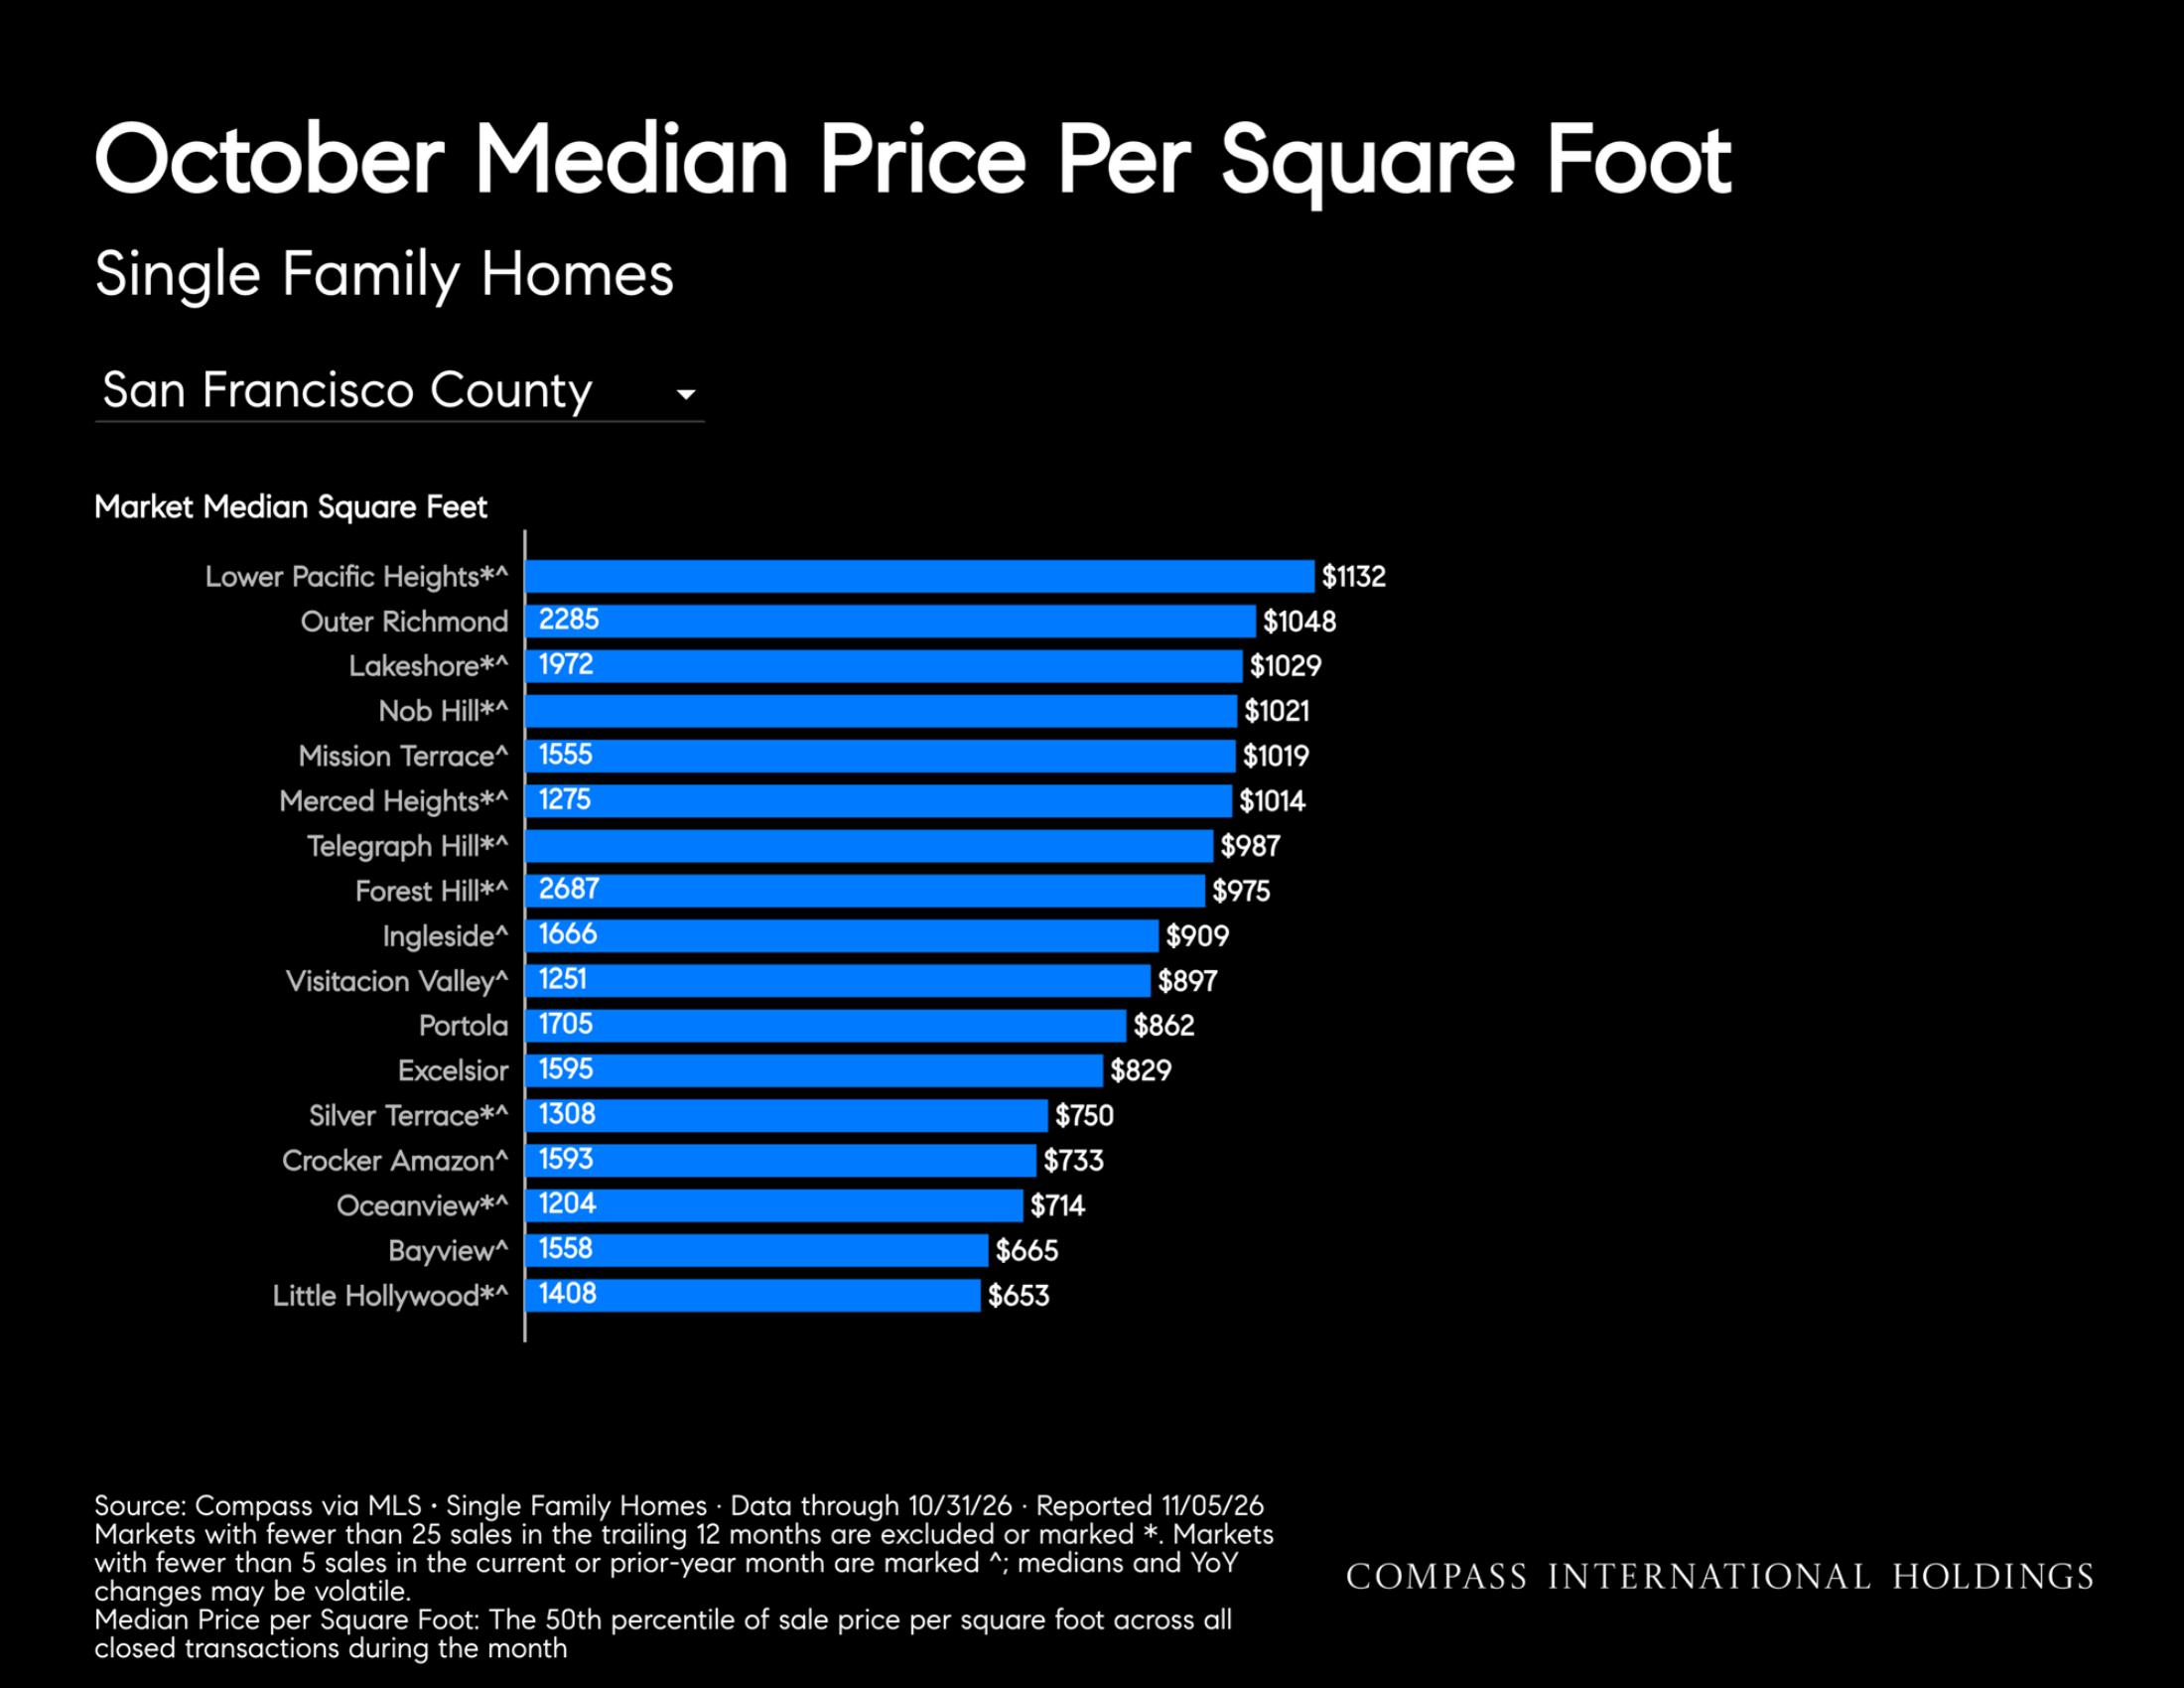
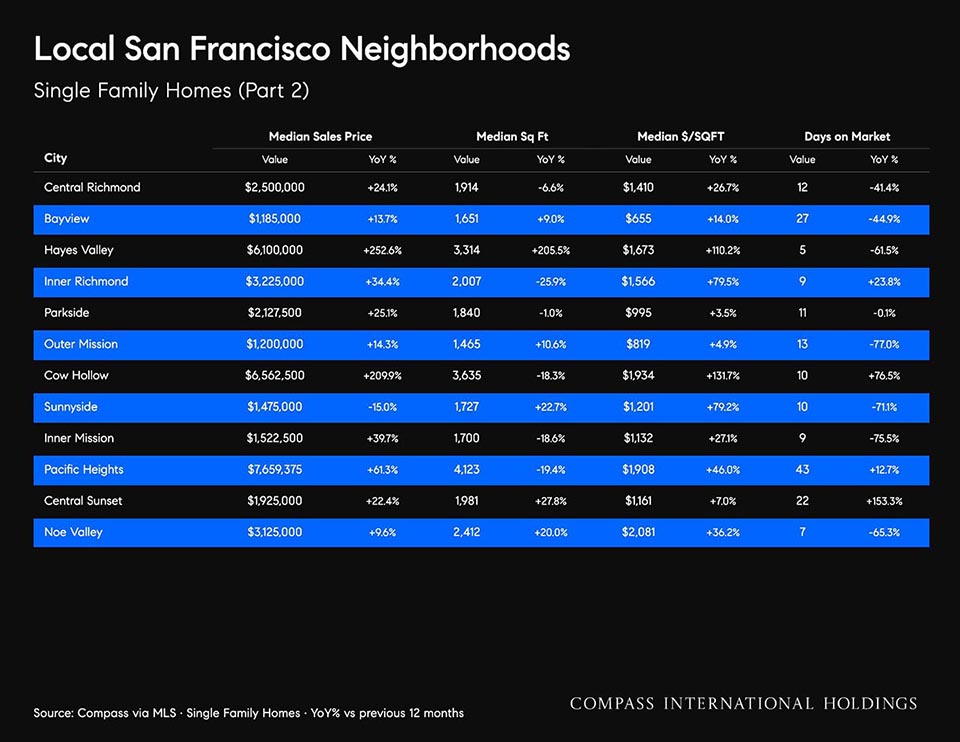
Local San Francisco Neighborhoods Single Family Homes (Part 2)

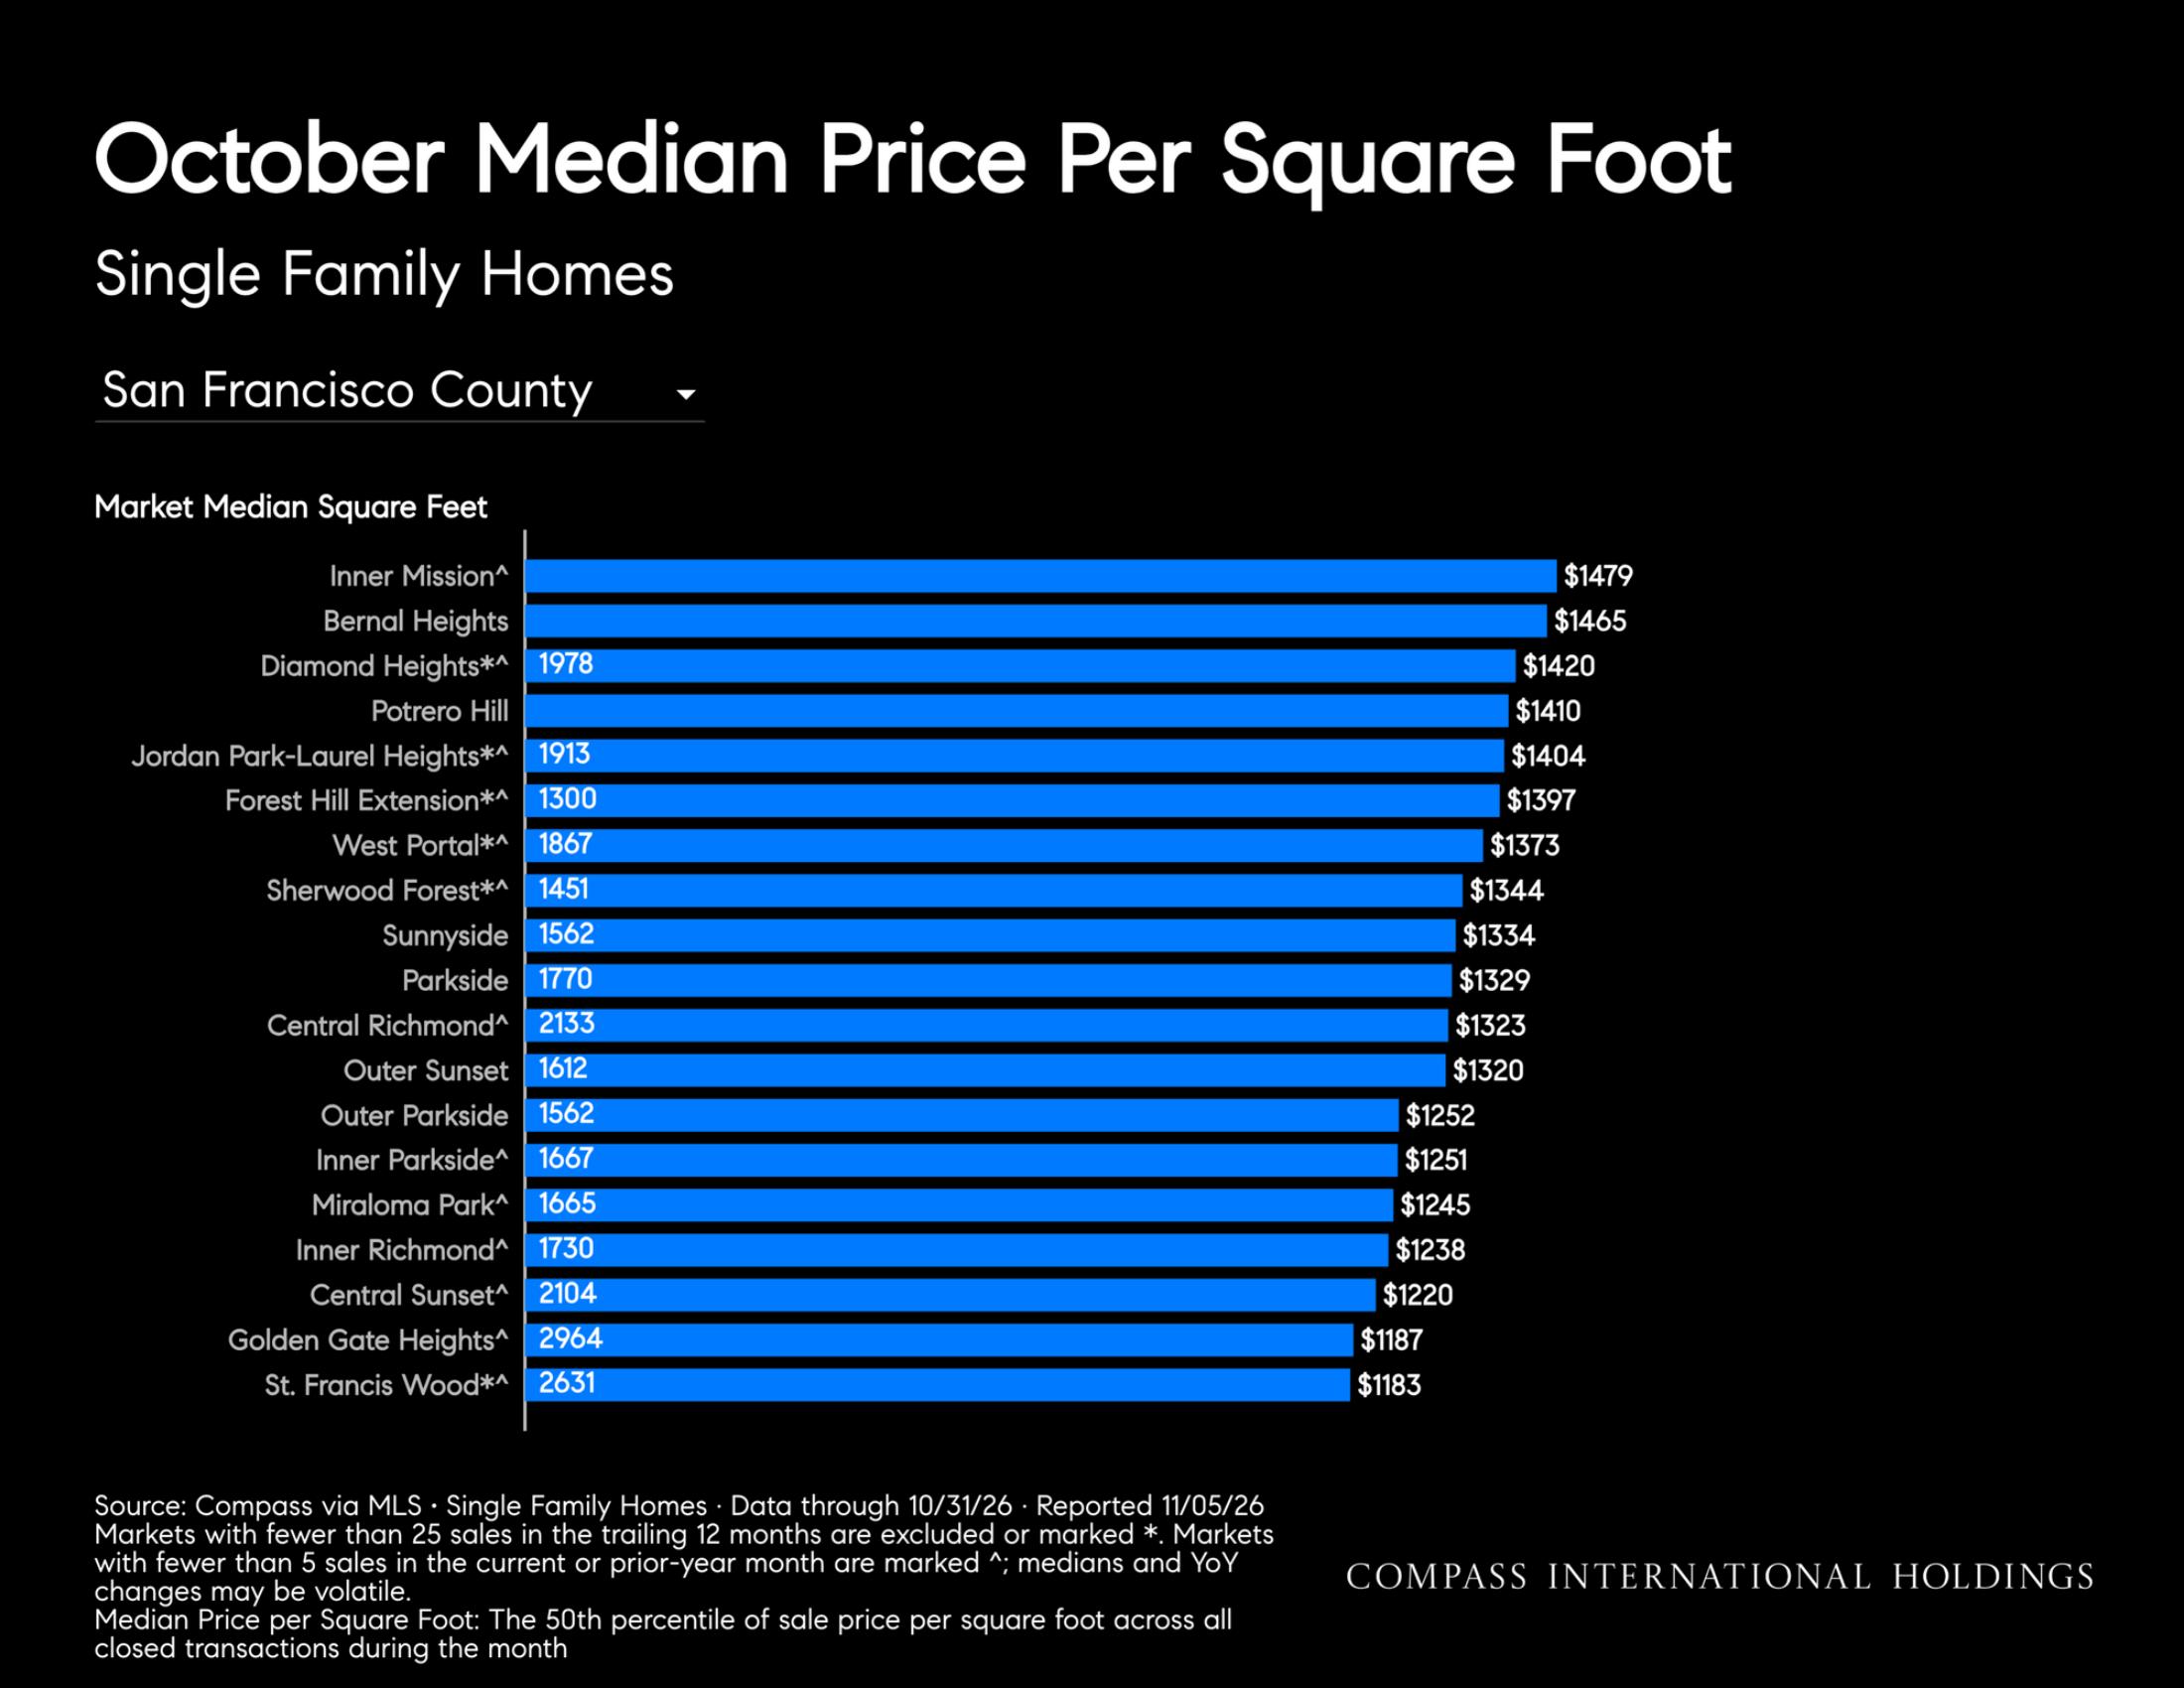
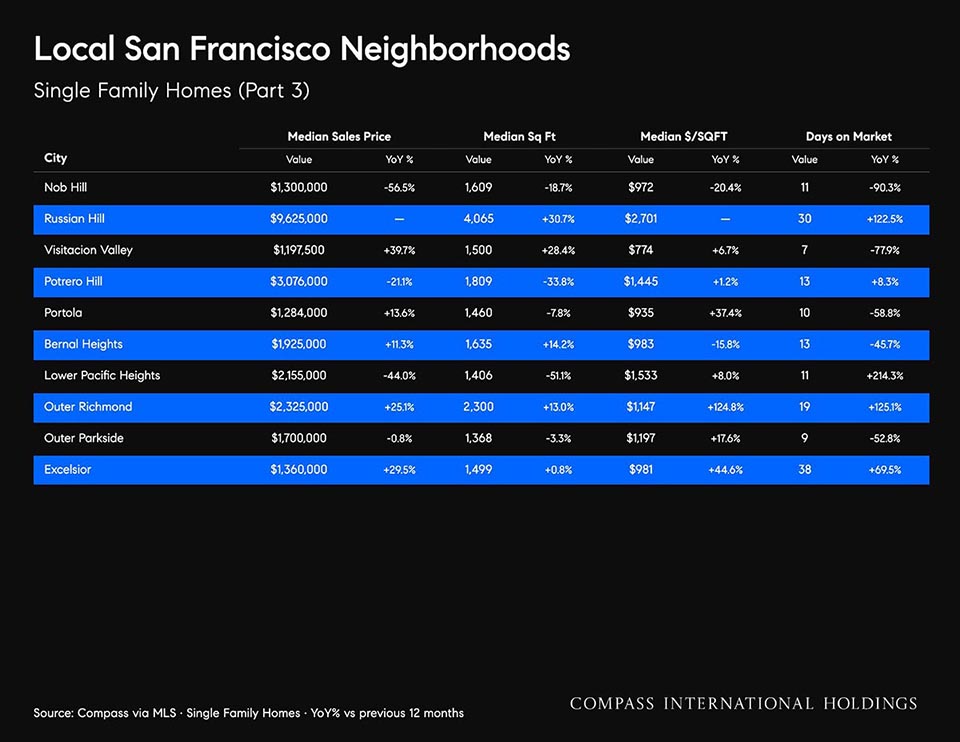
Local San Francisco Neighborhoods Single Family Homes (Part 3)

Median Sale Price Condos San Francisco County

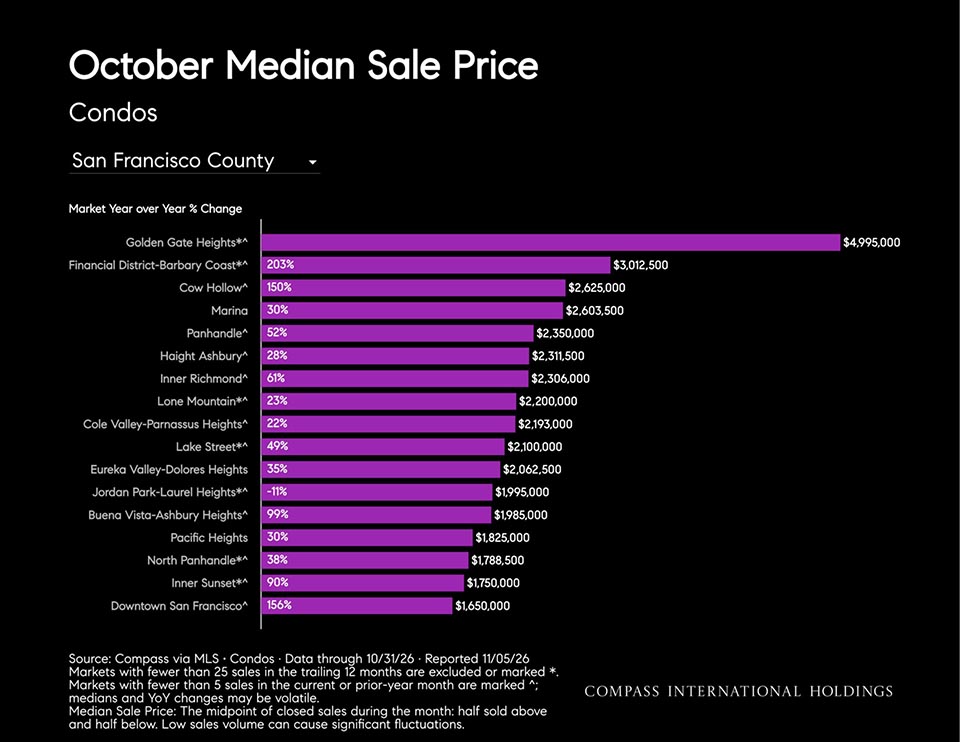
October Median Sale Price Condos

October Median Sale Price Condos

October Median Sale Price Condos San Francisco County

Median Price Year Over Year Change Condos

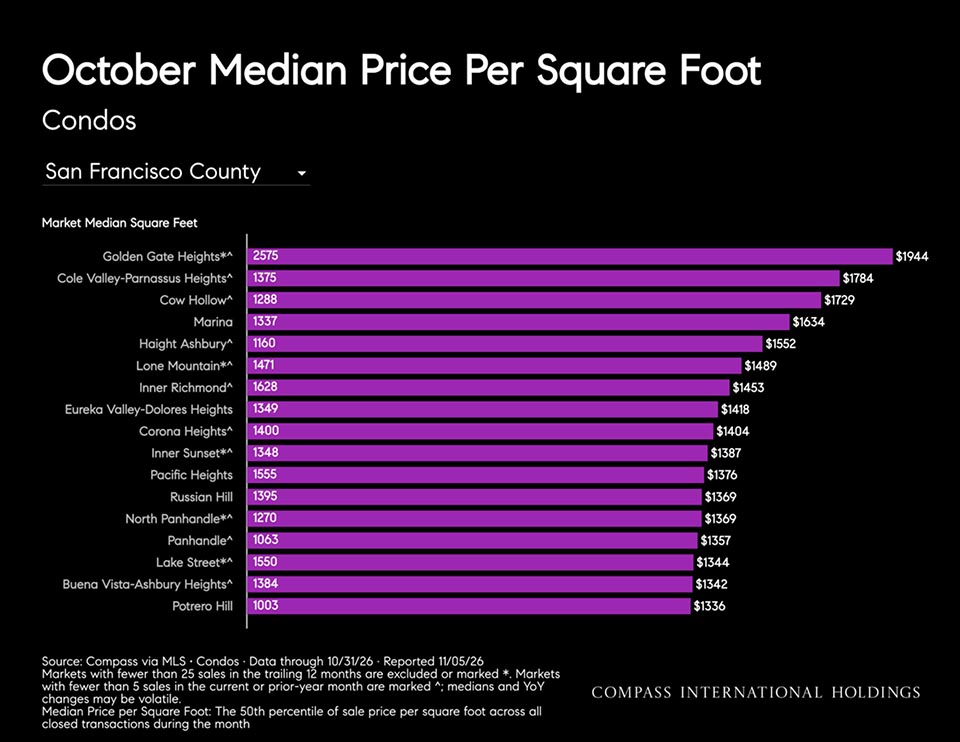
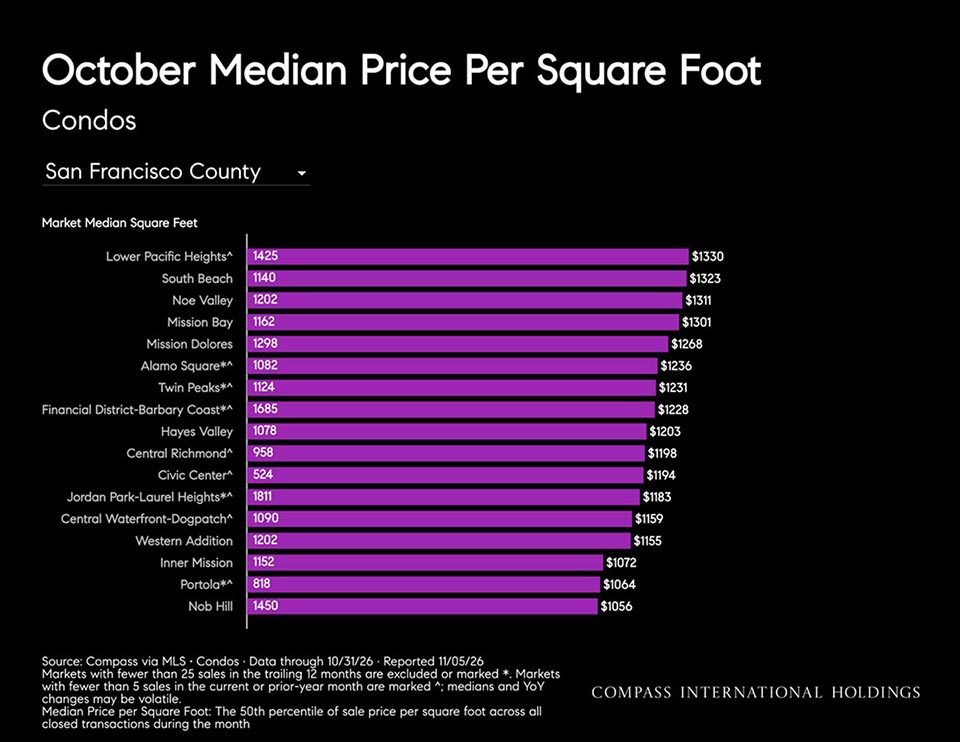
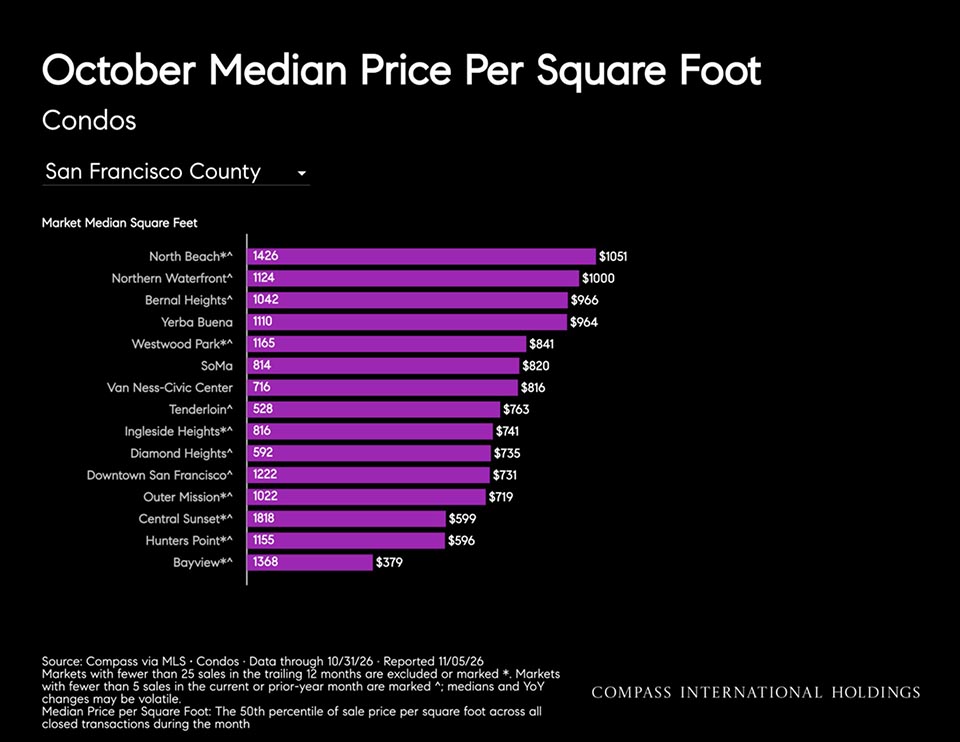
October Median Price Per Square Foot Condos

October Median Price Per Square Foot Condos

October Median Price Per Square Foot Condos San Francisco County

Closed Sales Condos

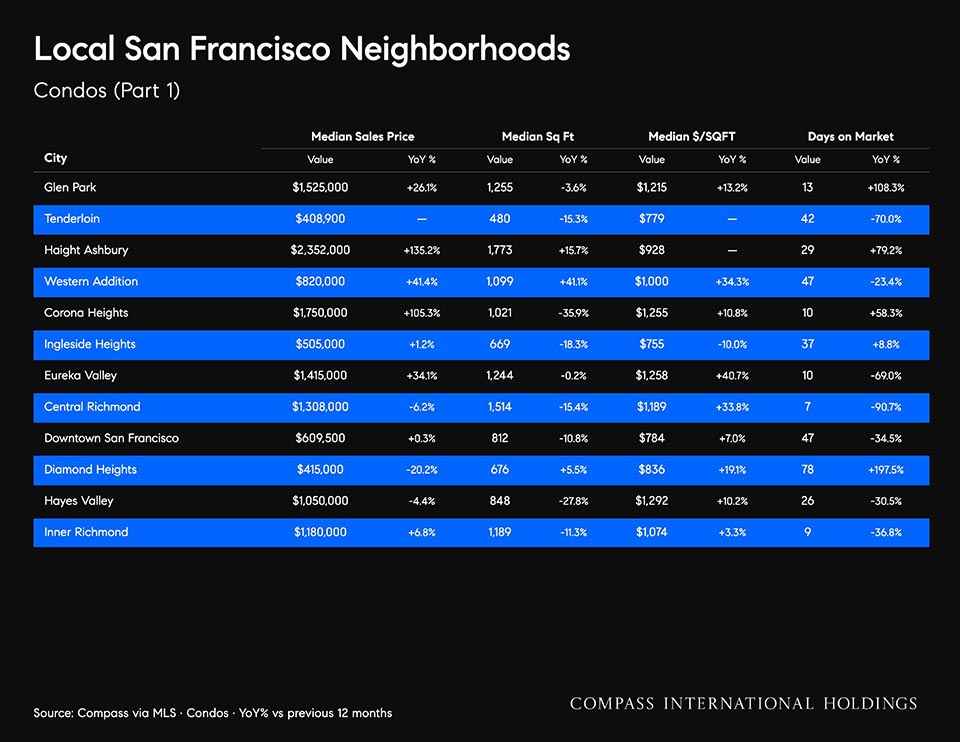
Local San Francisco Neighborhoods Condos (Part 1)

Local San Francisco Neighborhoods Condos (Part 2)

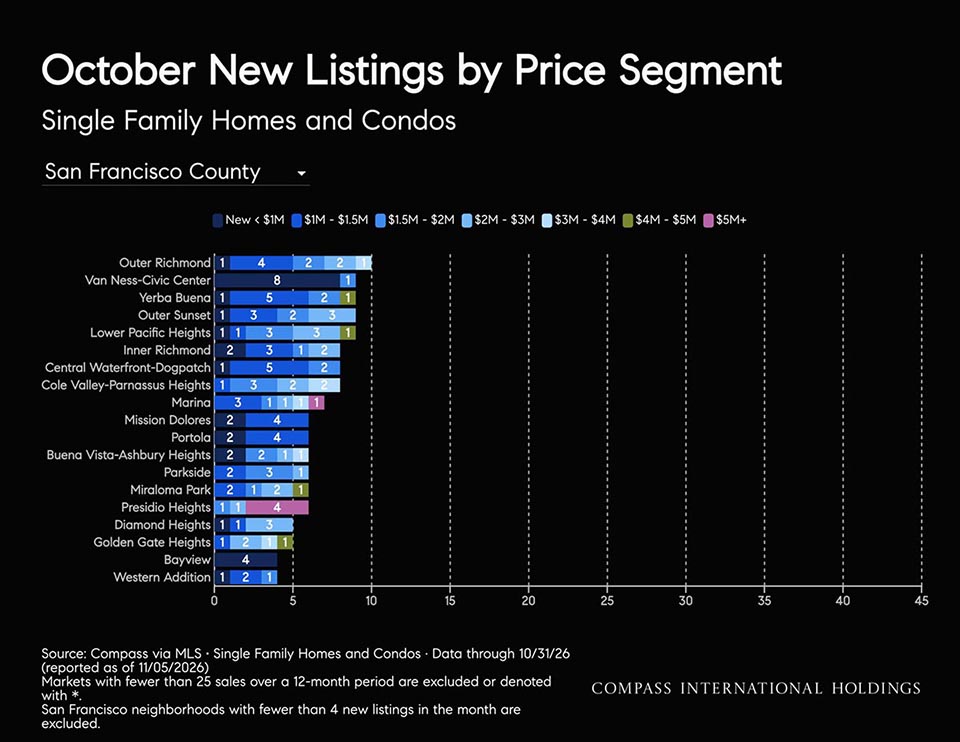
Active & In Contract Listings Compares active and in-contract listings at month-end. A smaller gap indicates stronger demand.Active & In Contract Listings Compares active and in-contract listings at month-end. A smaller gap indicates stronger demand.October New Listings by Price Segment Single Family Homes and Condos

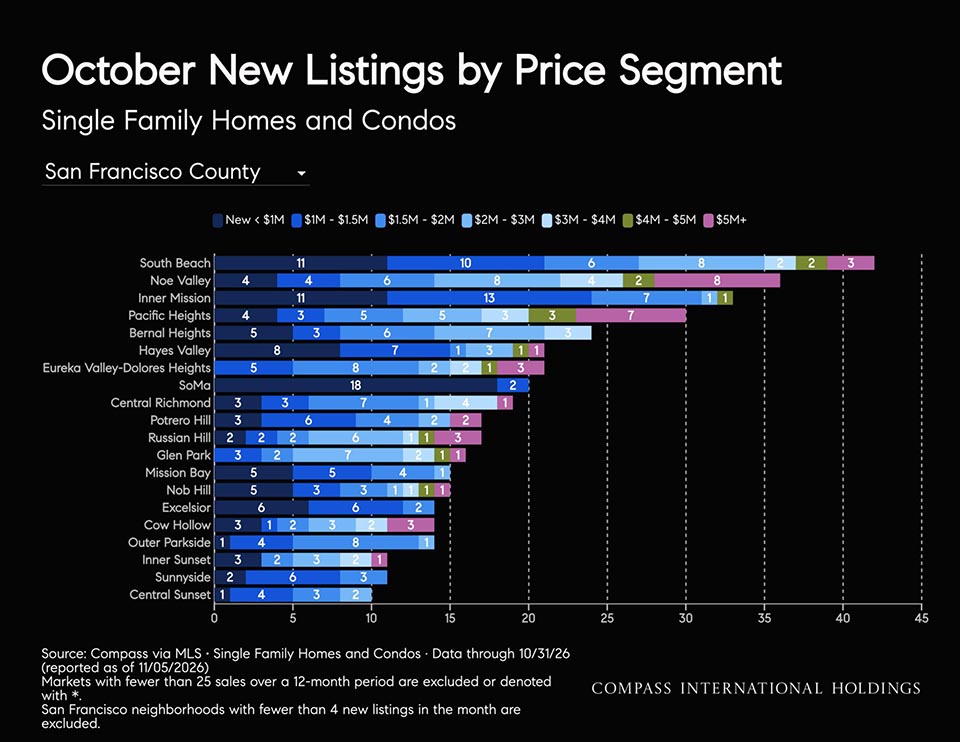
October New Listings by Price Segment Single Family Homes and Condos

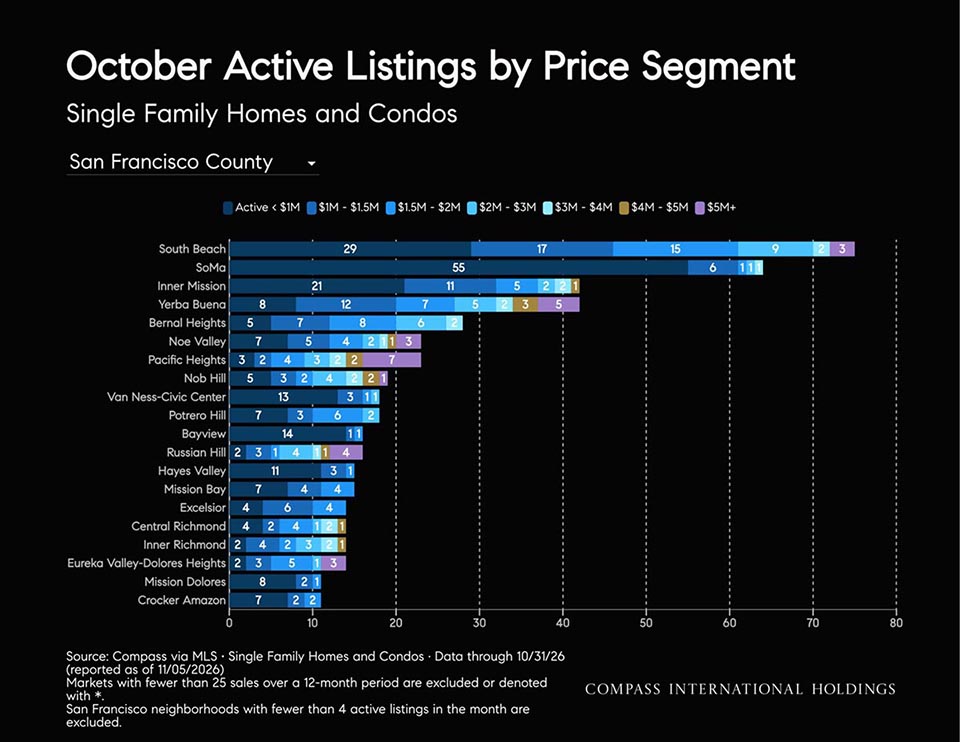
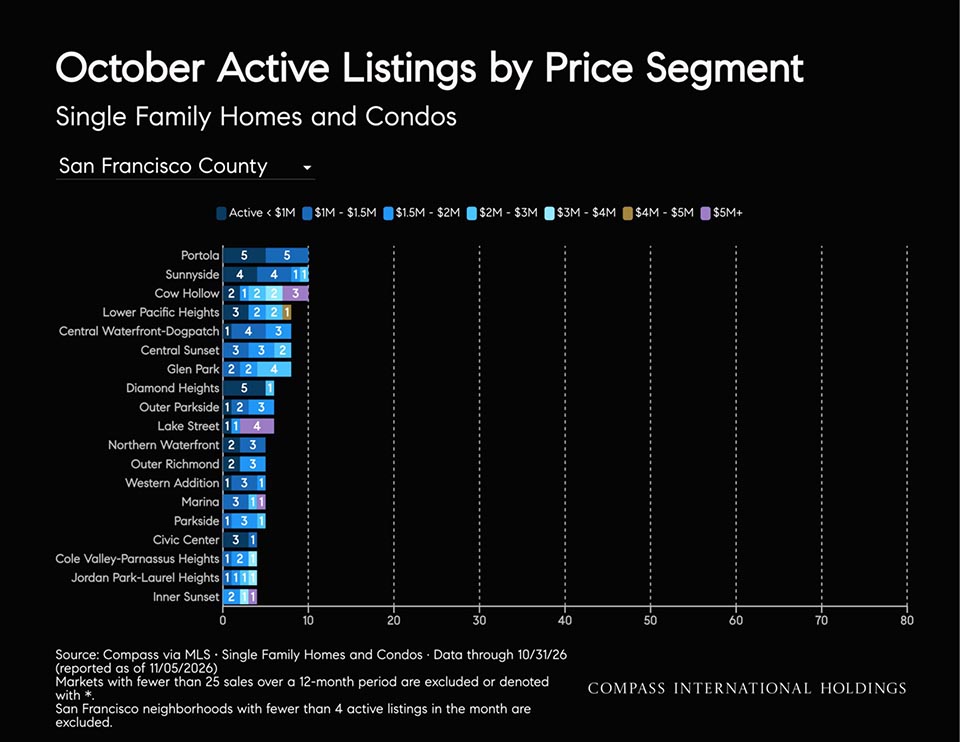
October Active Listings by Price Segment Single Family Homes and Condos

October Active Listings by Price Segment Single Family Homes and Condos

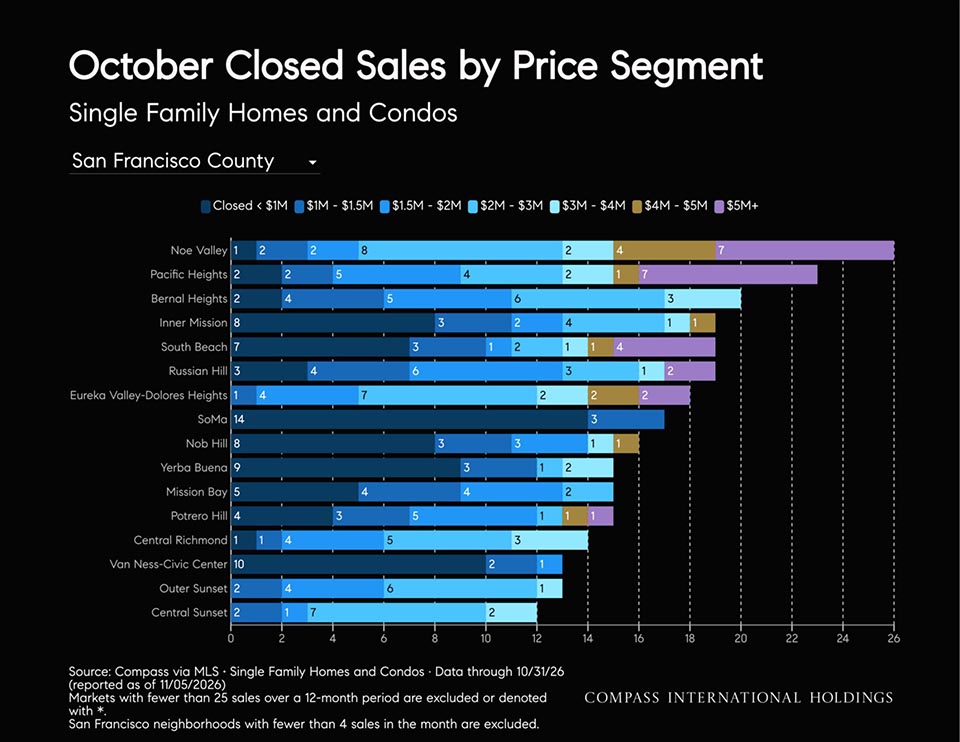
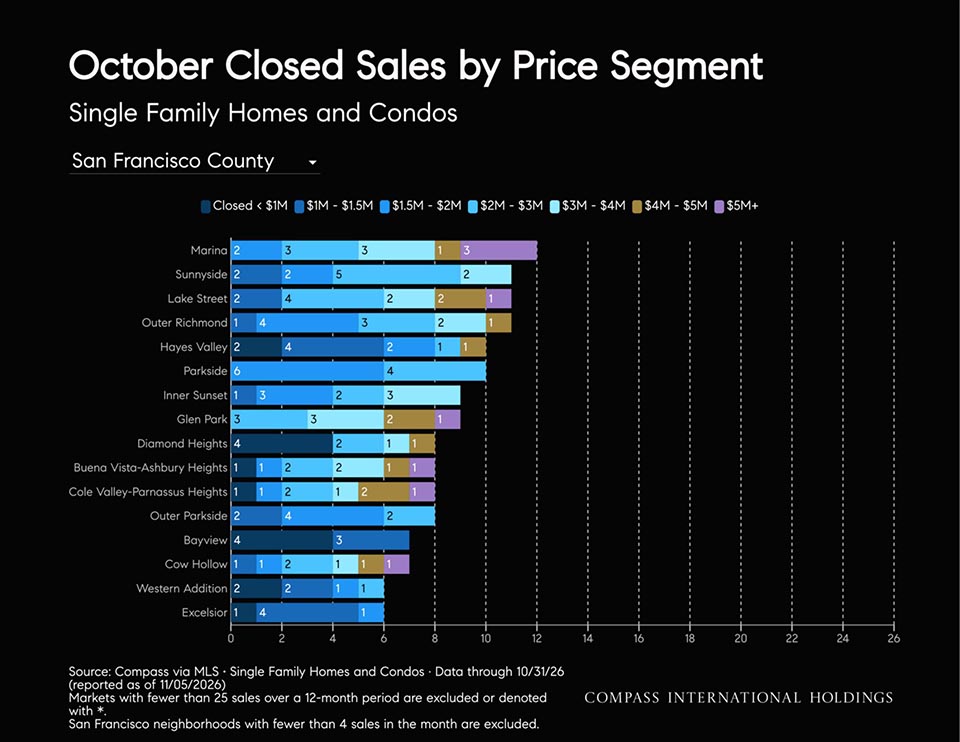
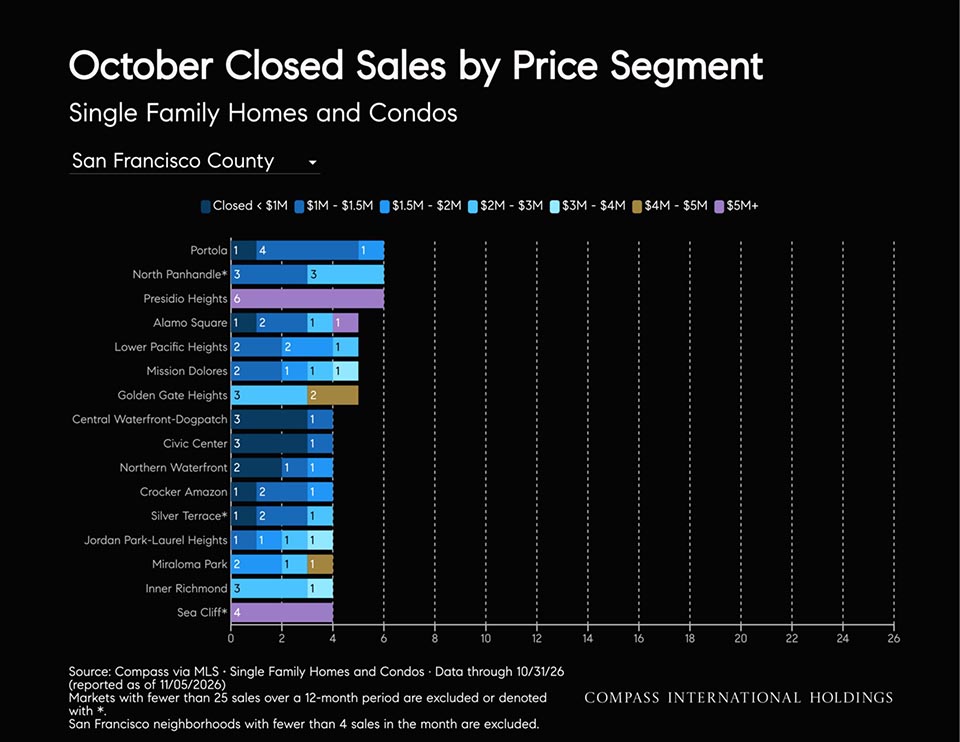
October Closed Sales by Price Segment Single Family Homes and Condos

October Closed Sales by Price Segment Single Family Homes and Condos

October Closed Sales by Price Segment Single Family Homes and Condos

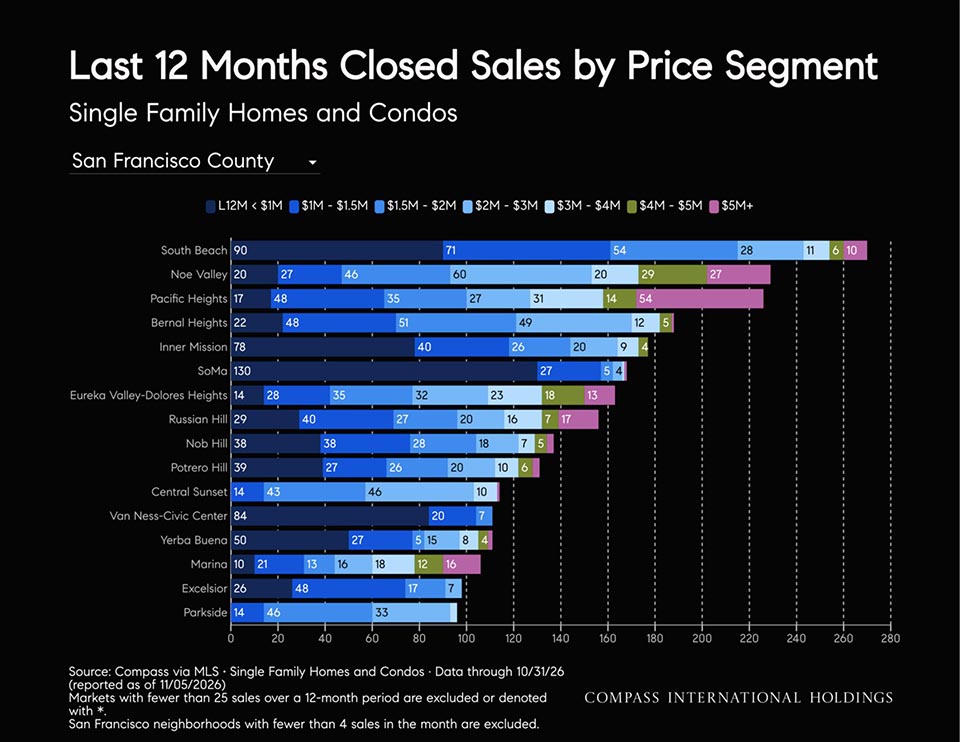
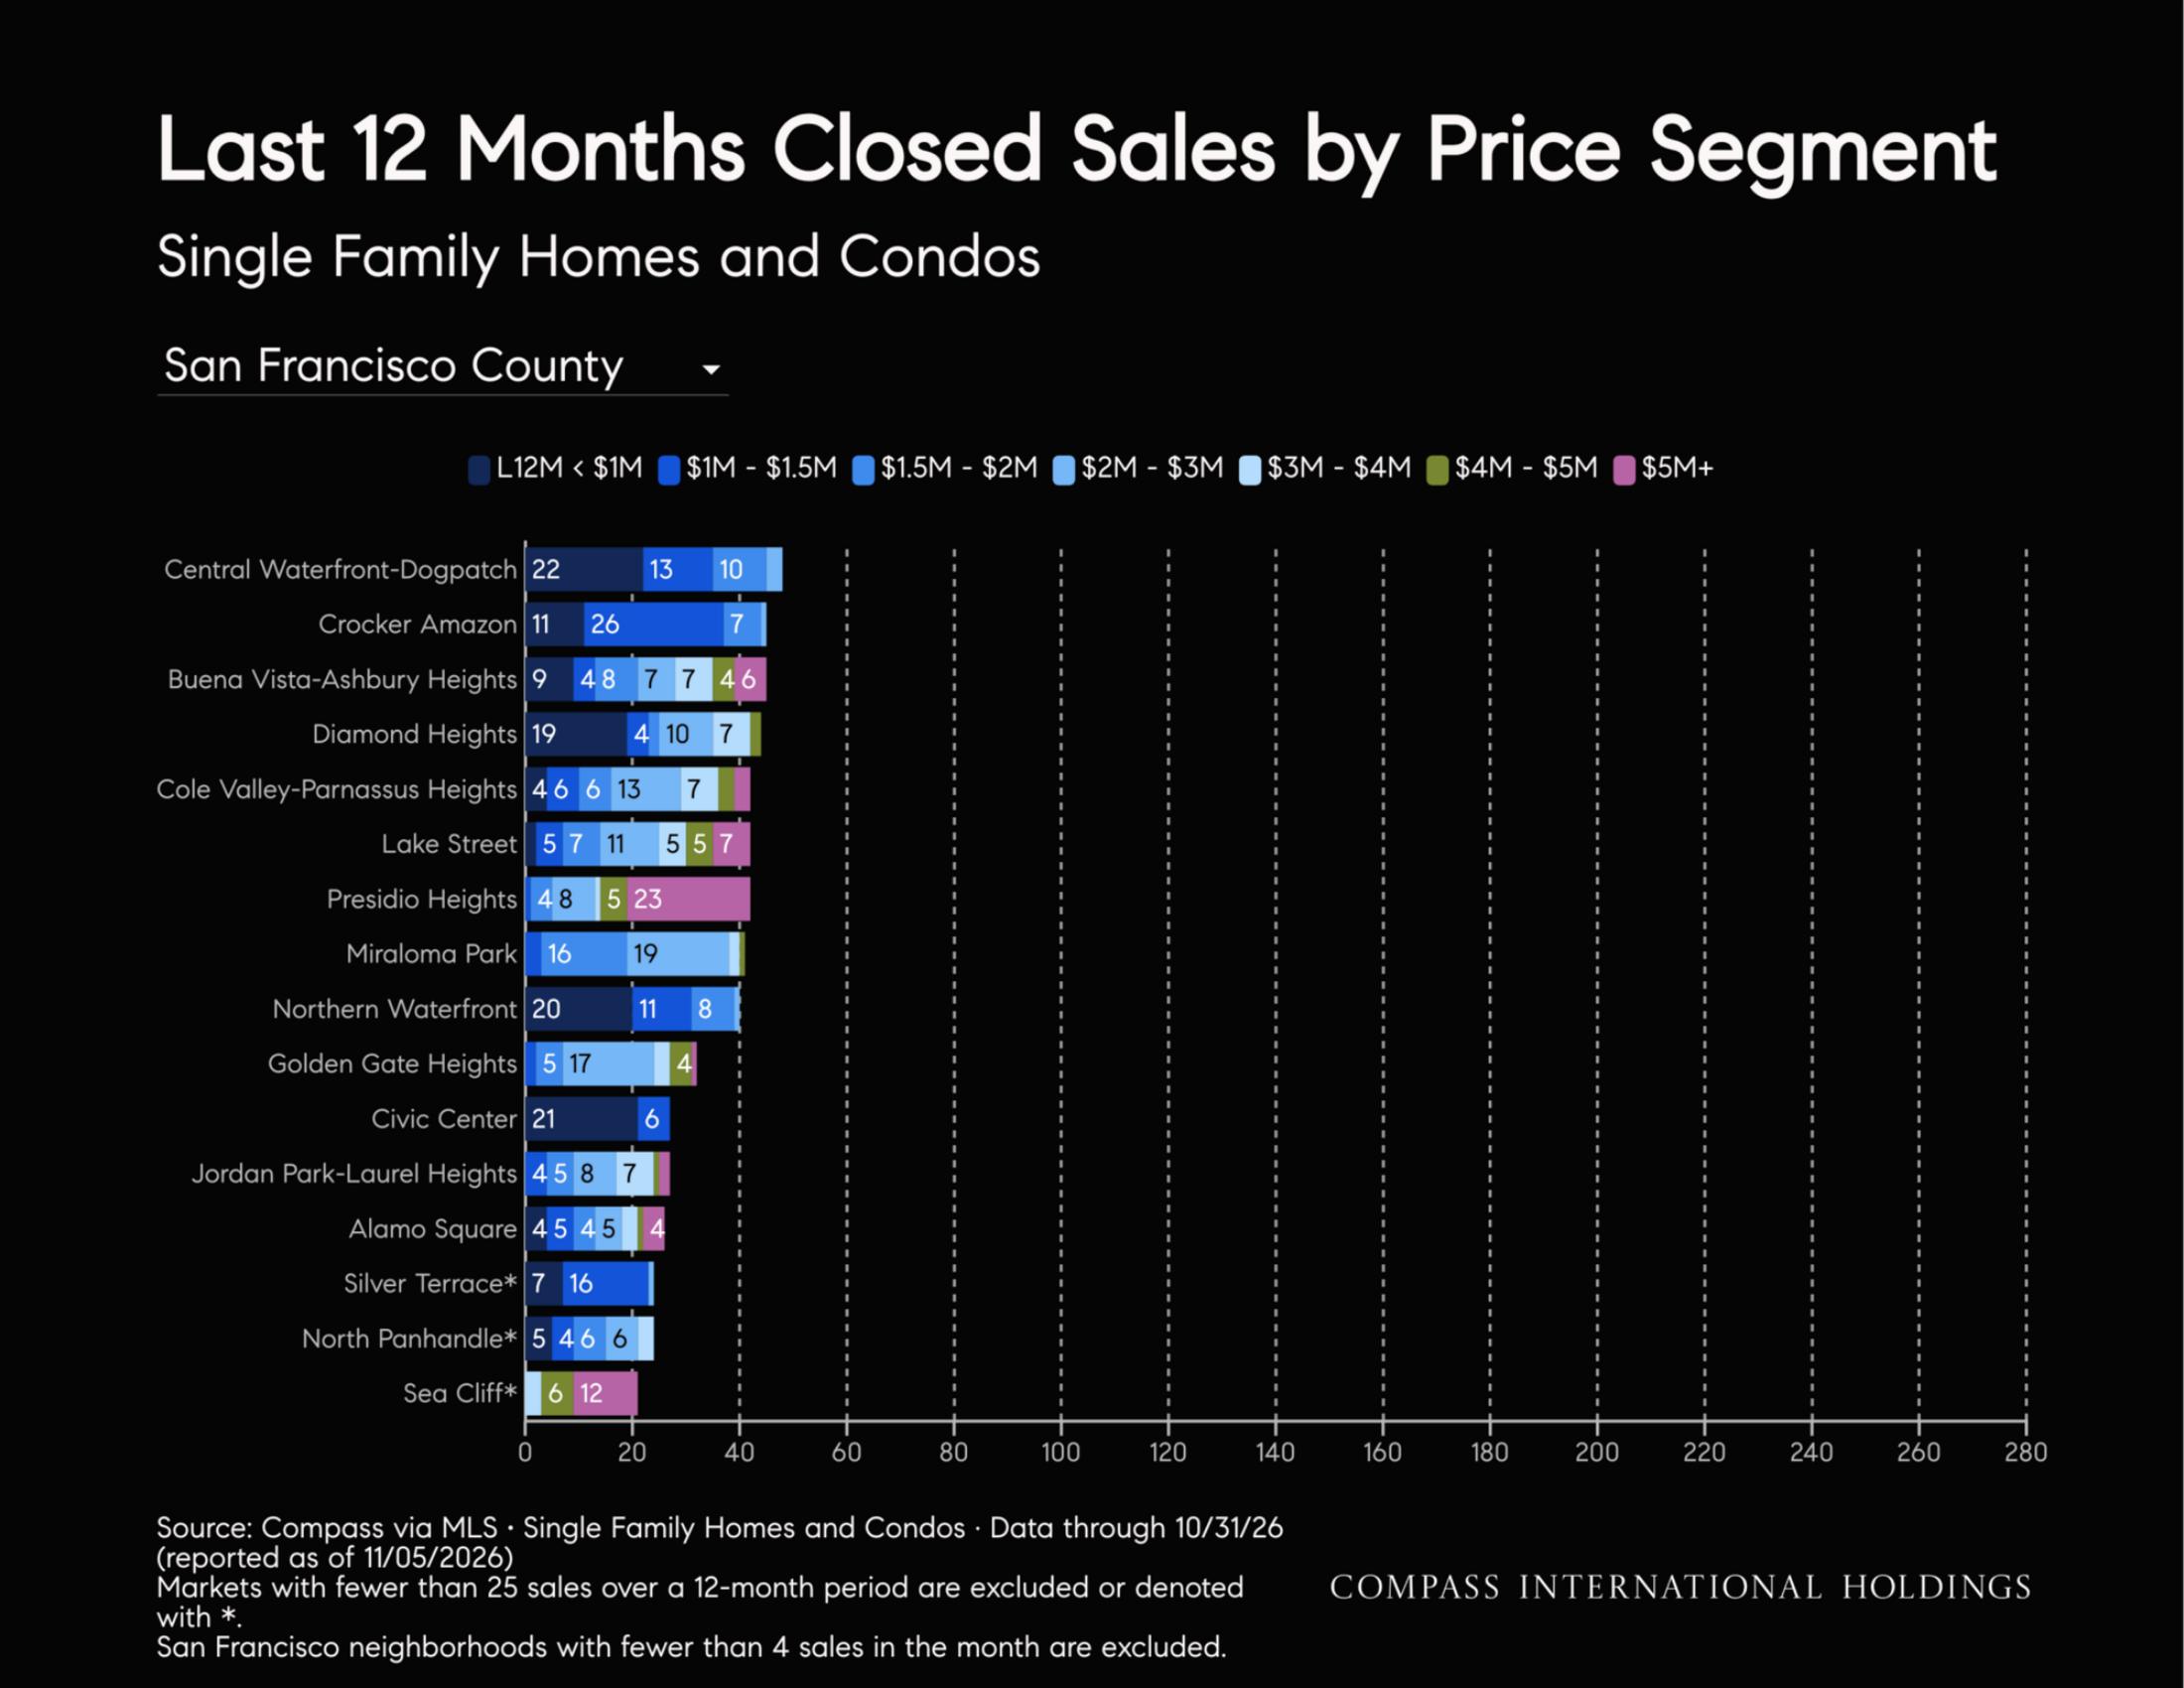
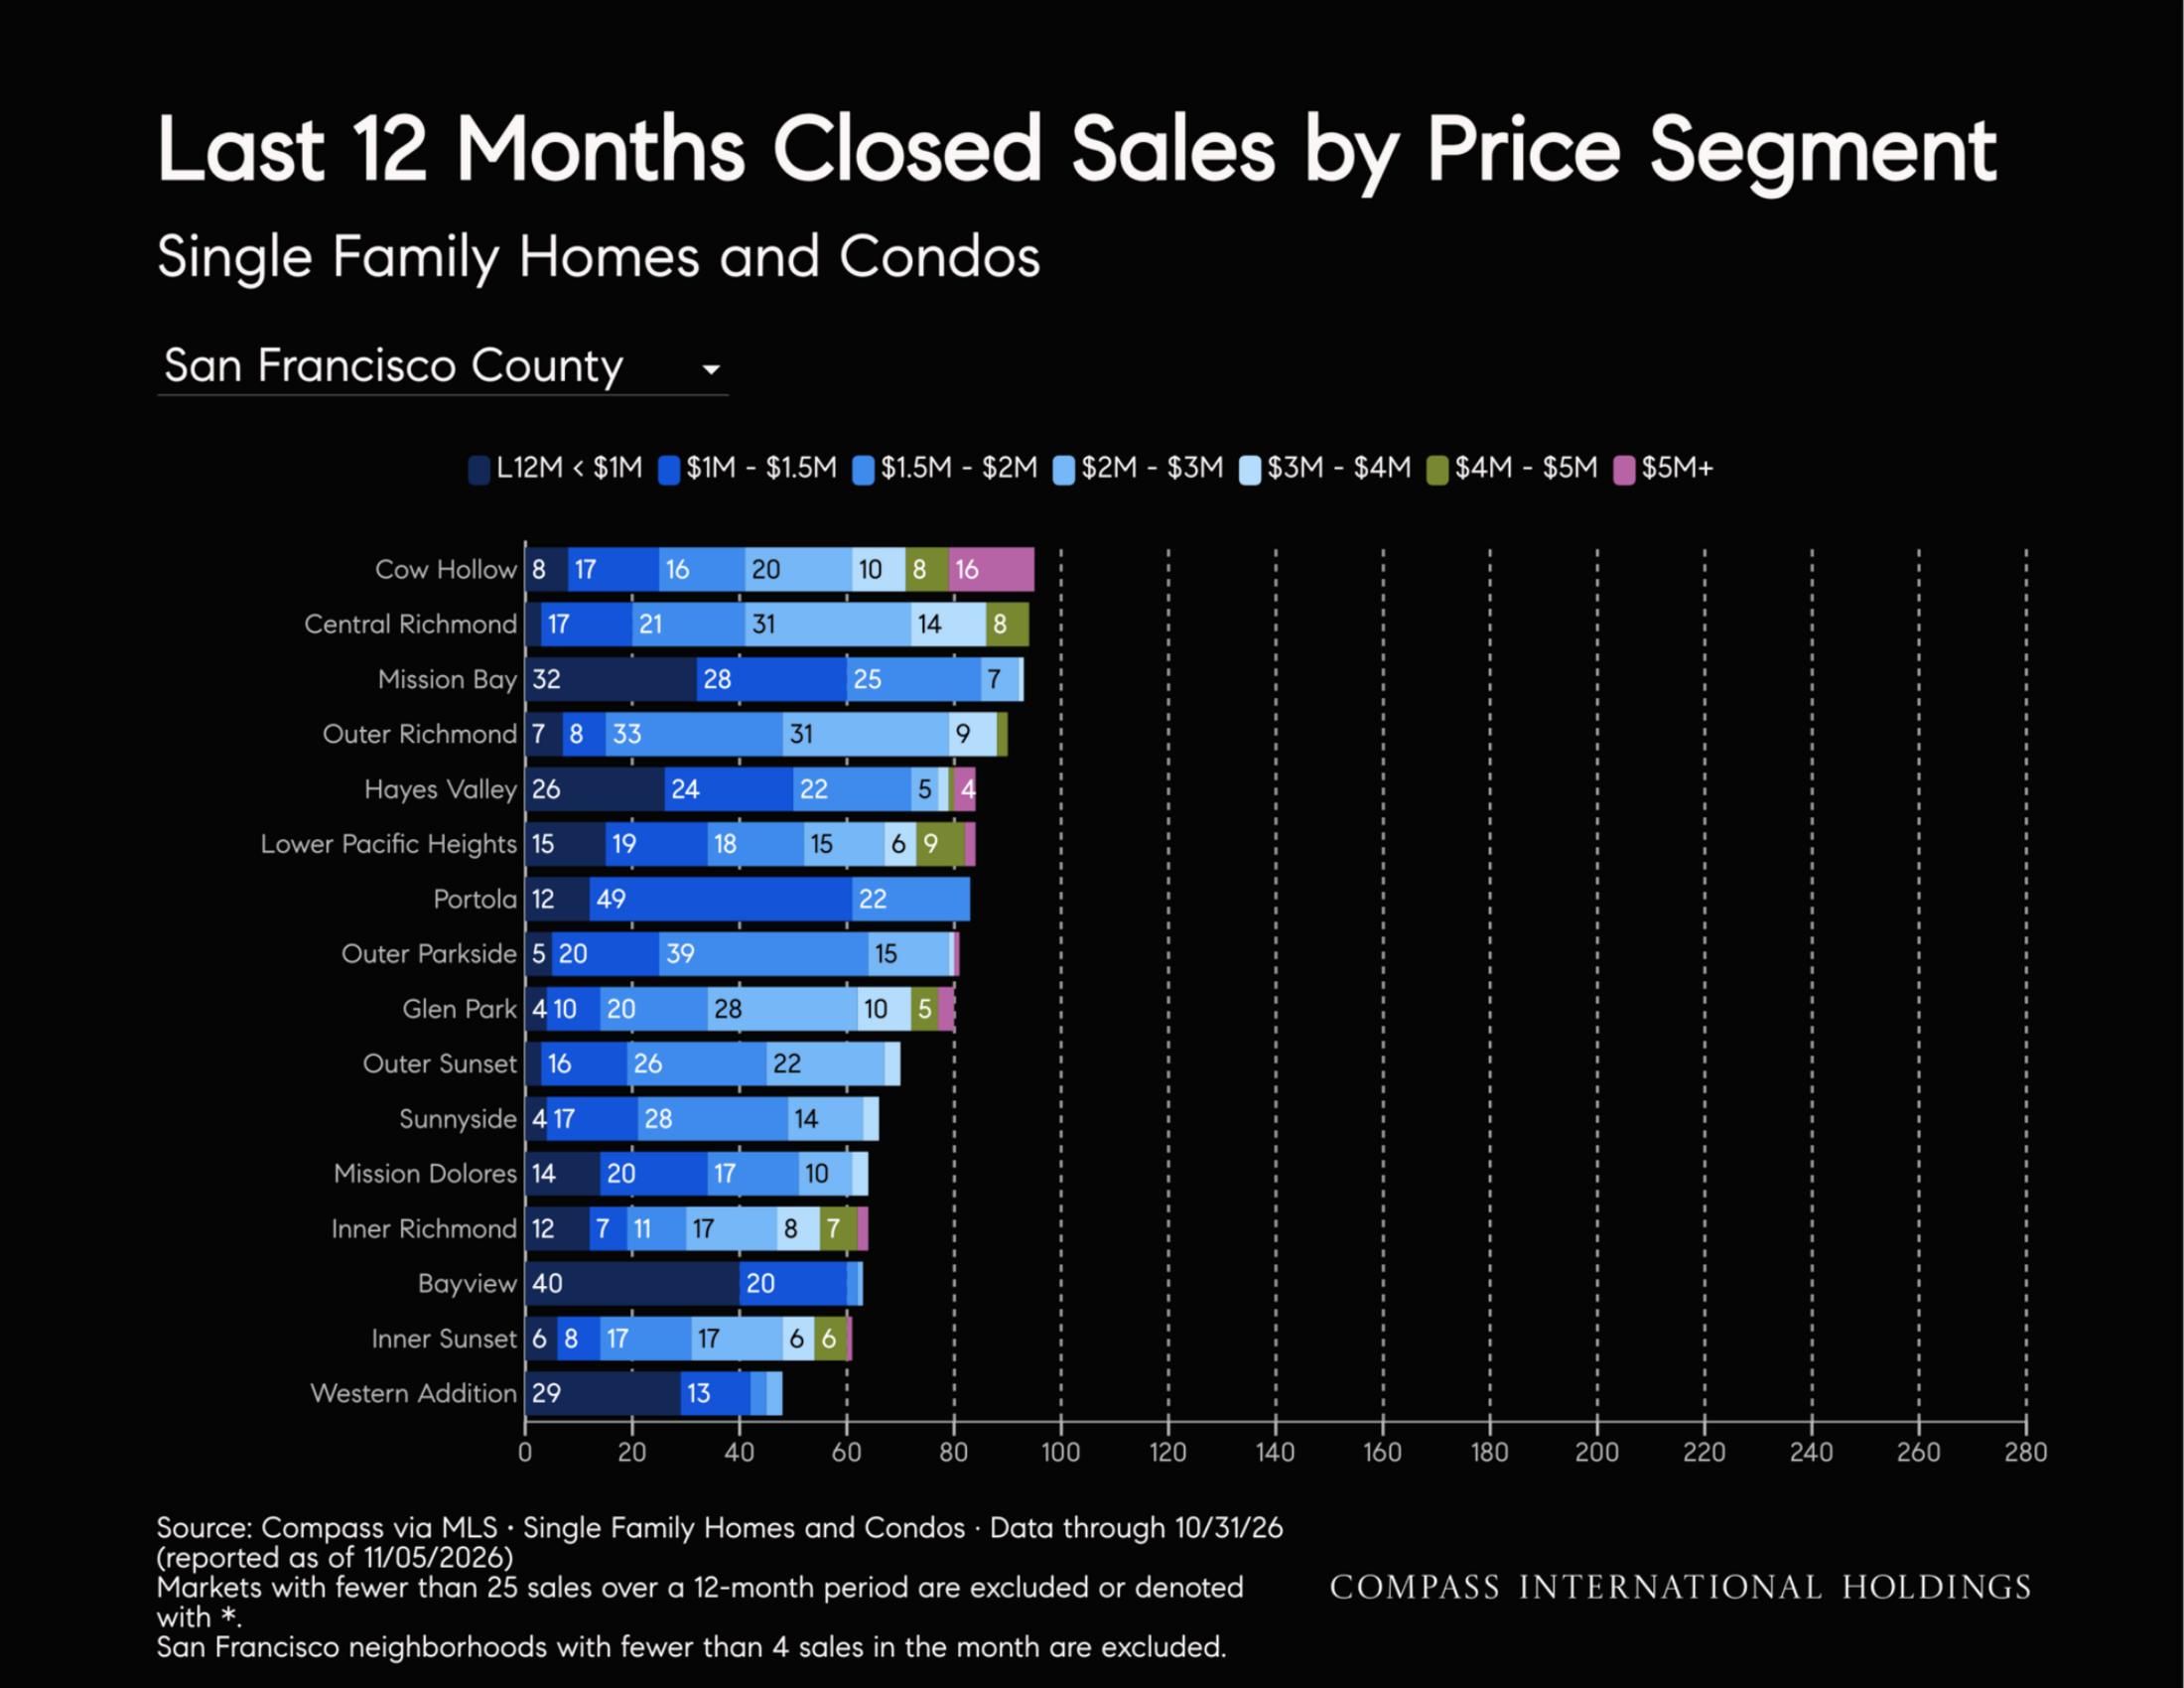
Last 12 Months Closed Sales by Price Segment Single Family Homes and CondosLast 12 Months Closed Sales by Price Segment Single Family Homes and CondosLast 12 Months Closed Sales by Price Segment Single Family Homes and CondosHome Price Changes Over Time Median sales prices in San Francisco increased by 29.7% from October last year.

Want to learn more about Bay Area market trends?

Let’s connect! With relationships and networks across the city, there are a variety of ways I can help you make informed real estate decisions. Call, email, or text – I’m here to help.


Contact