October 10, 2024
SF: October 2024 Market Stats
By Compass
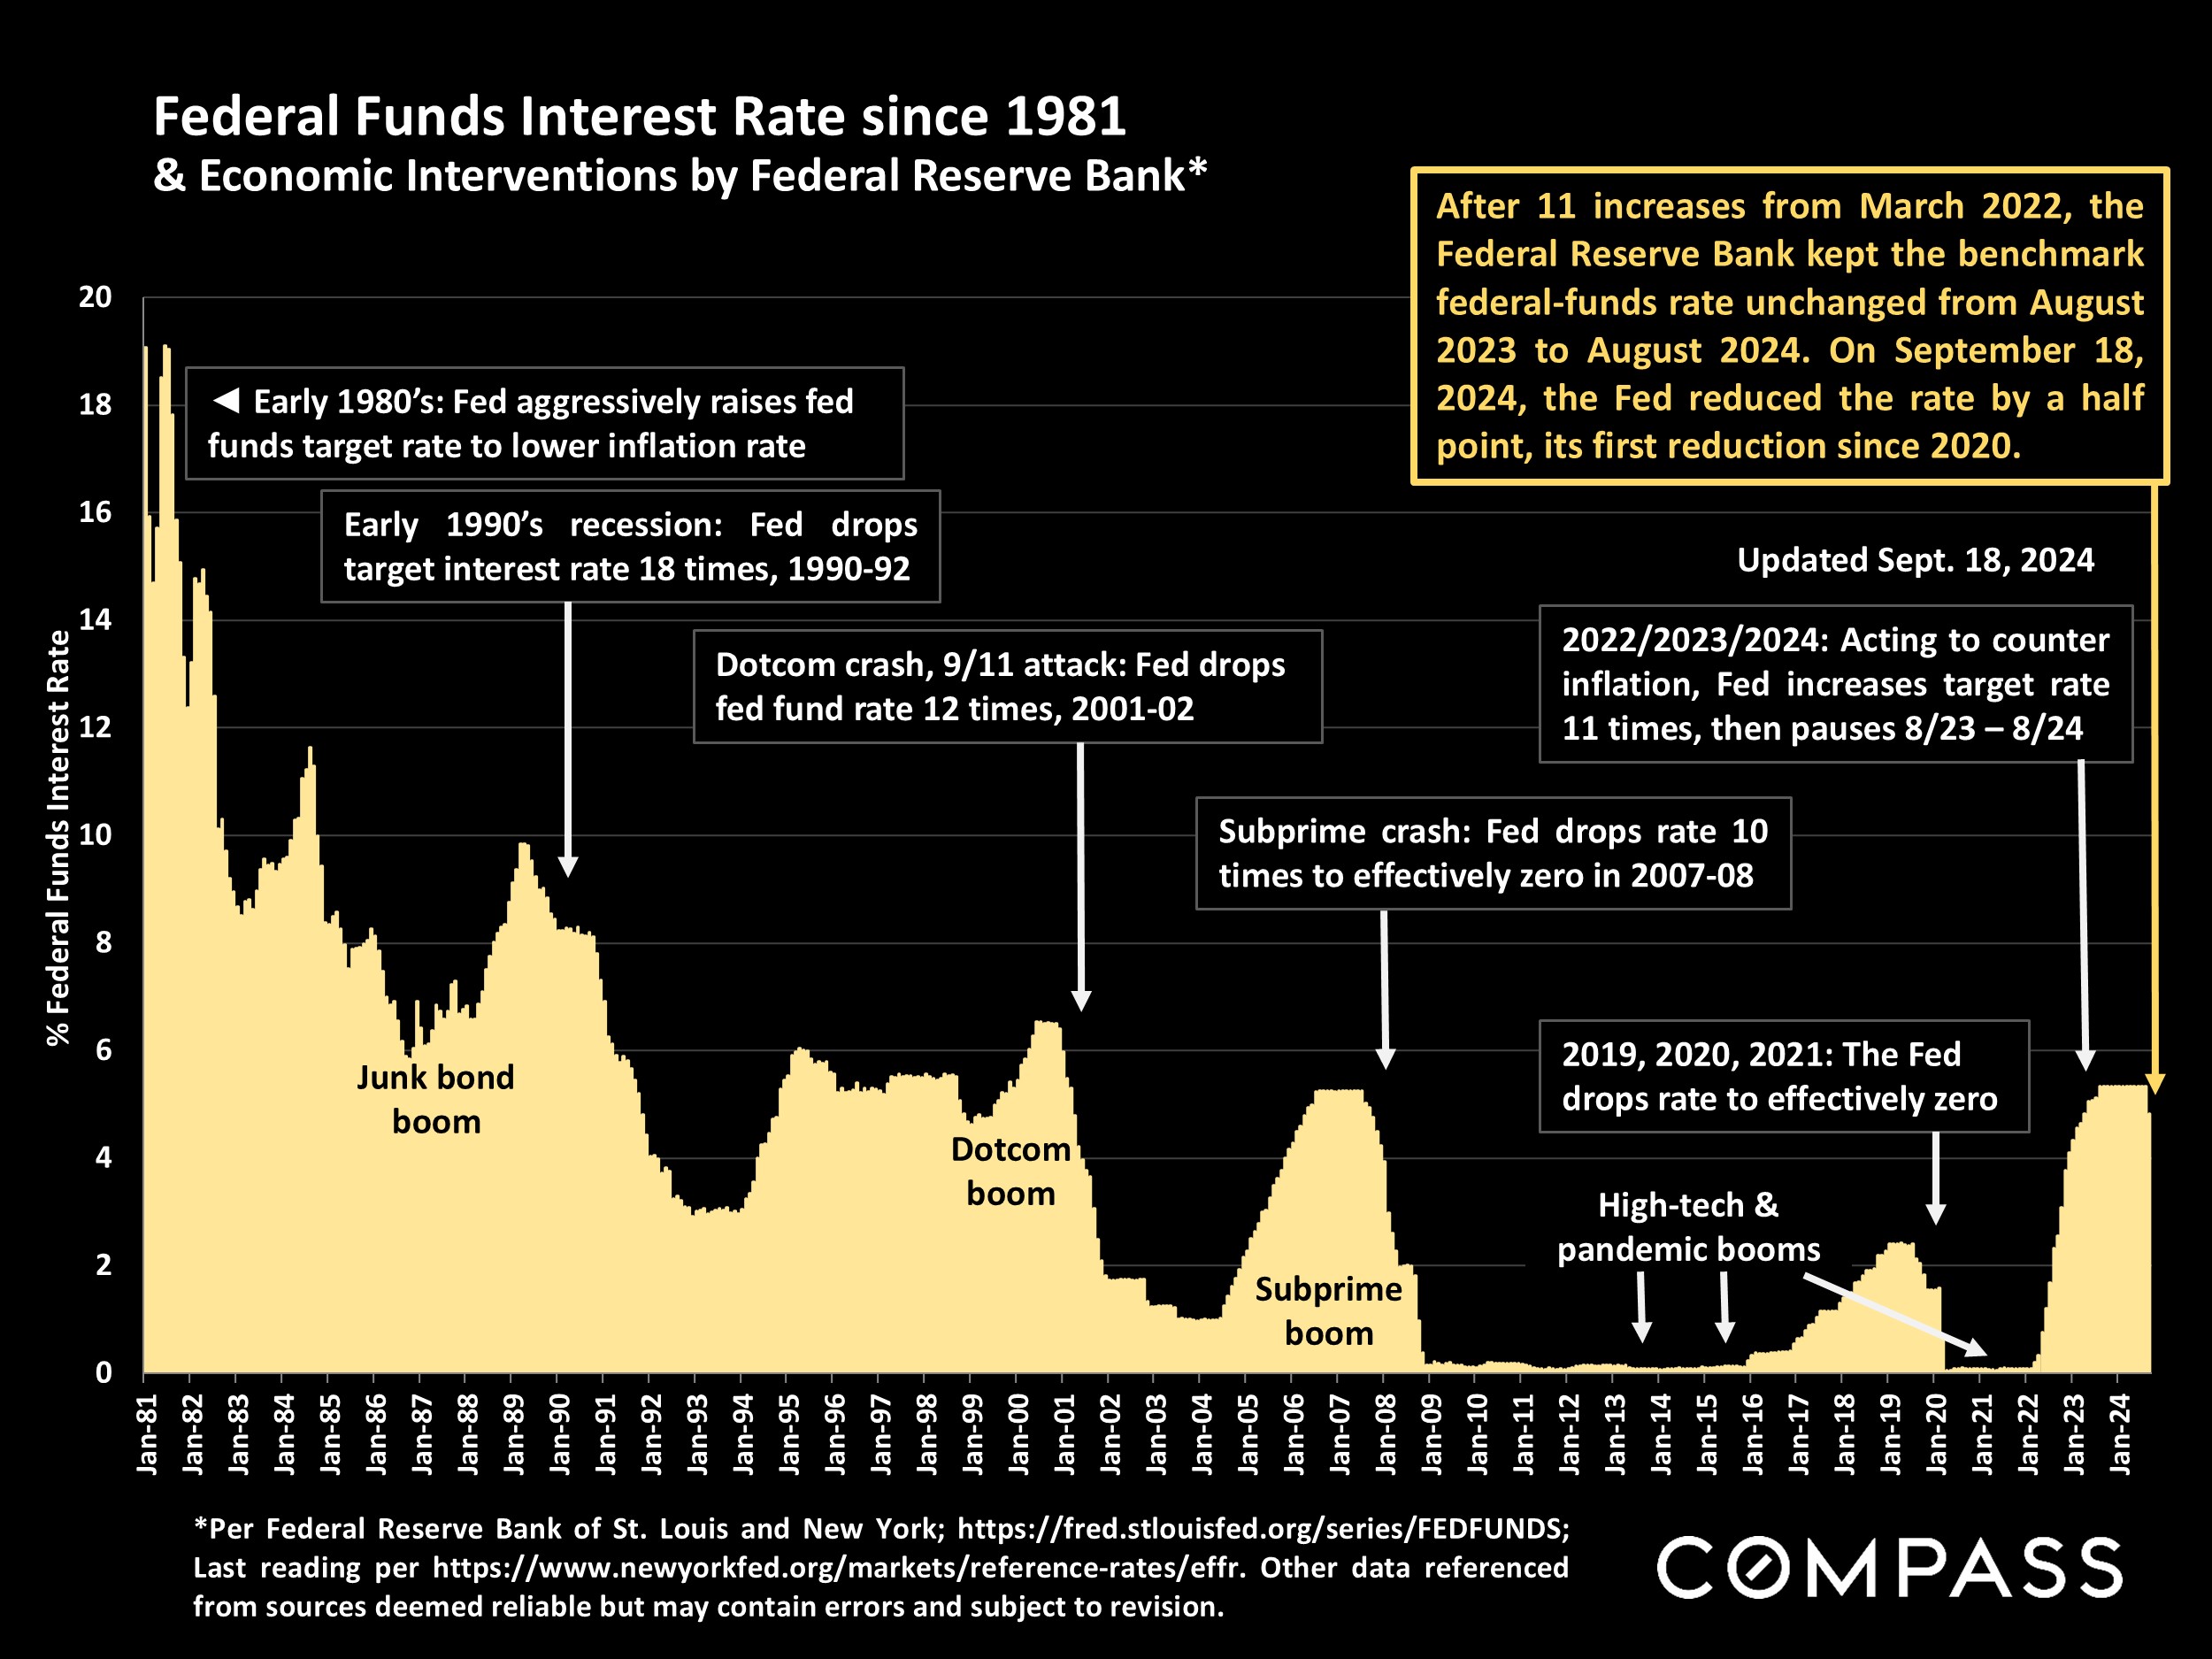
On September 18th, the Federal Reserve Bank dropped its benchmark rate for the first time since 2020 - a very positive development for housing markets - and many analysts expect one or more additional cuts before the end of the year. In their latest readings, inflation fell to its lowest point in 3½ years and consumer confidence improved for the 4th month running. Stock markets have been volatile since mid-July, but remain close to all-time highs.
As of early October, mortgage rates were the lowest since February 2023, but then an unexpectedly strong jobs report caused them to spike back up, perhaps just a short-term fluctuation amid the major downward trend of recent months. It has been very challenging in recent years to predict changes in interest rates, as there are many unpredictable national & international economic and political factors at play, but the consensus opinion is that rates will (probably) continue to decline in Q4.
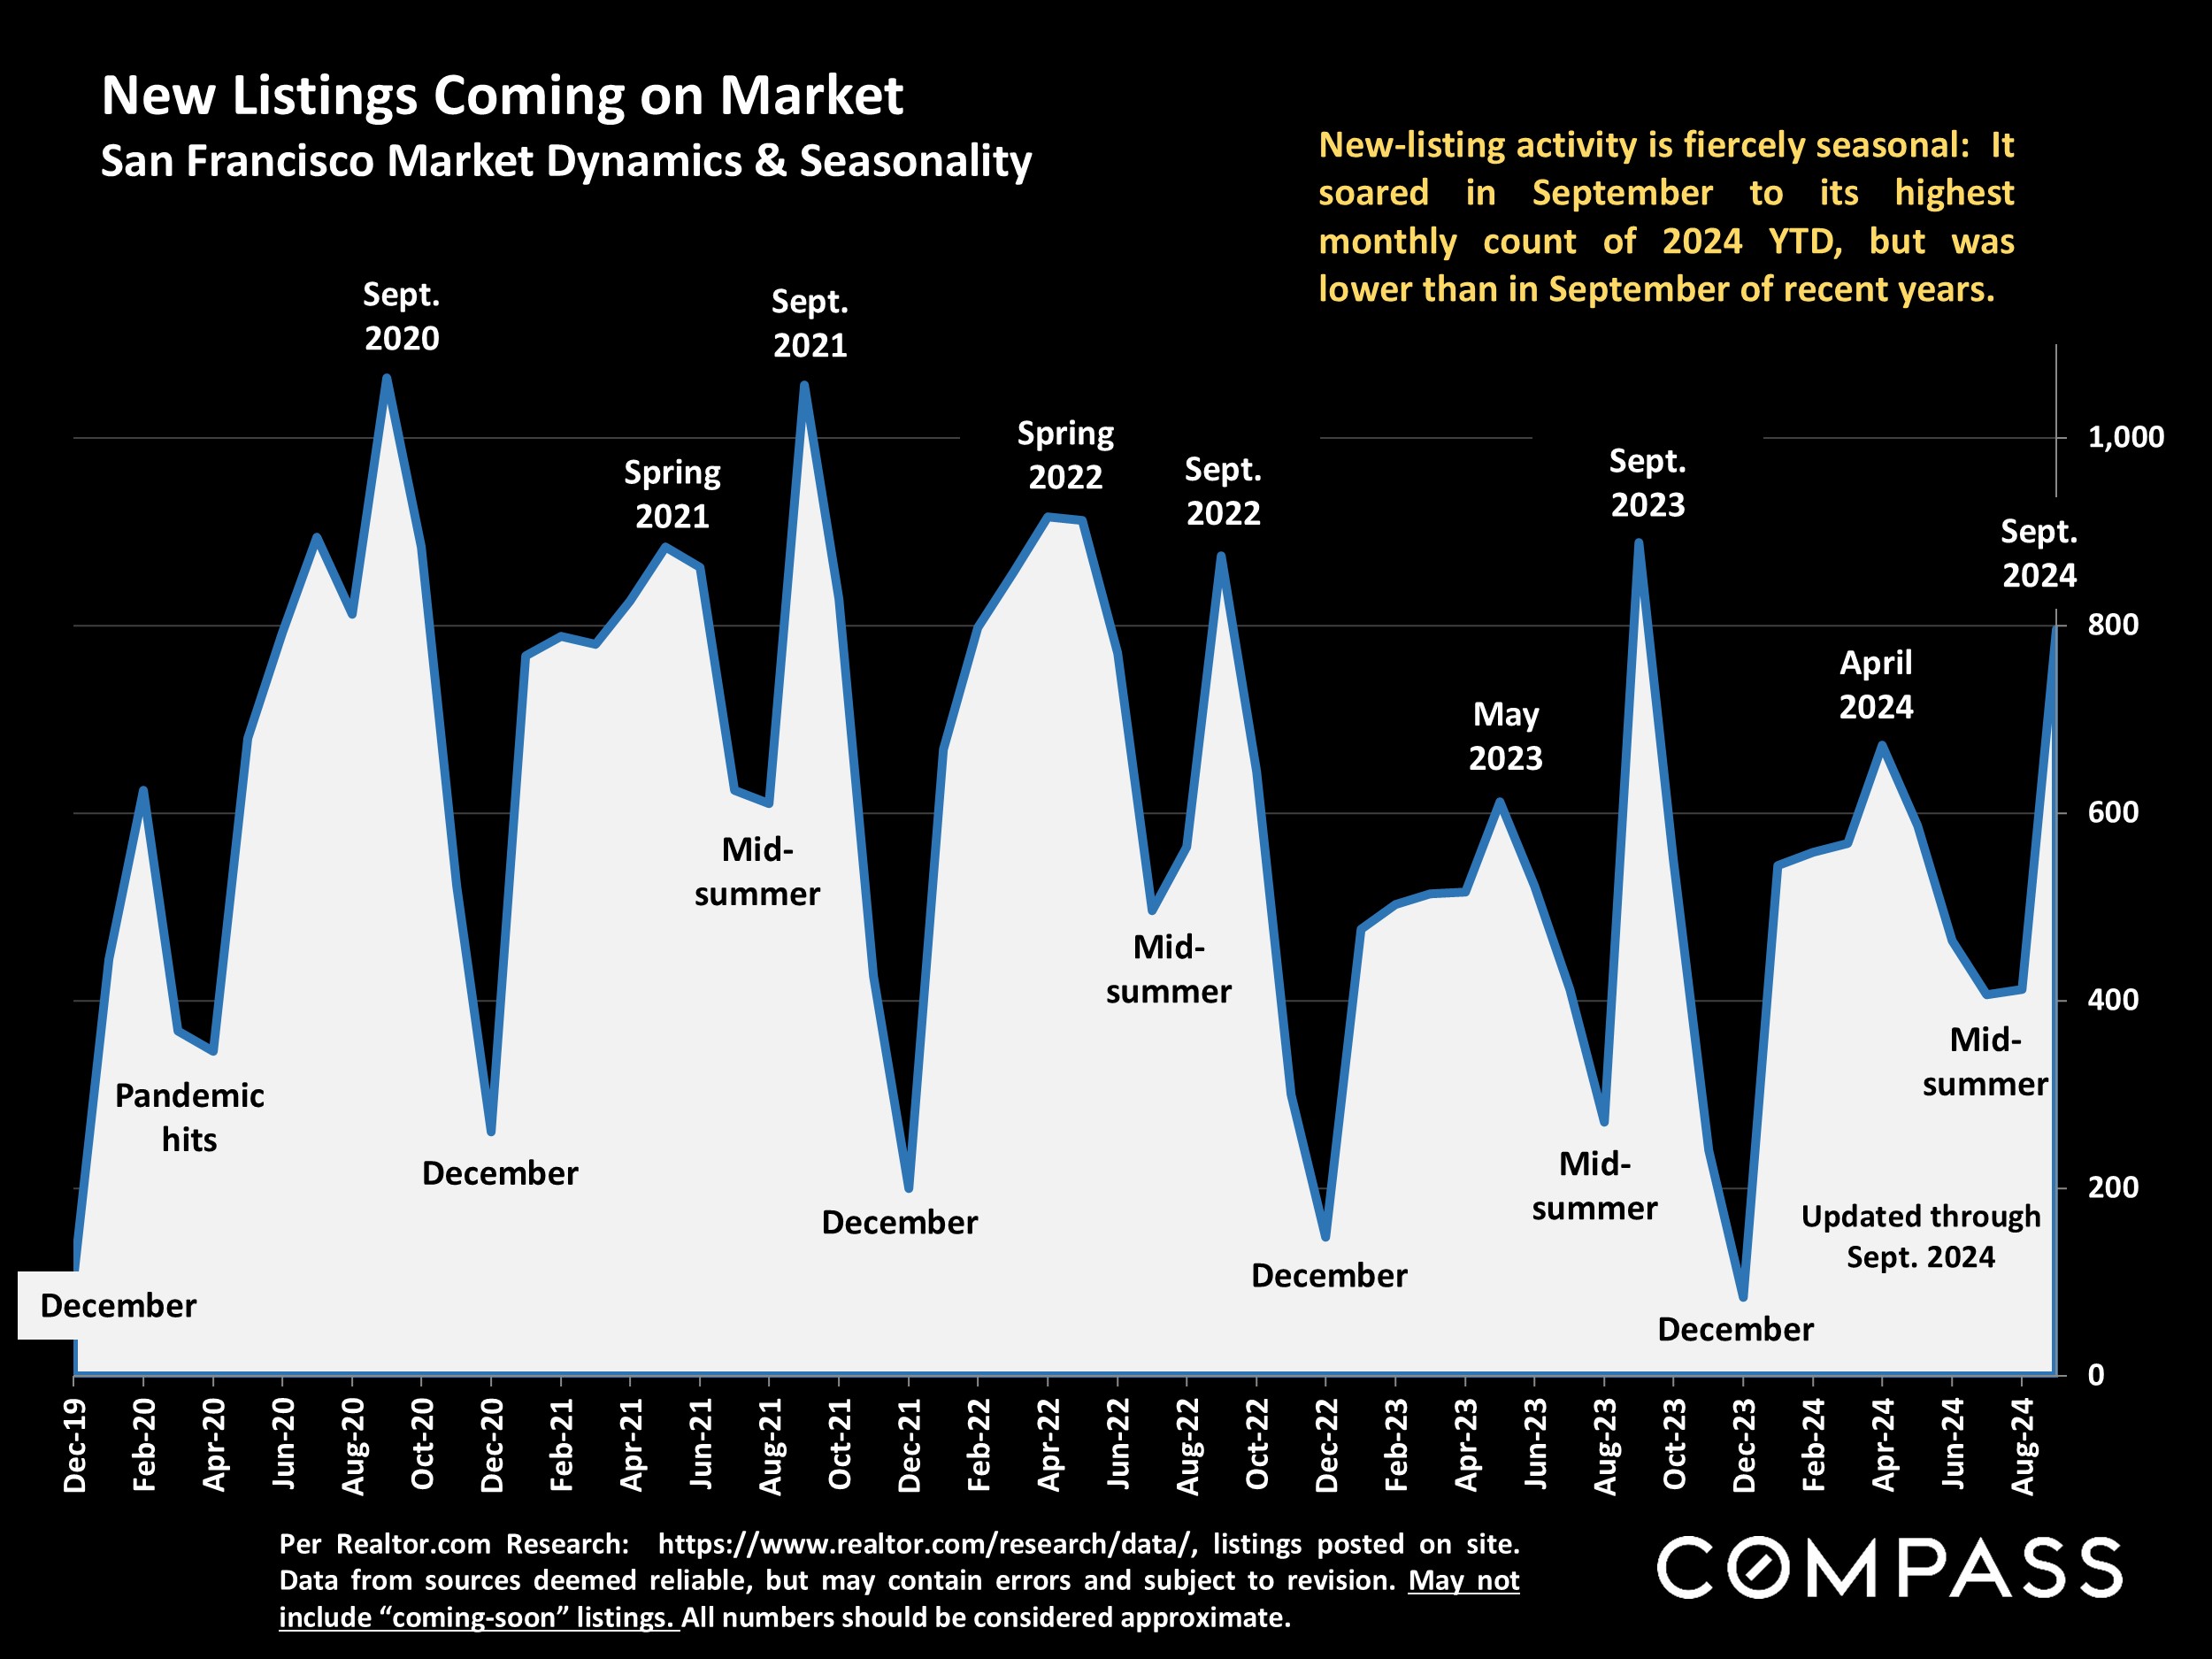
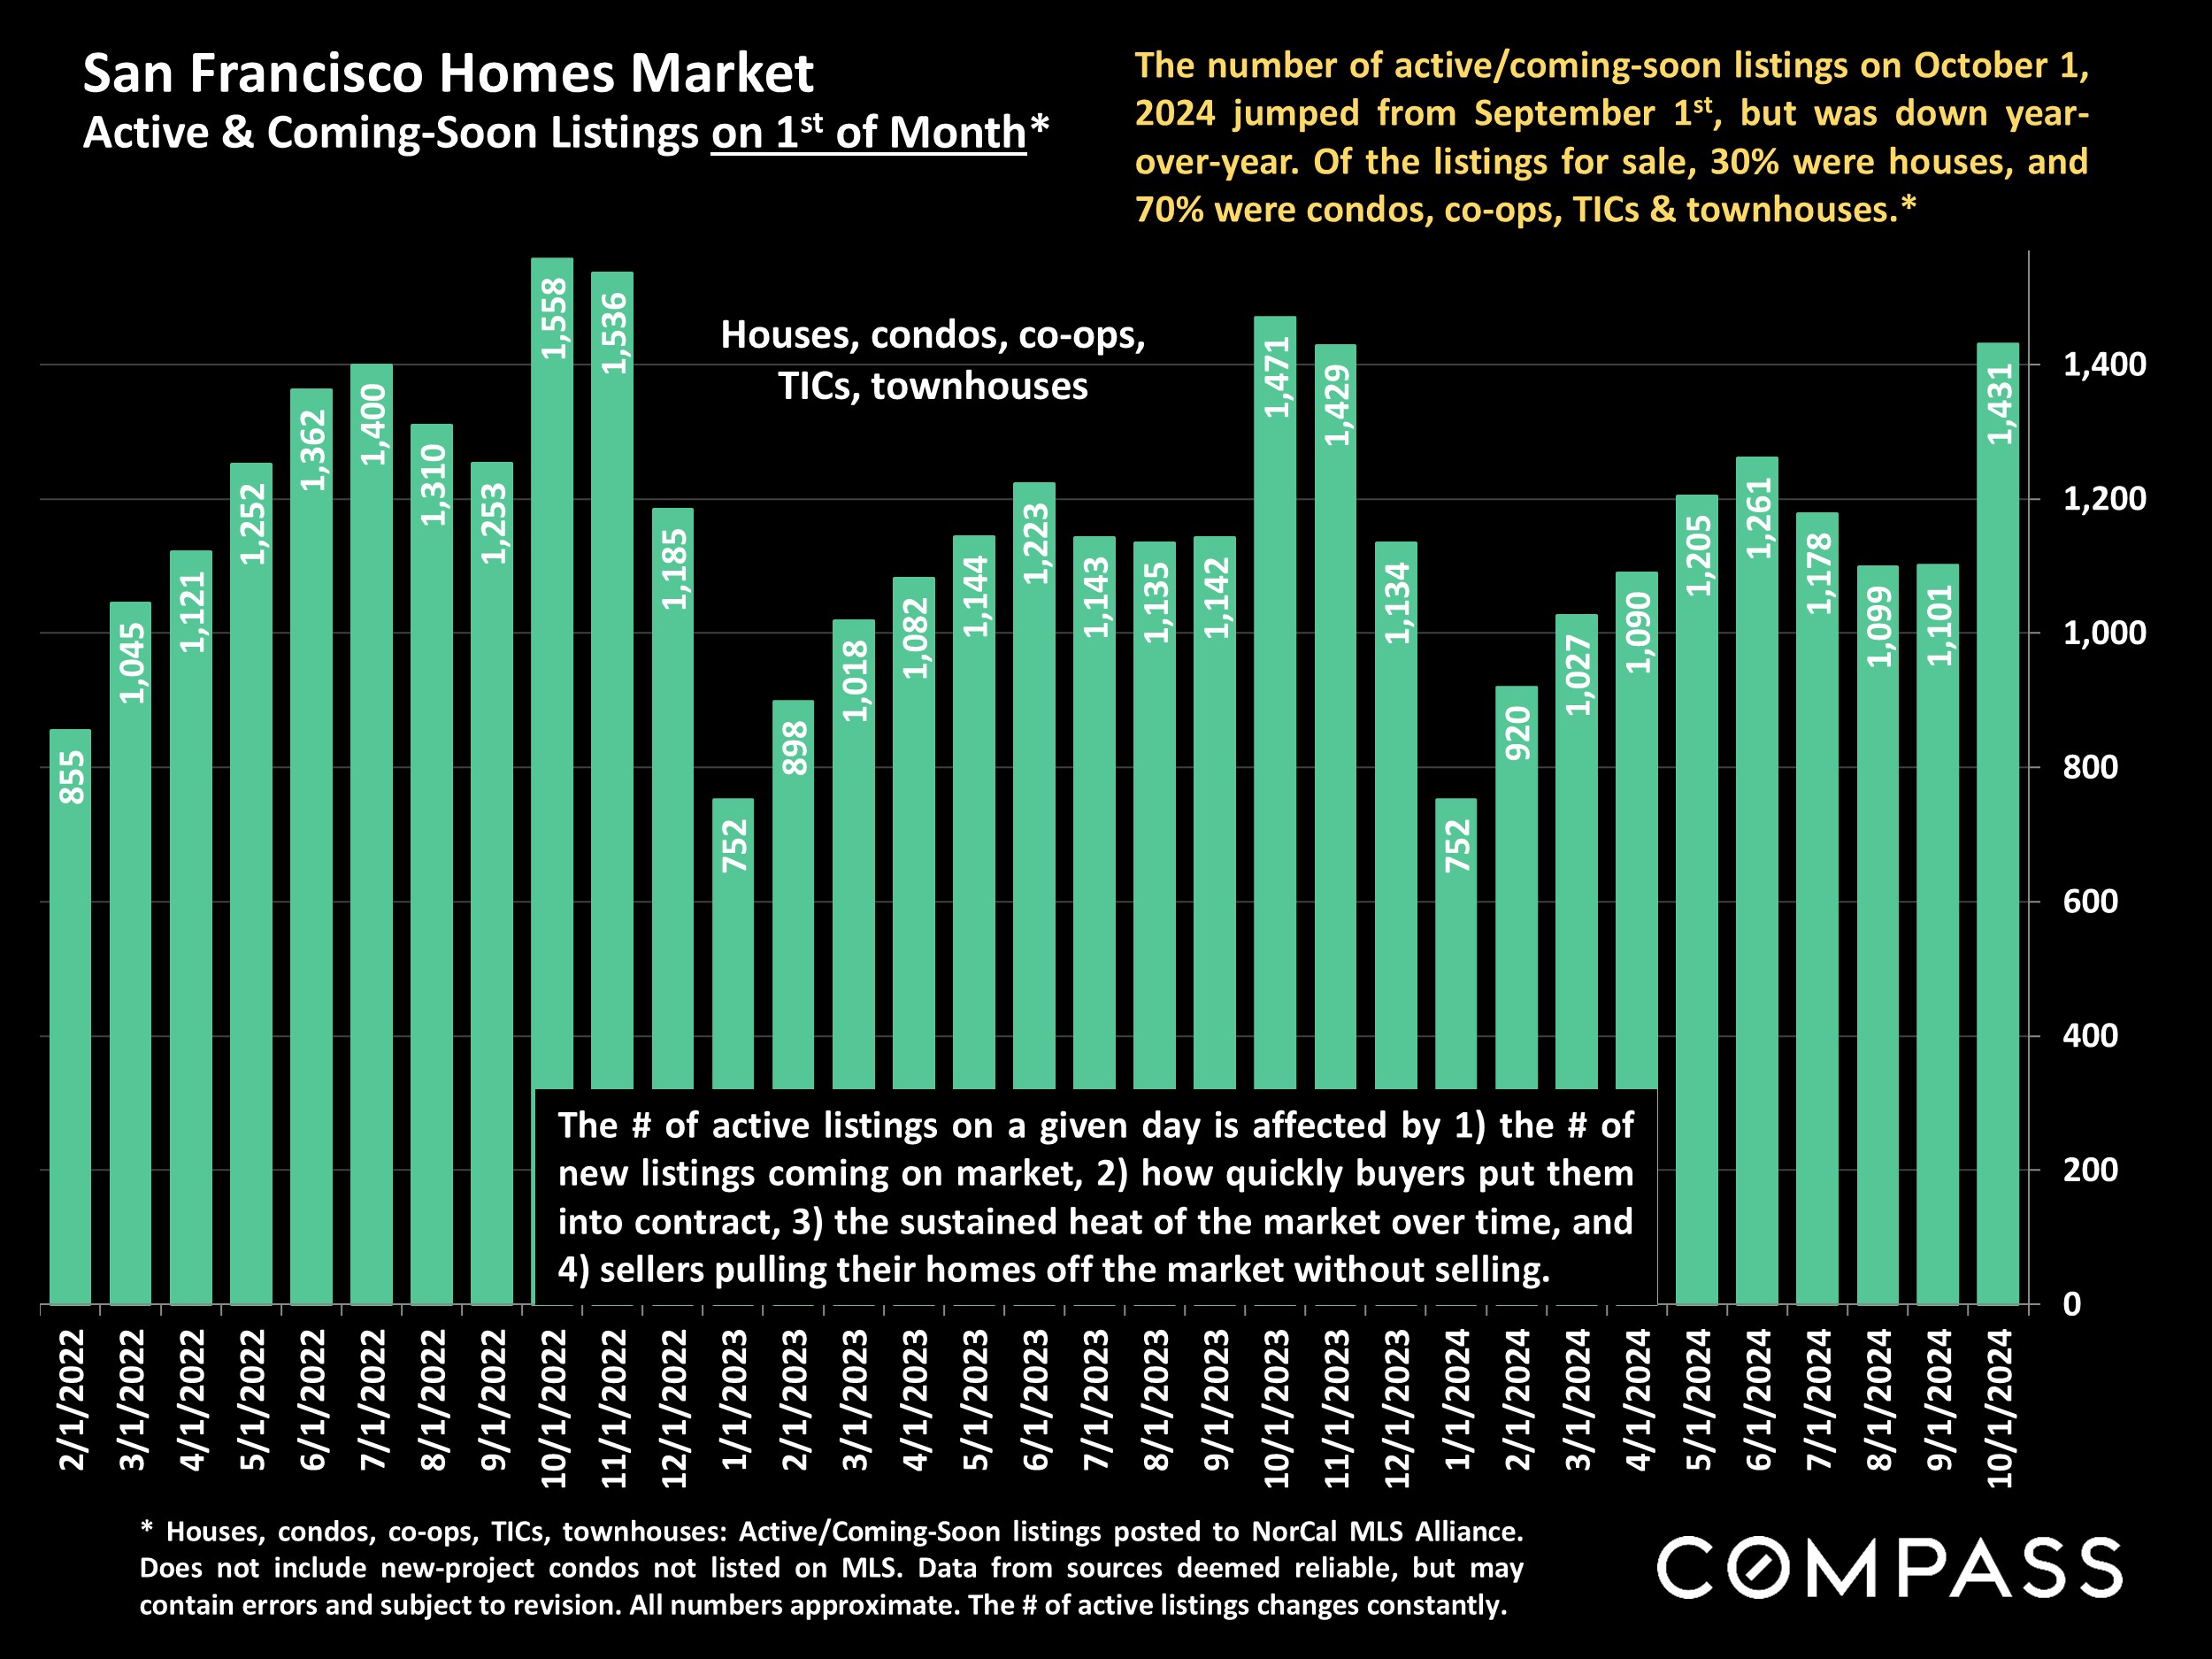
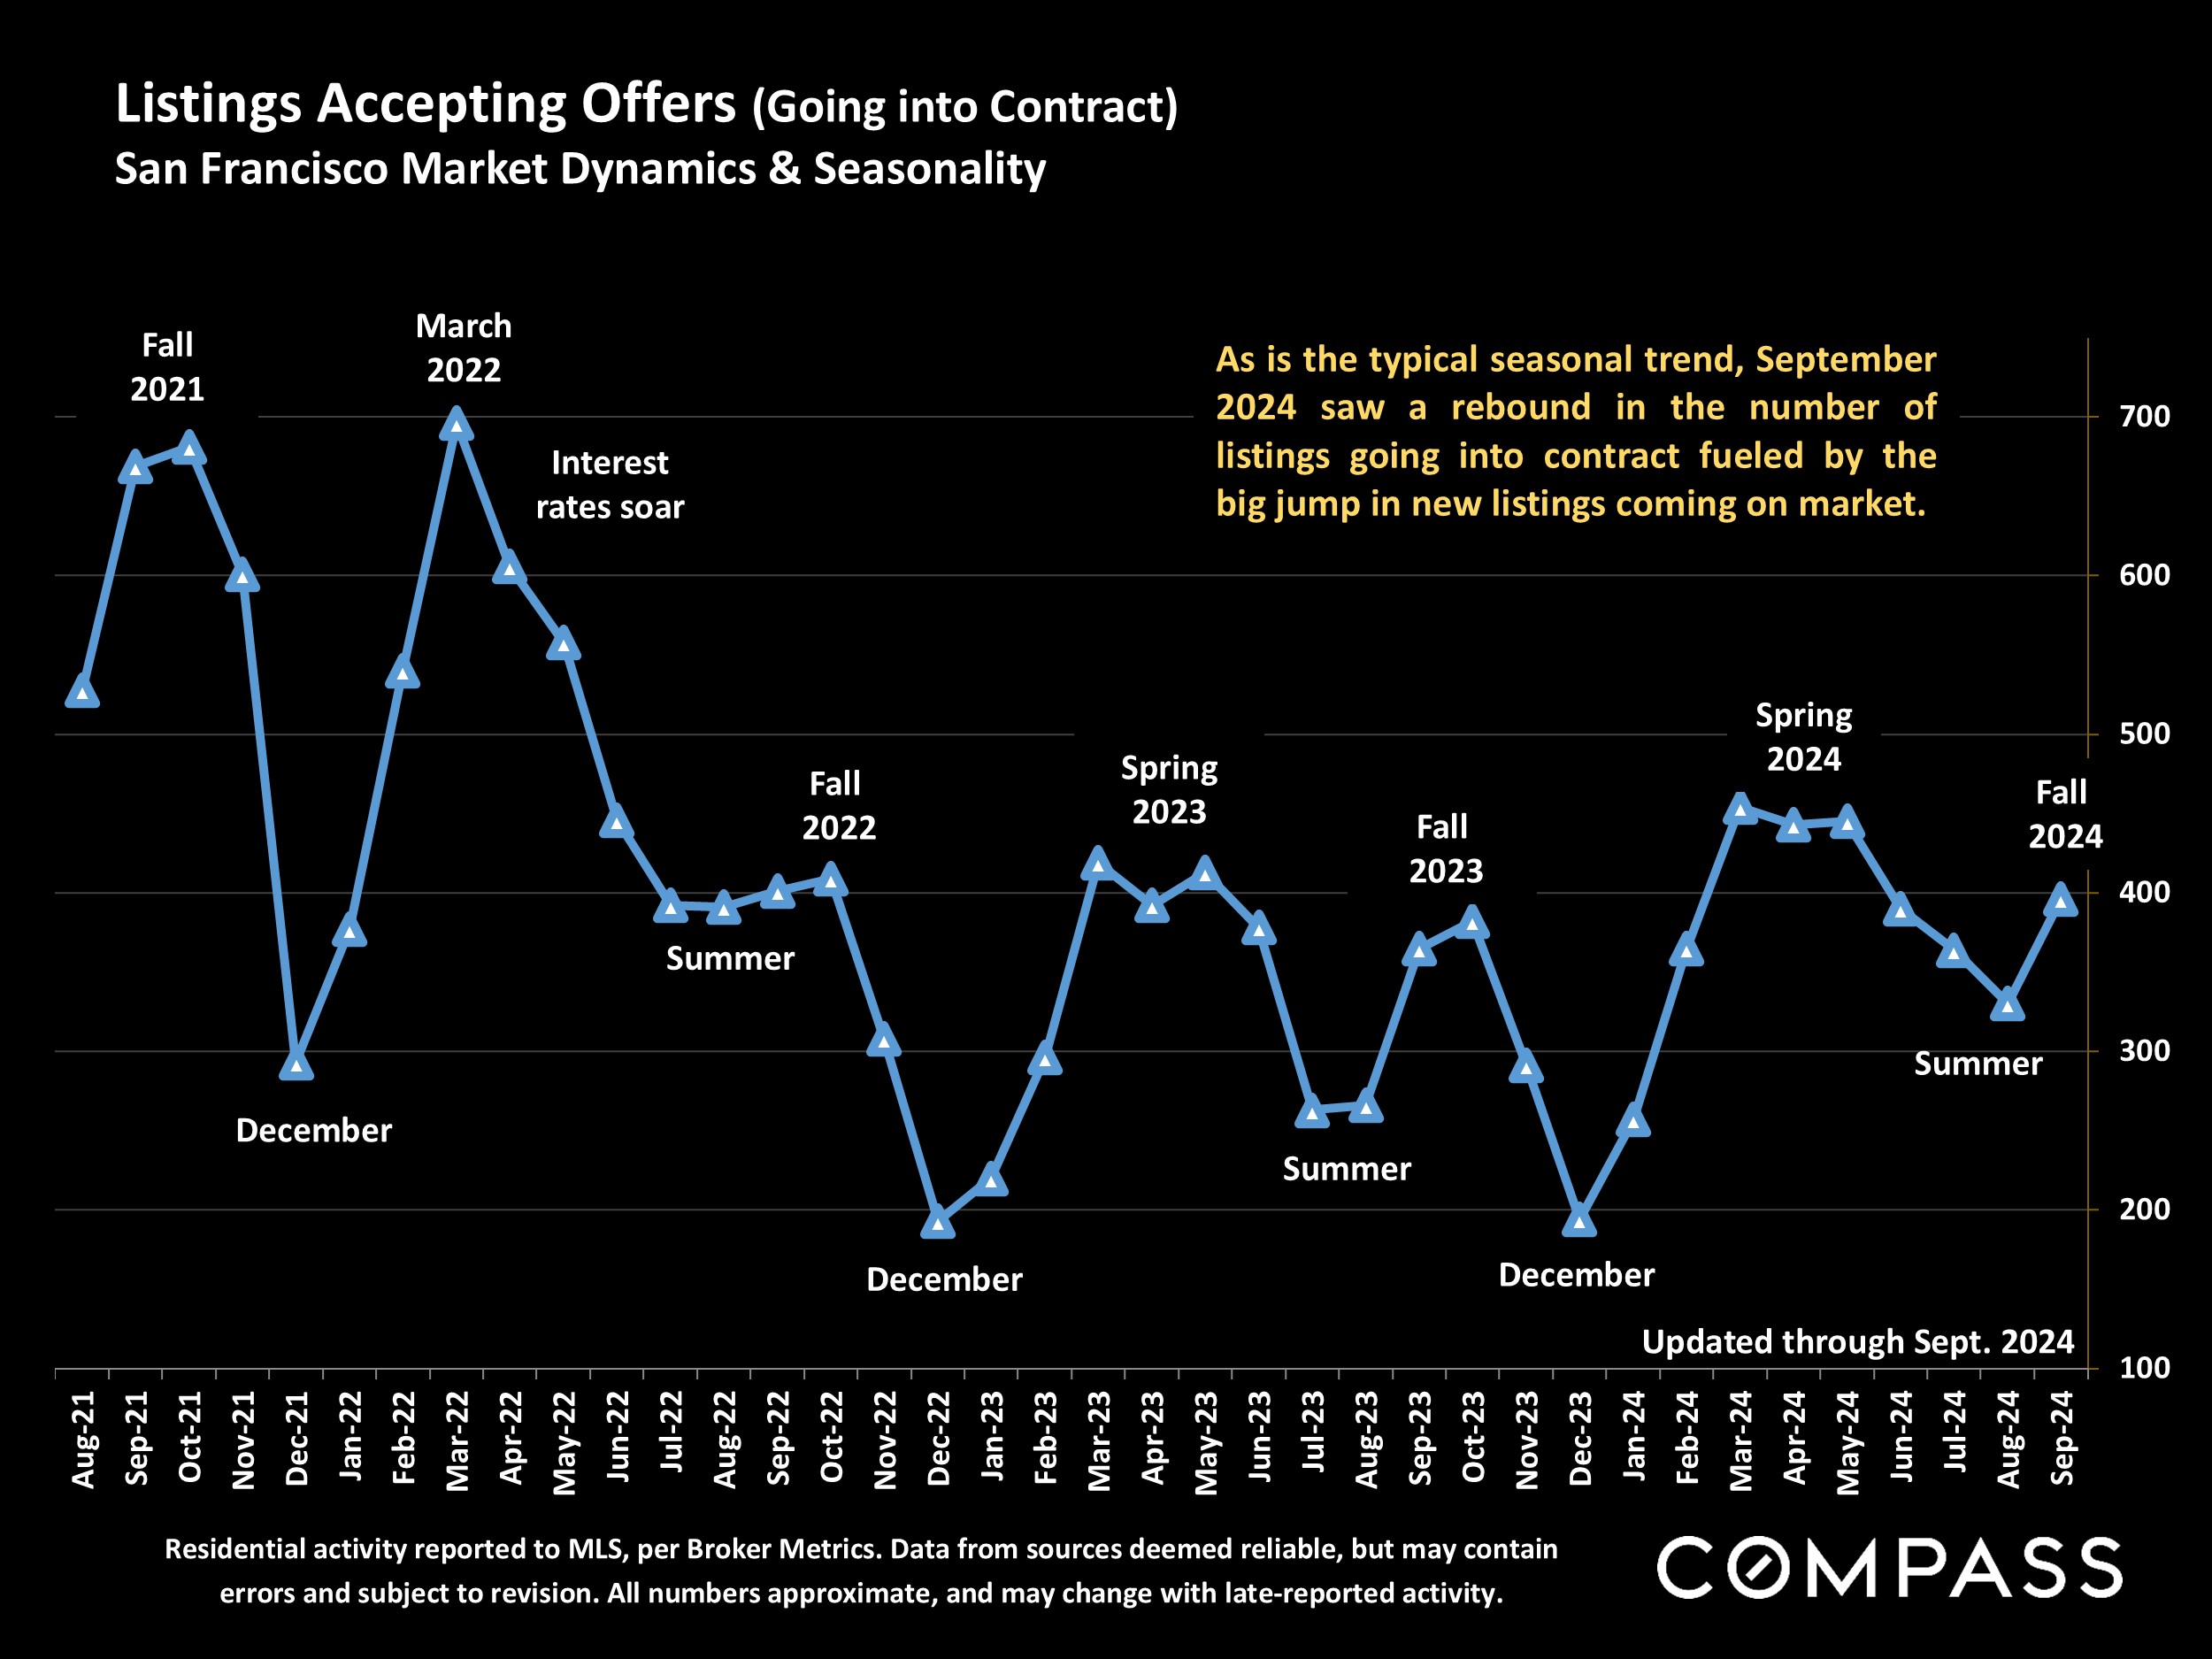
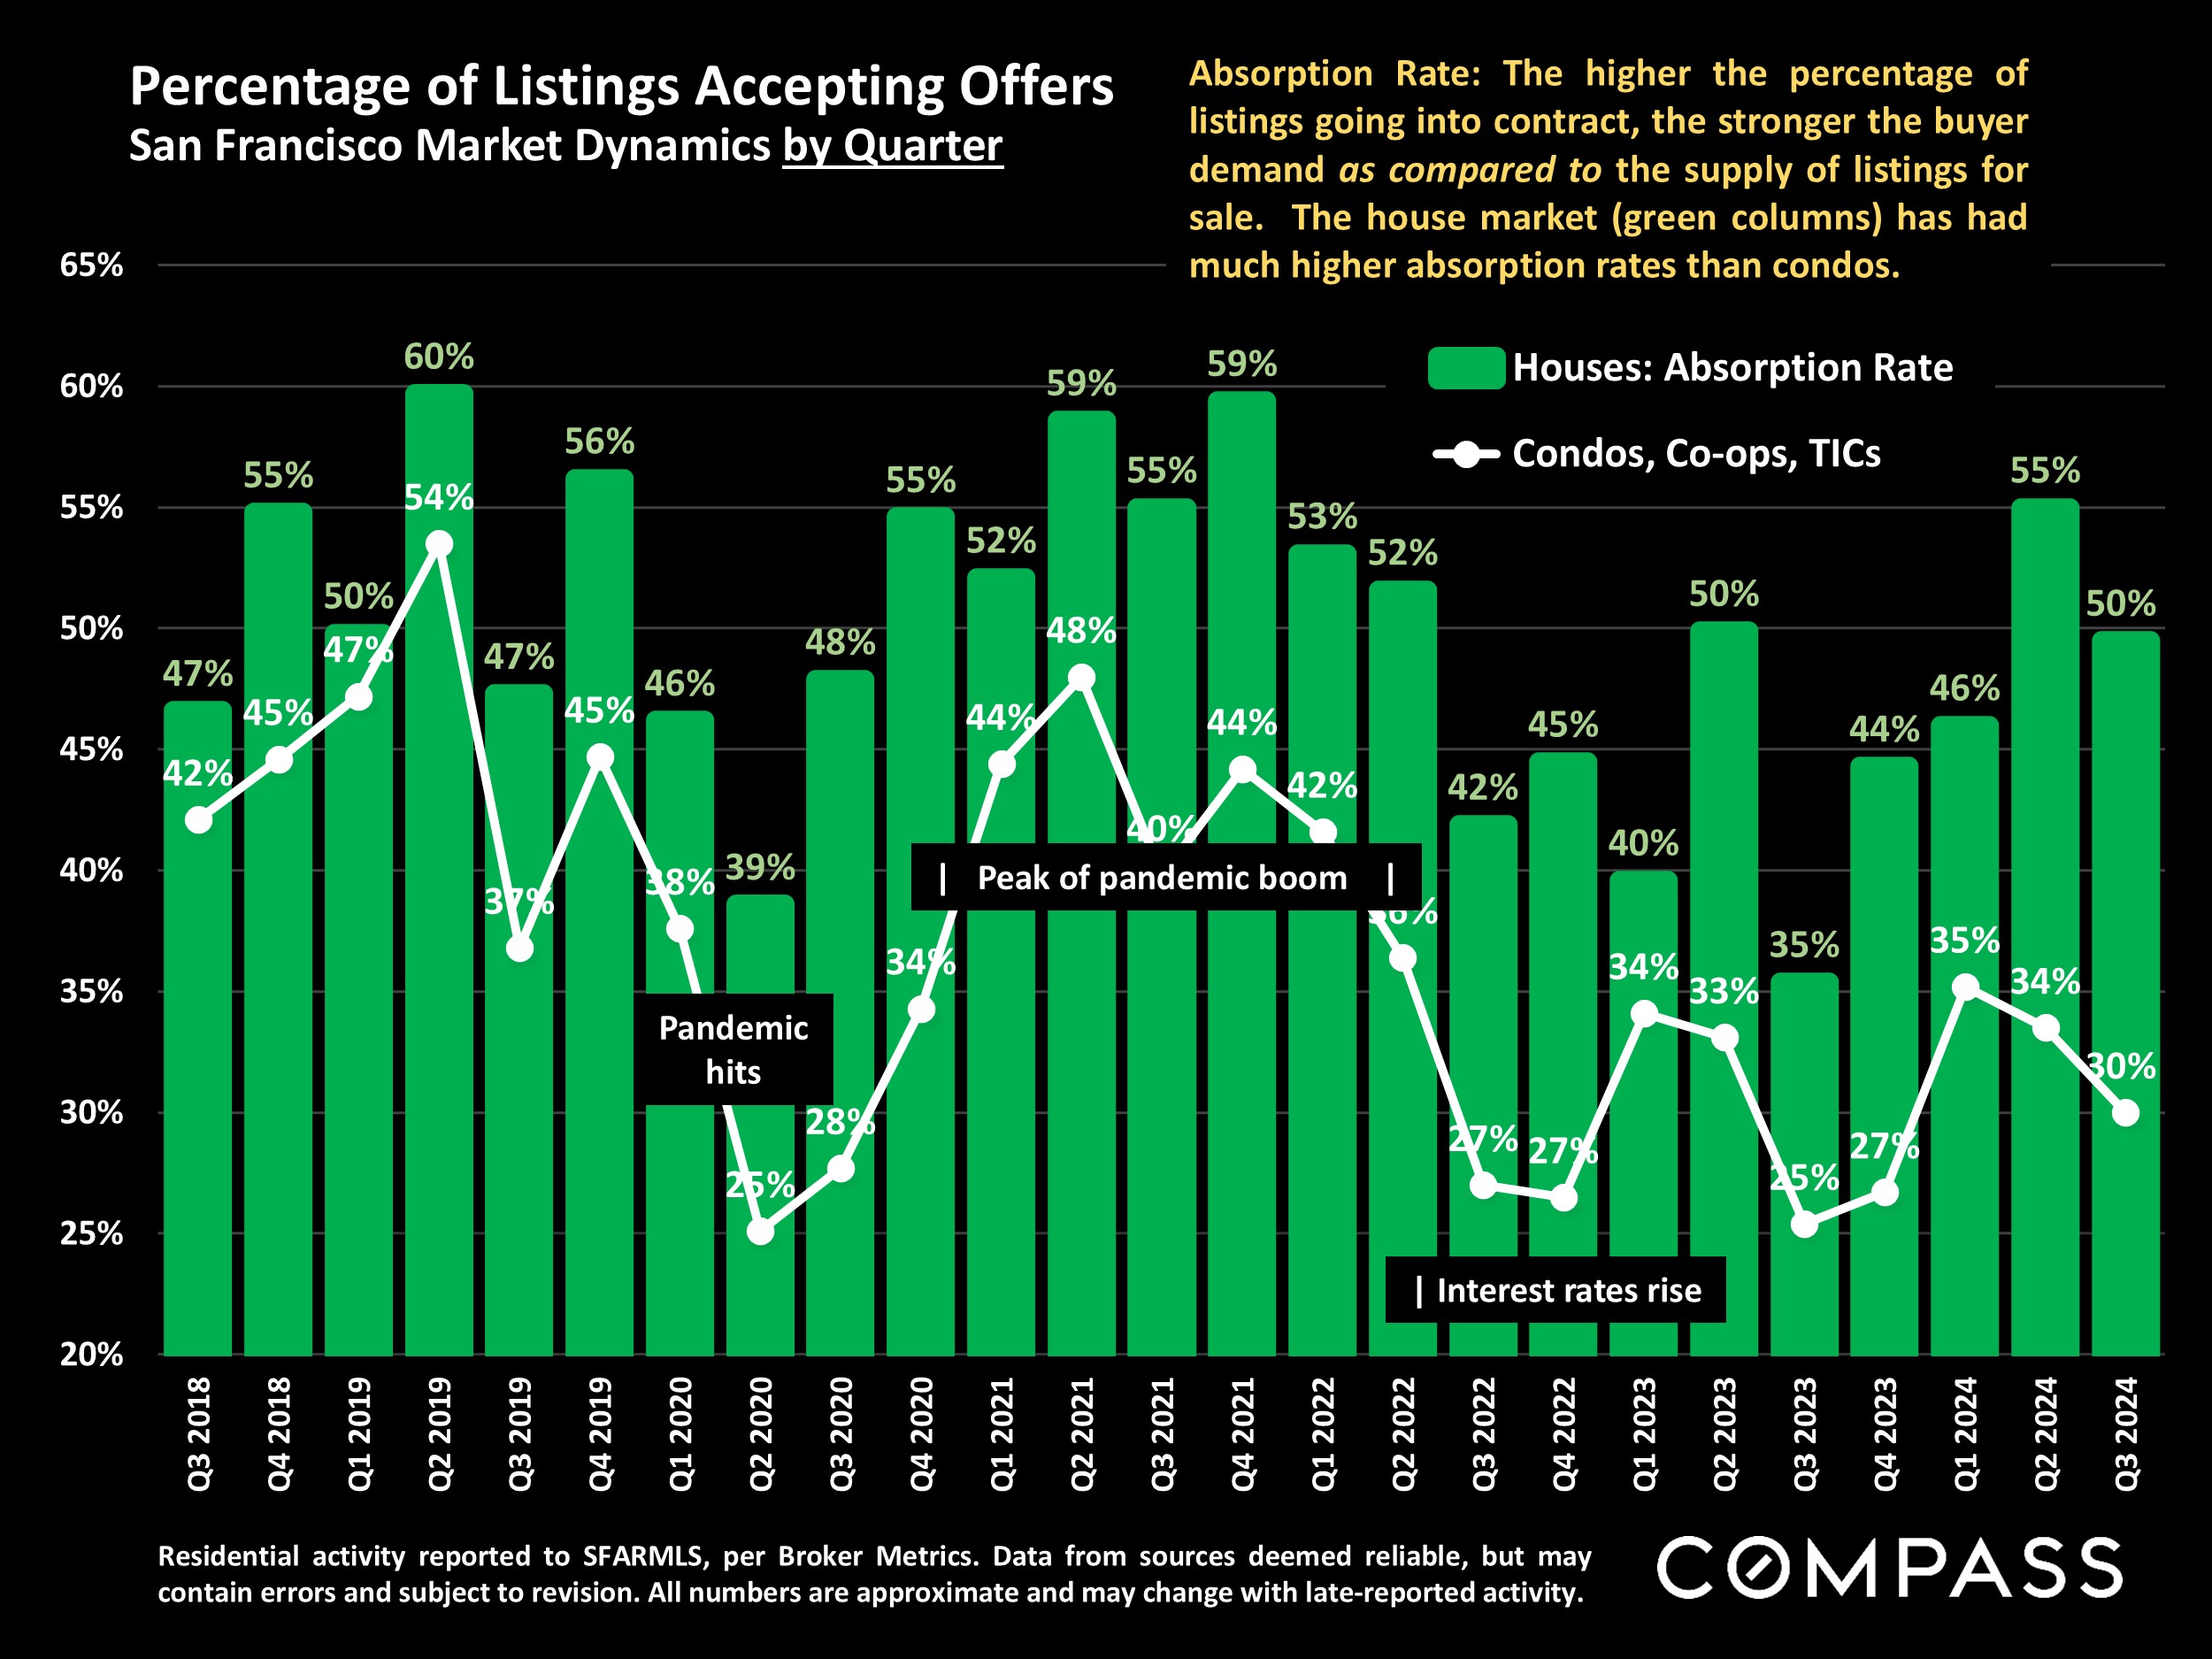
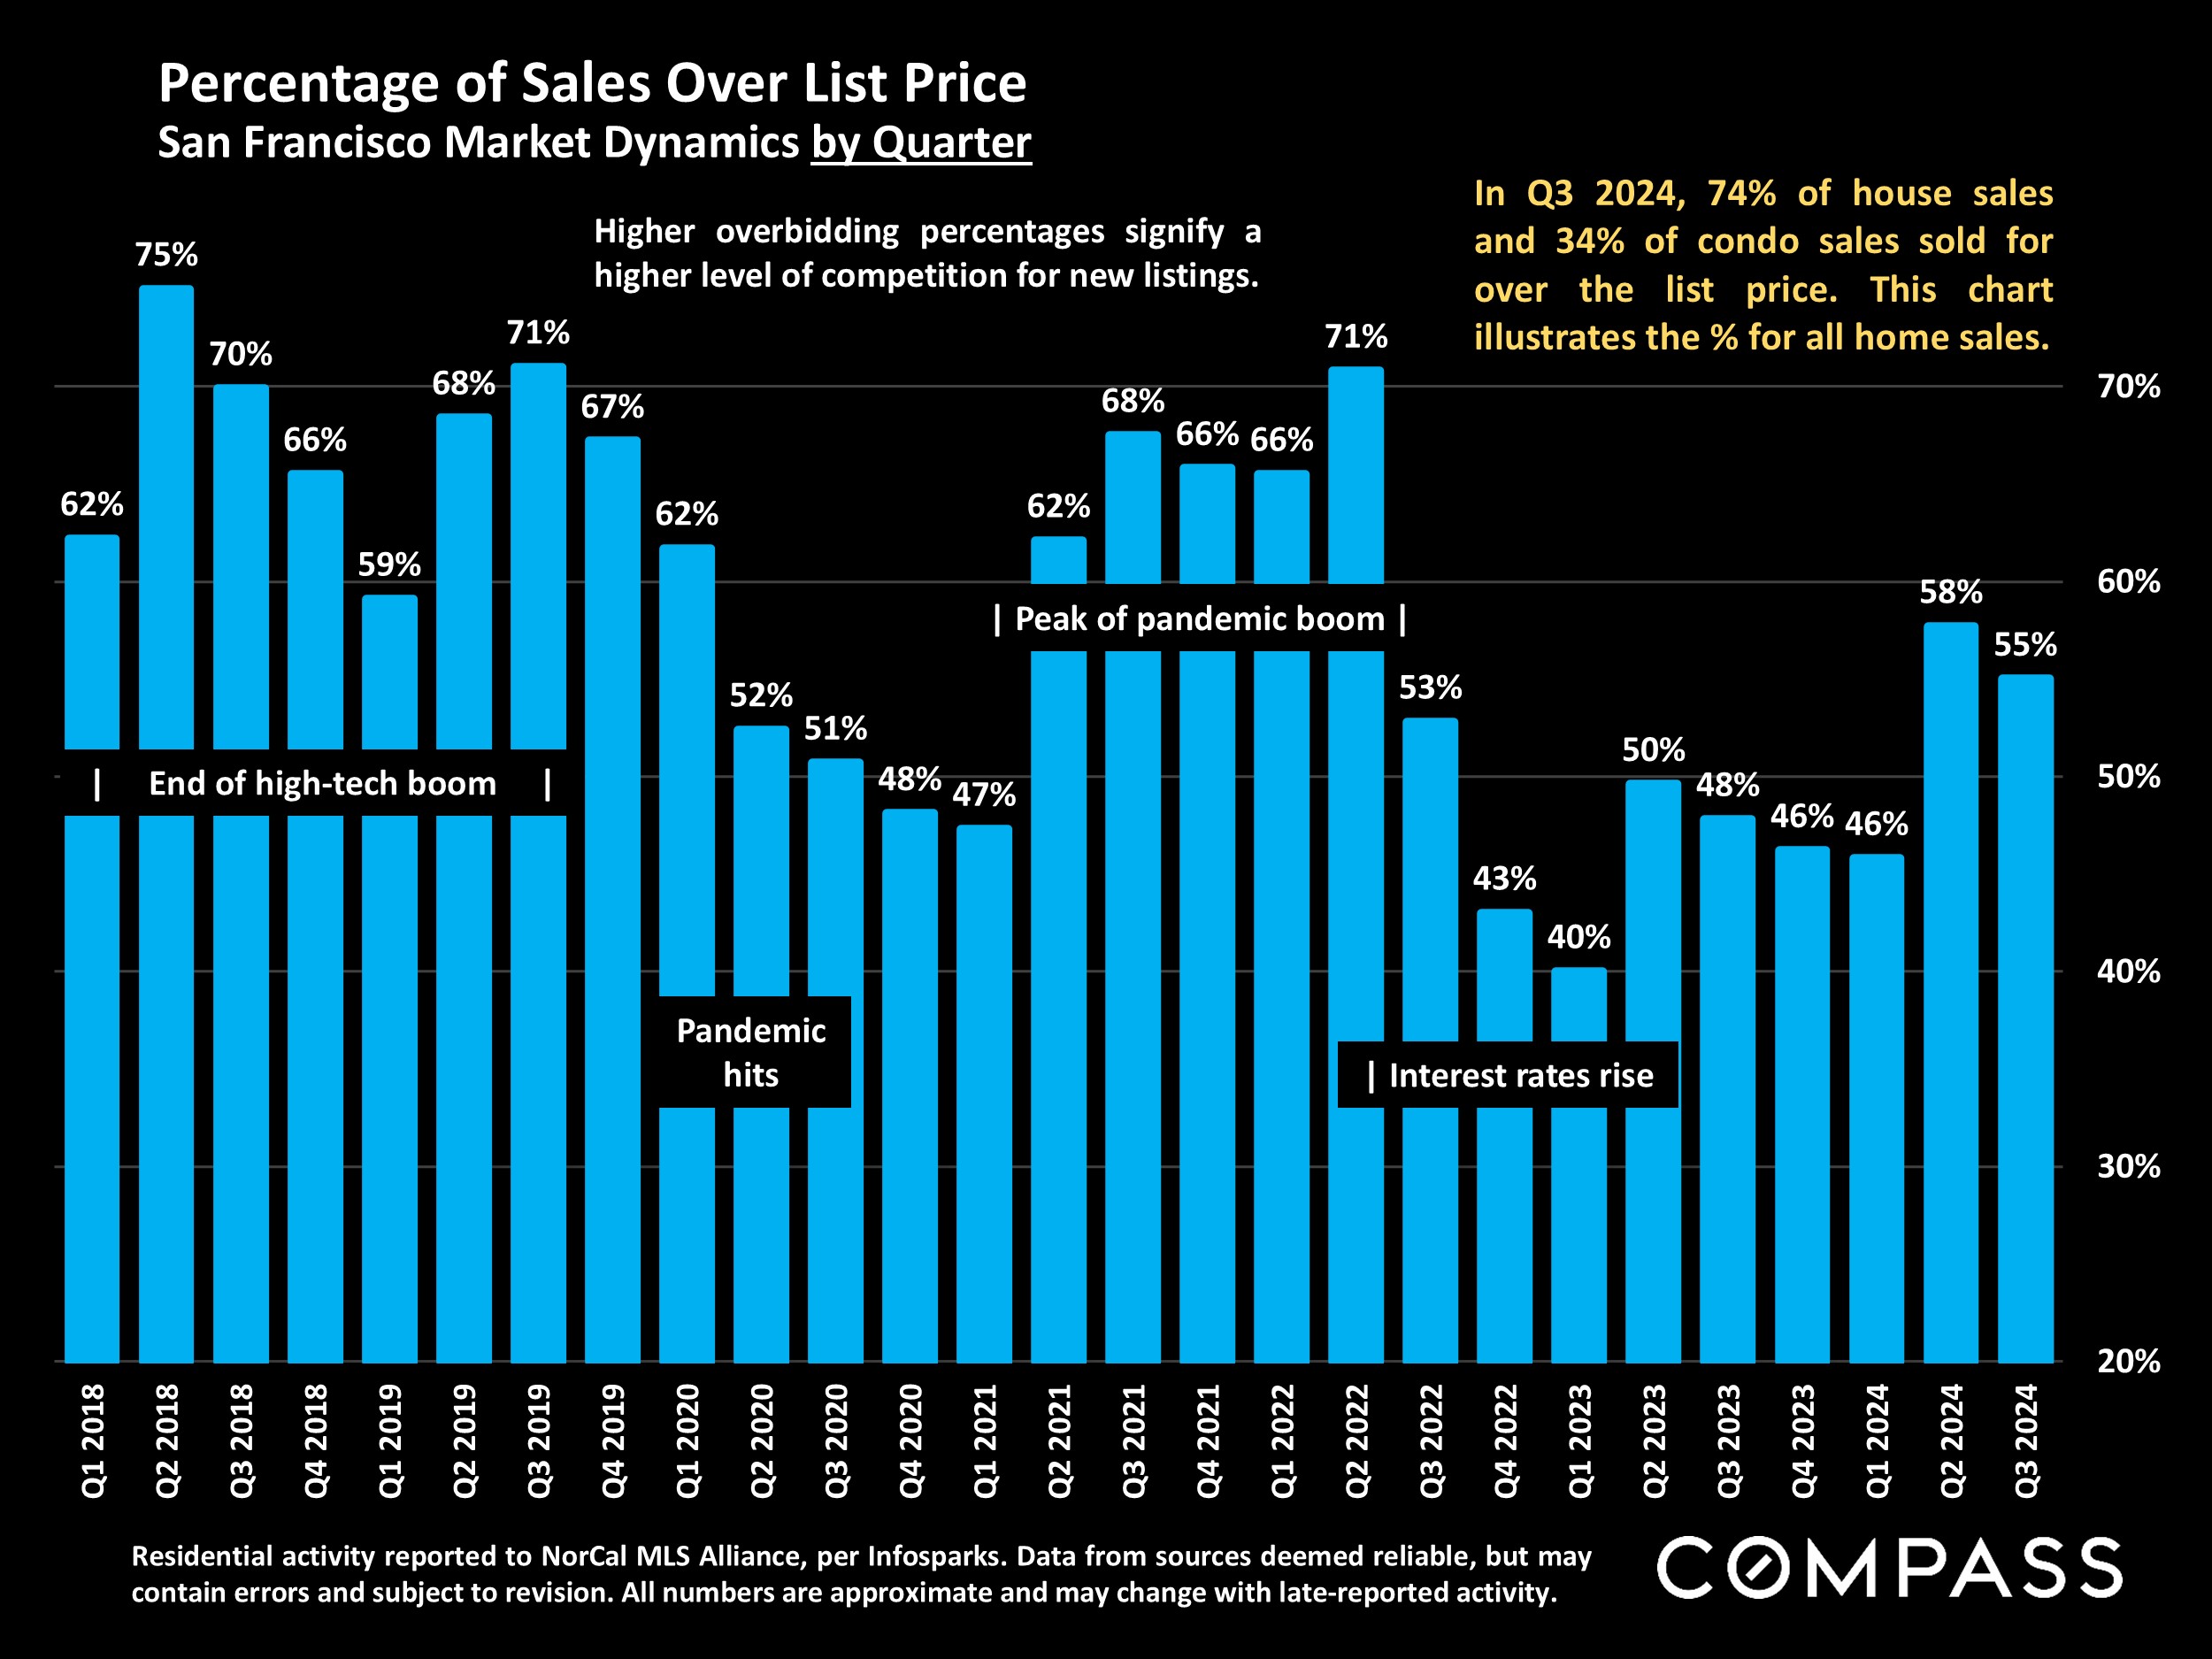
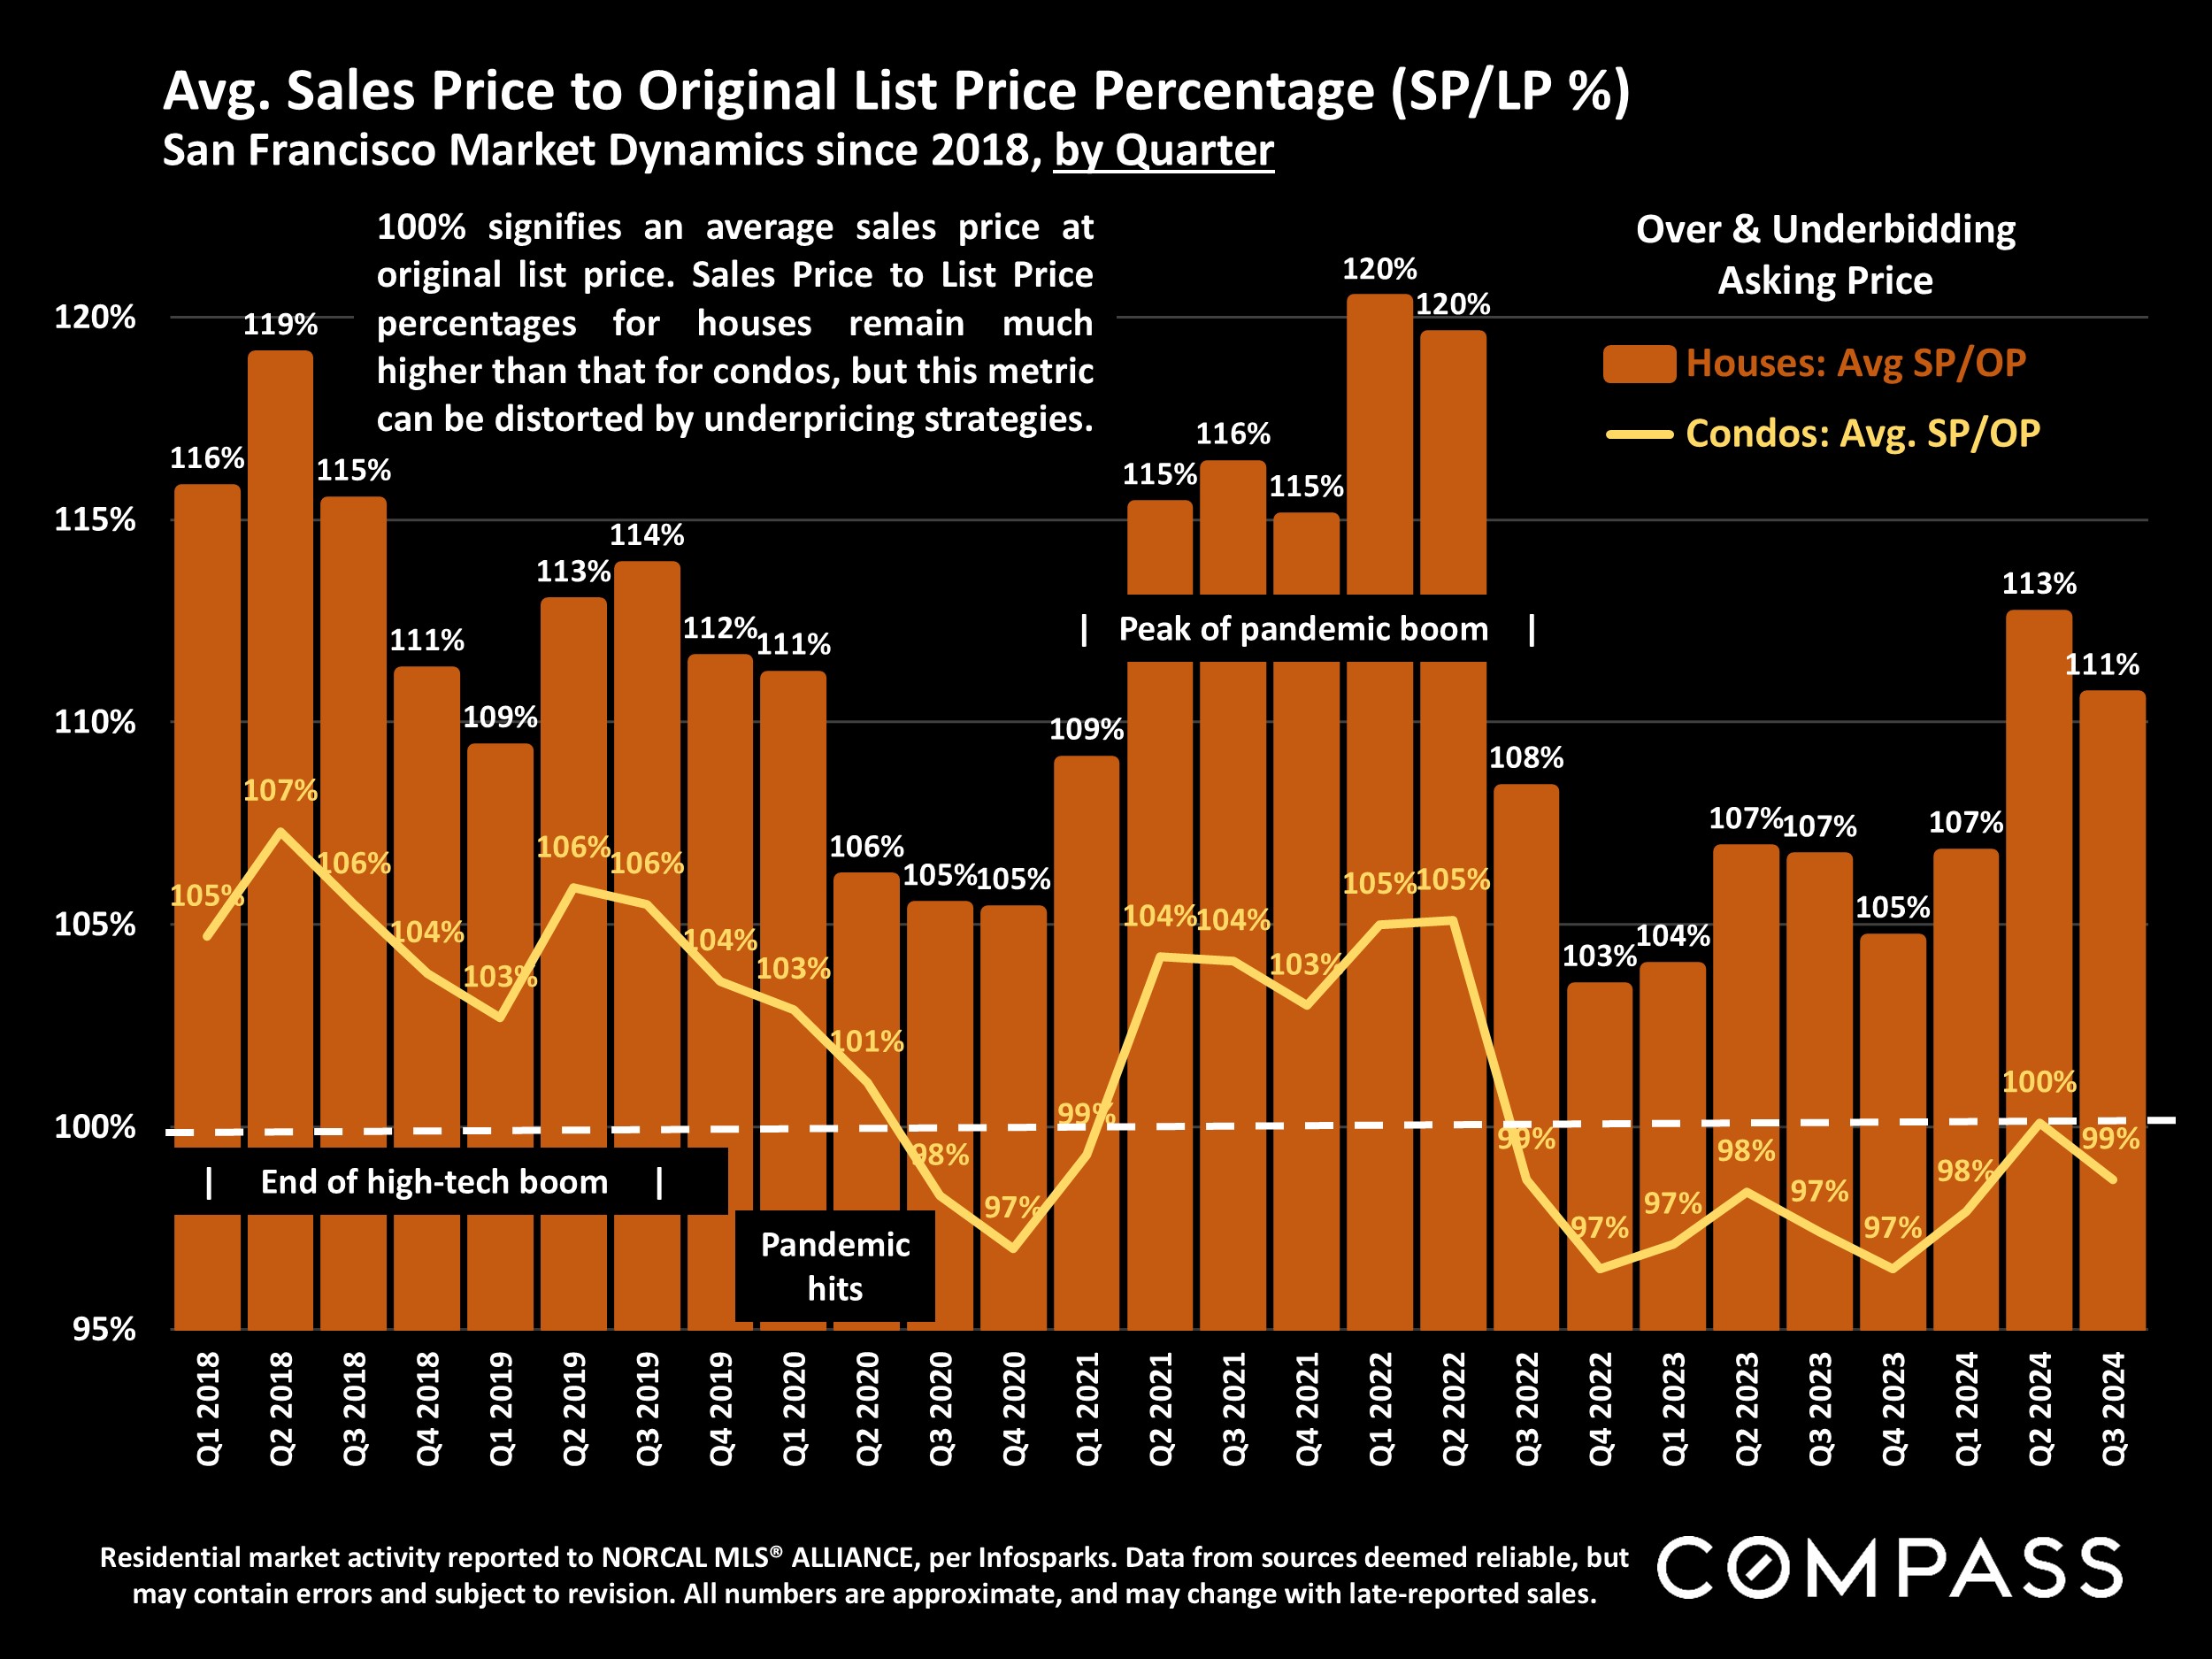
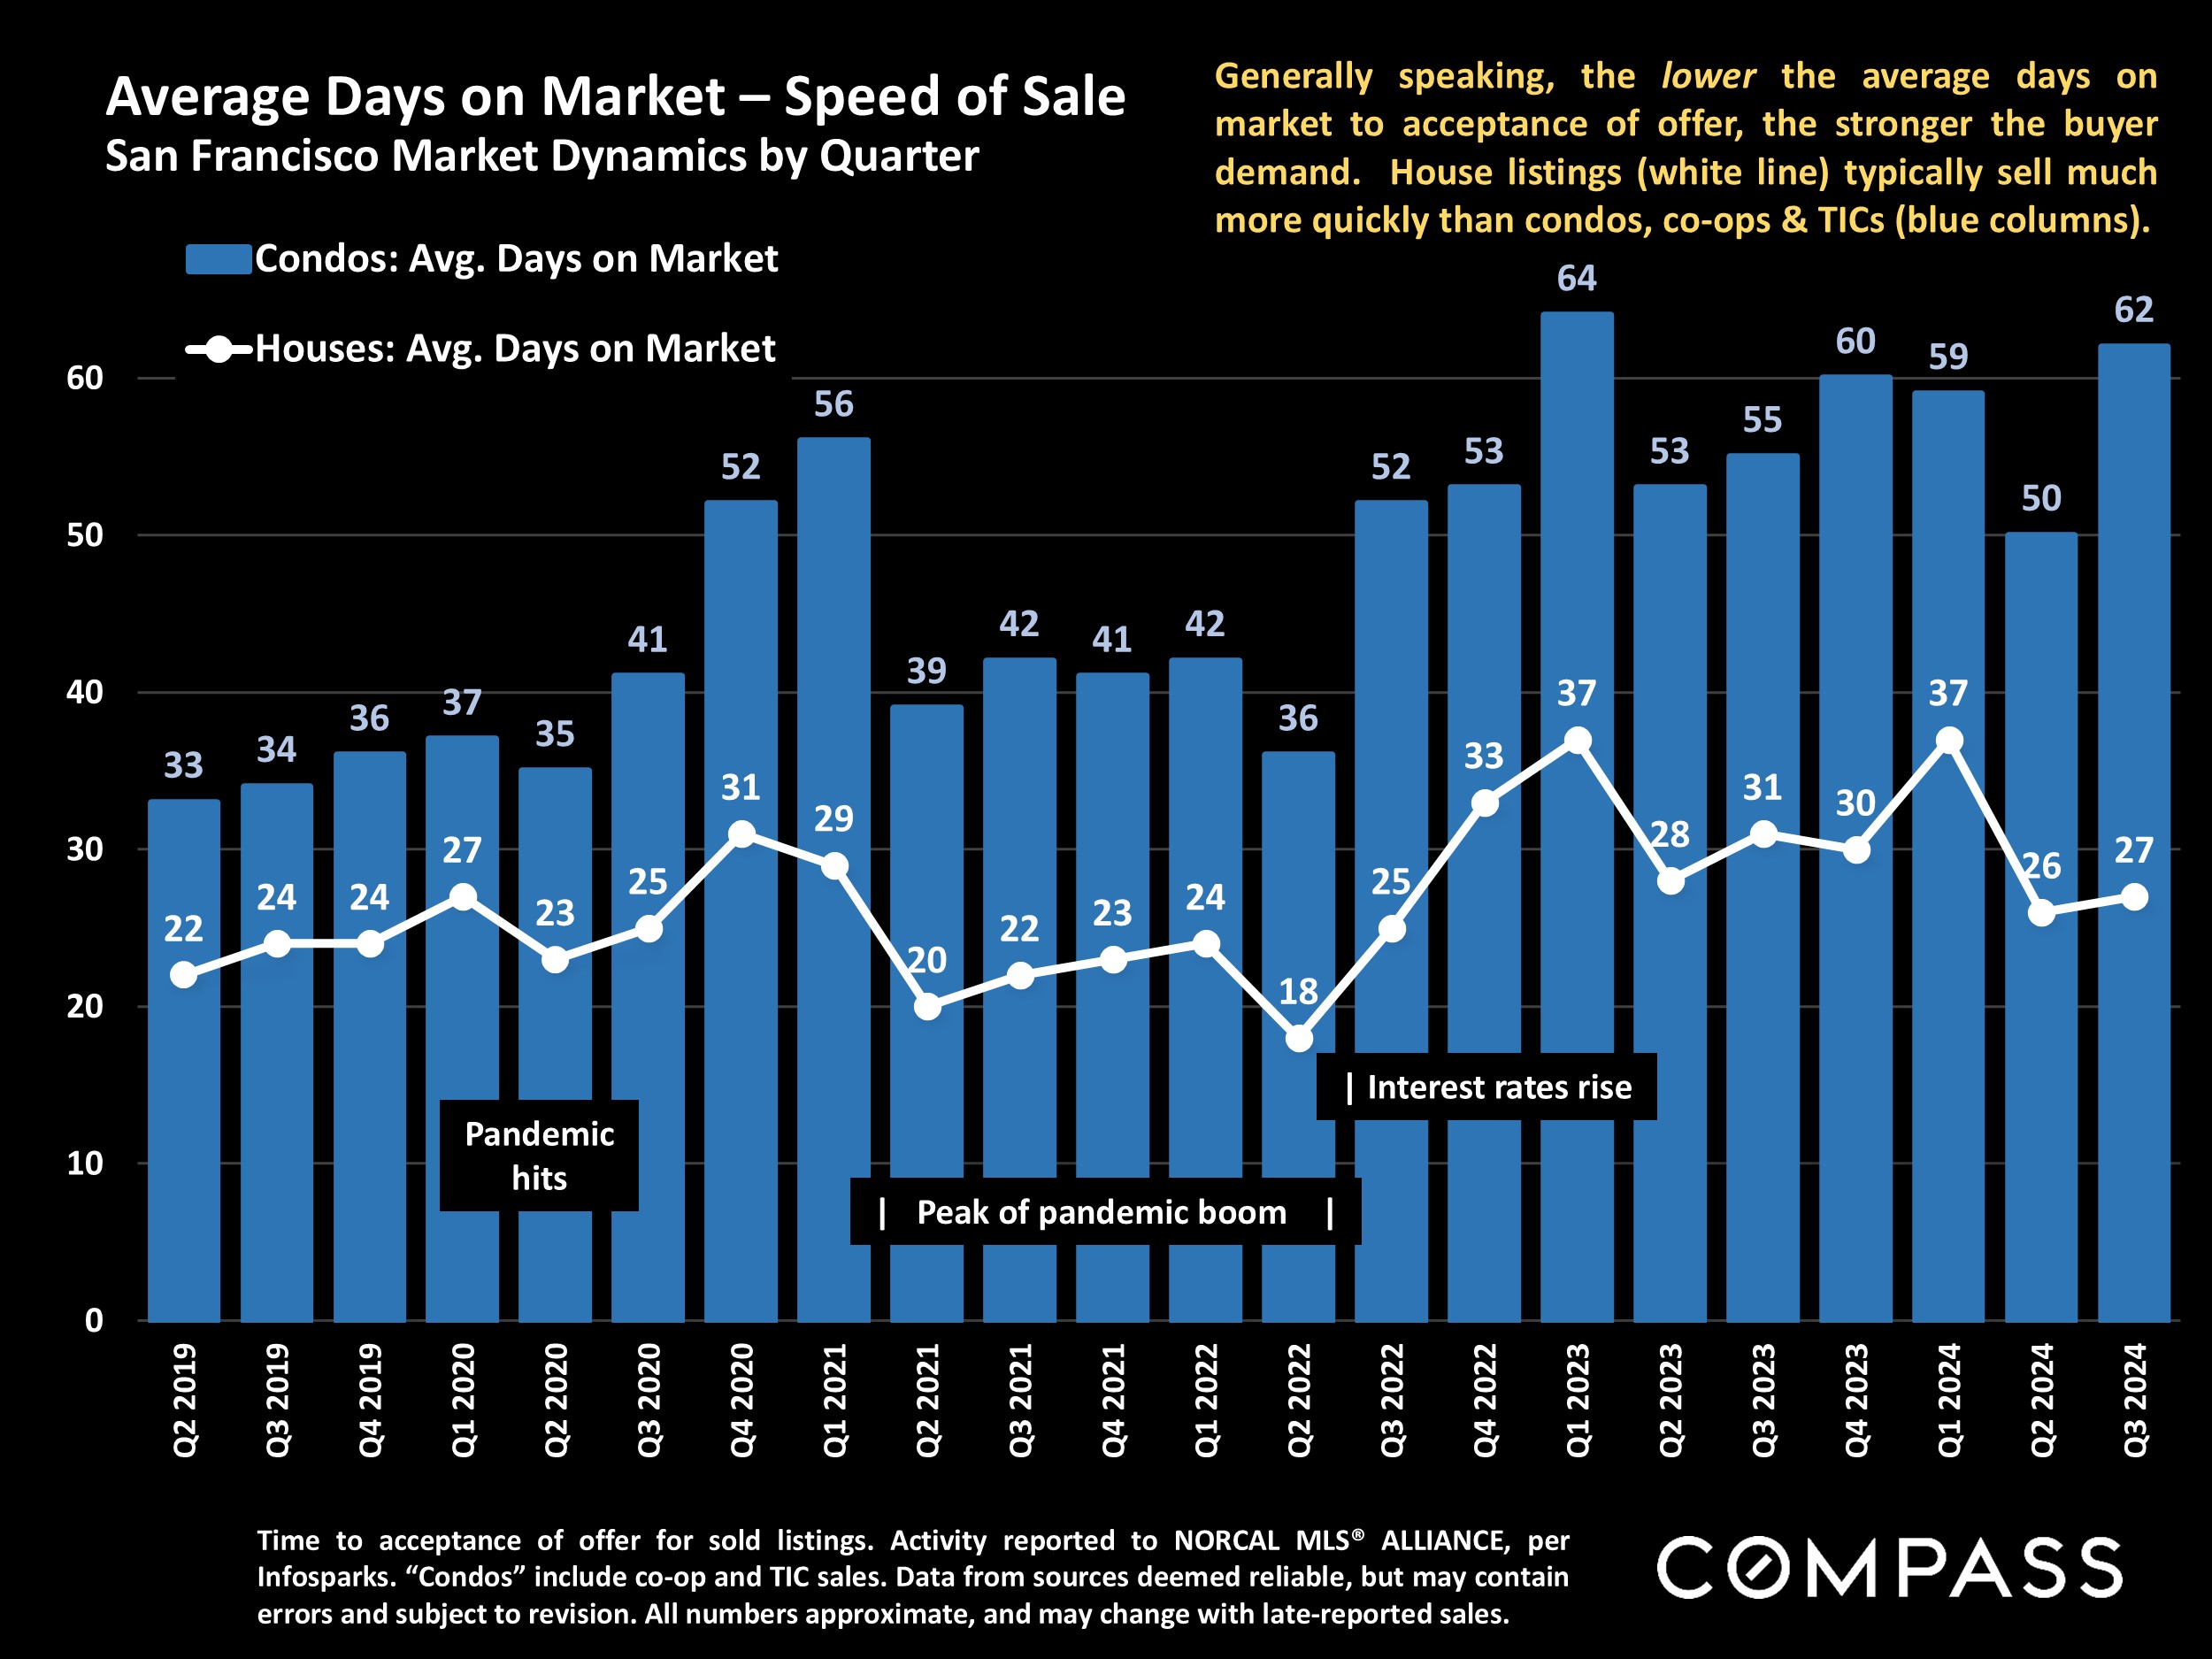
Though sales activity increased in September, the recent drop in interest rates did not precipitate as substantial a rebound in buyer demand as many had expected. It may be that expectations of further declines are keeping some buyers on the sidelines as they wait for that to occur. September did see a very substantial jump in the number of new listings coming on the market - it was by far the highest monthly count of the year - so buyers currently have the widest choice of homes for sale since late 2023.
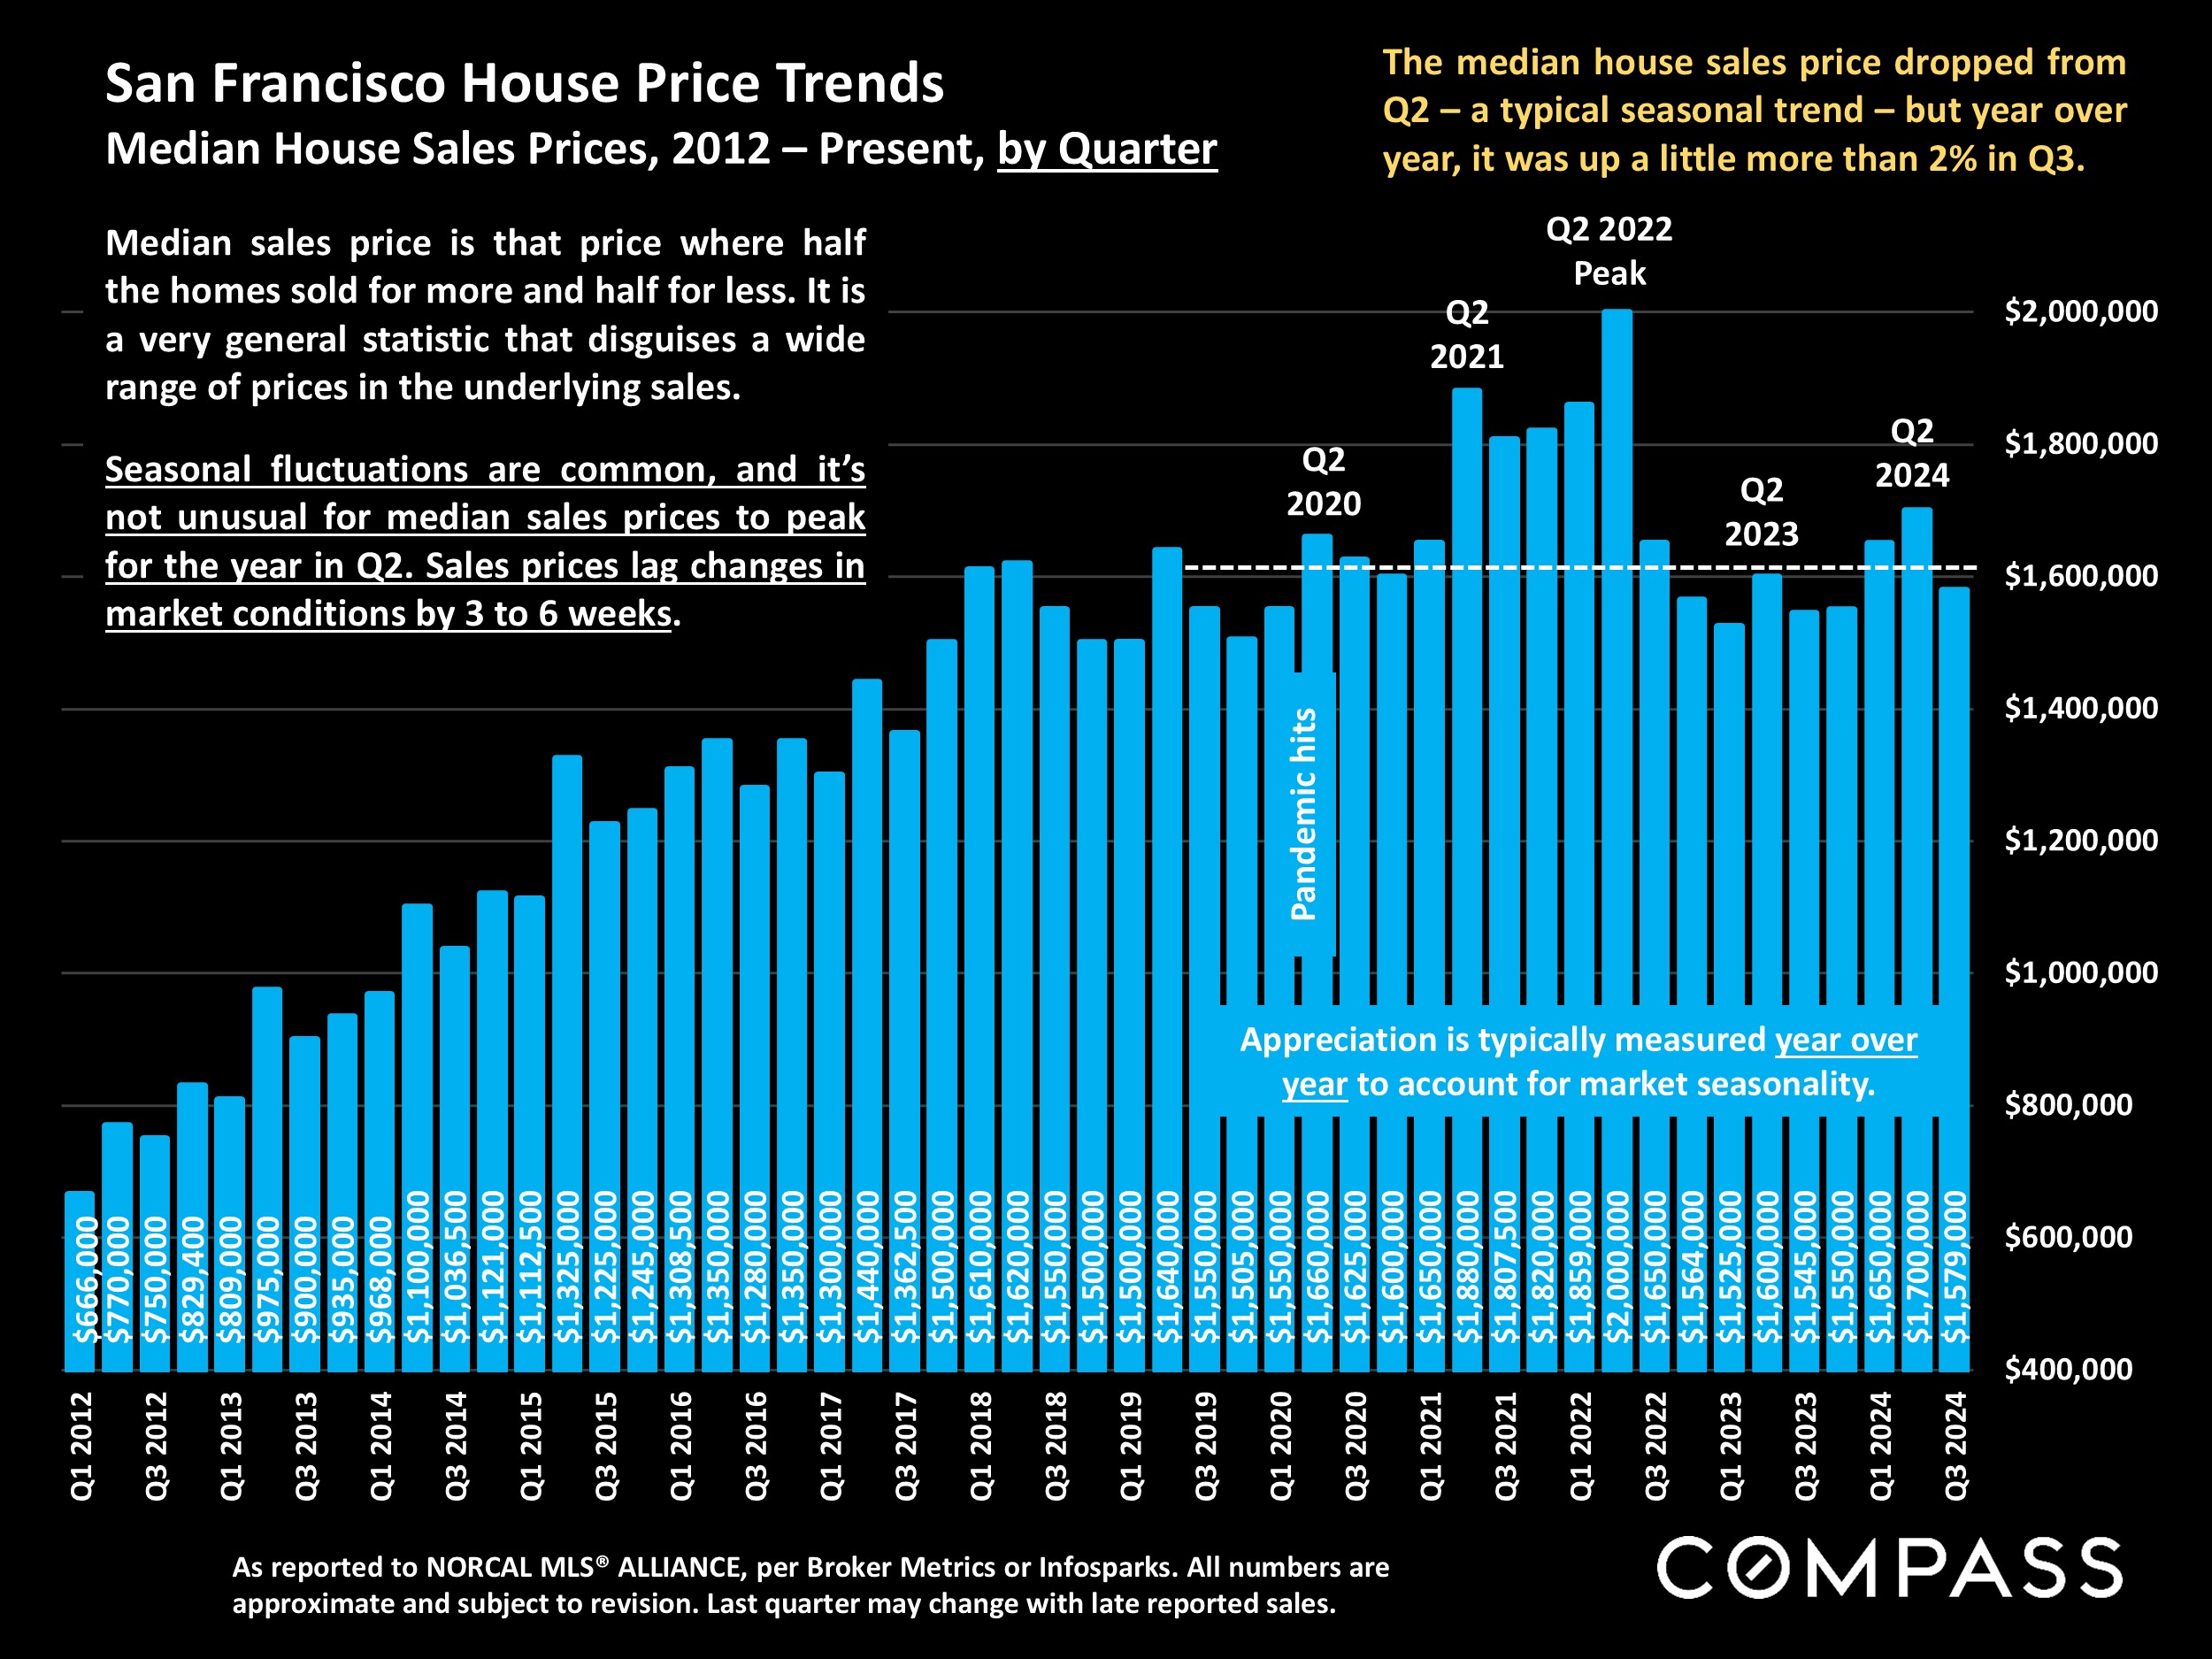
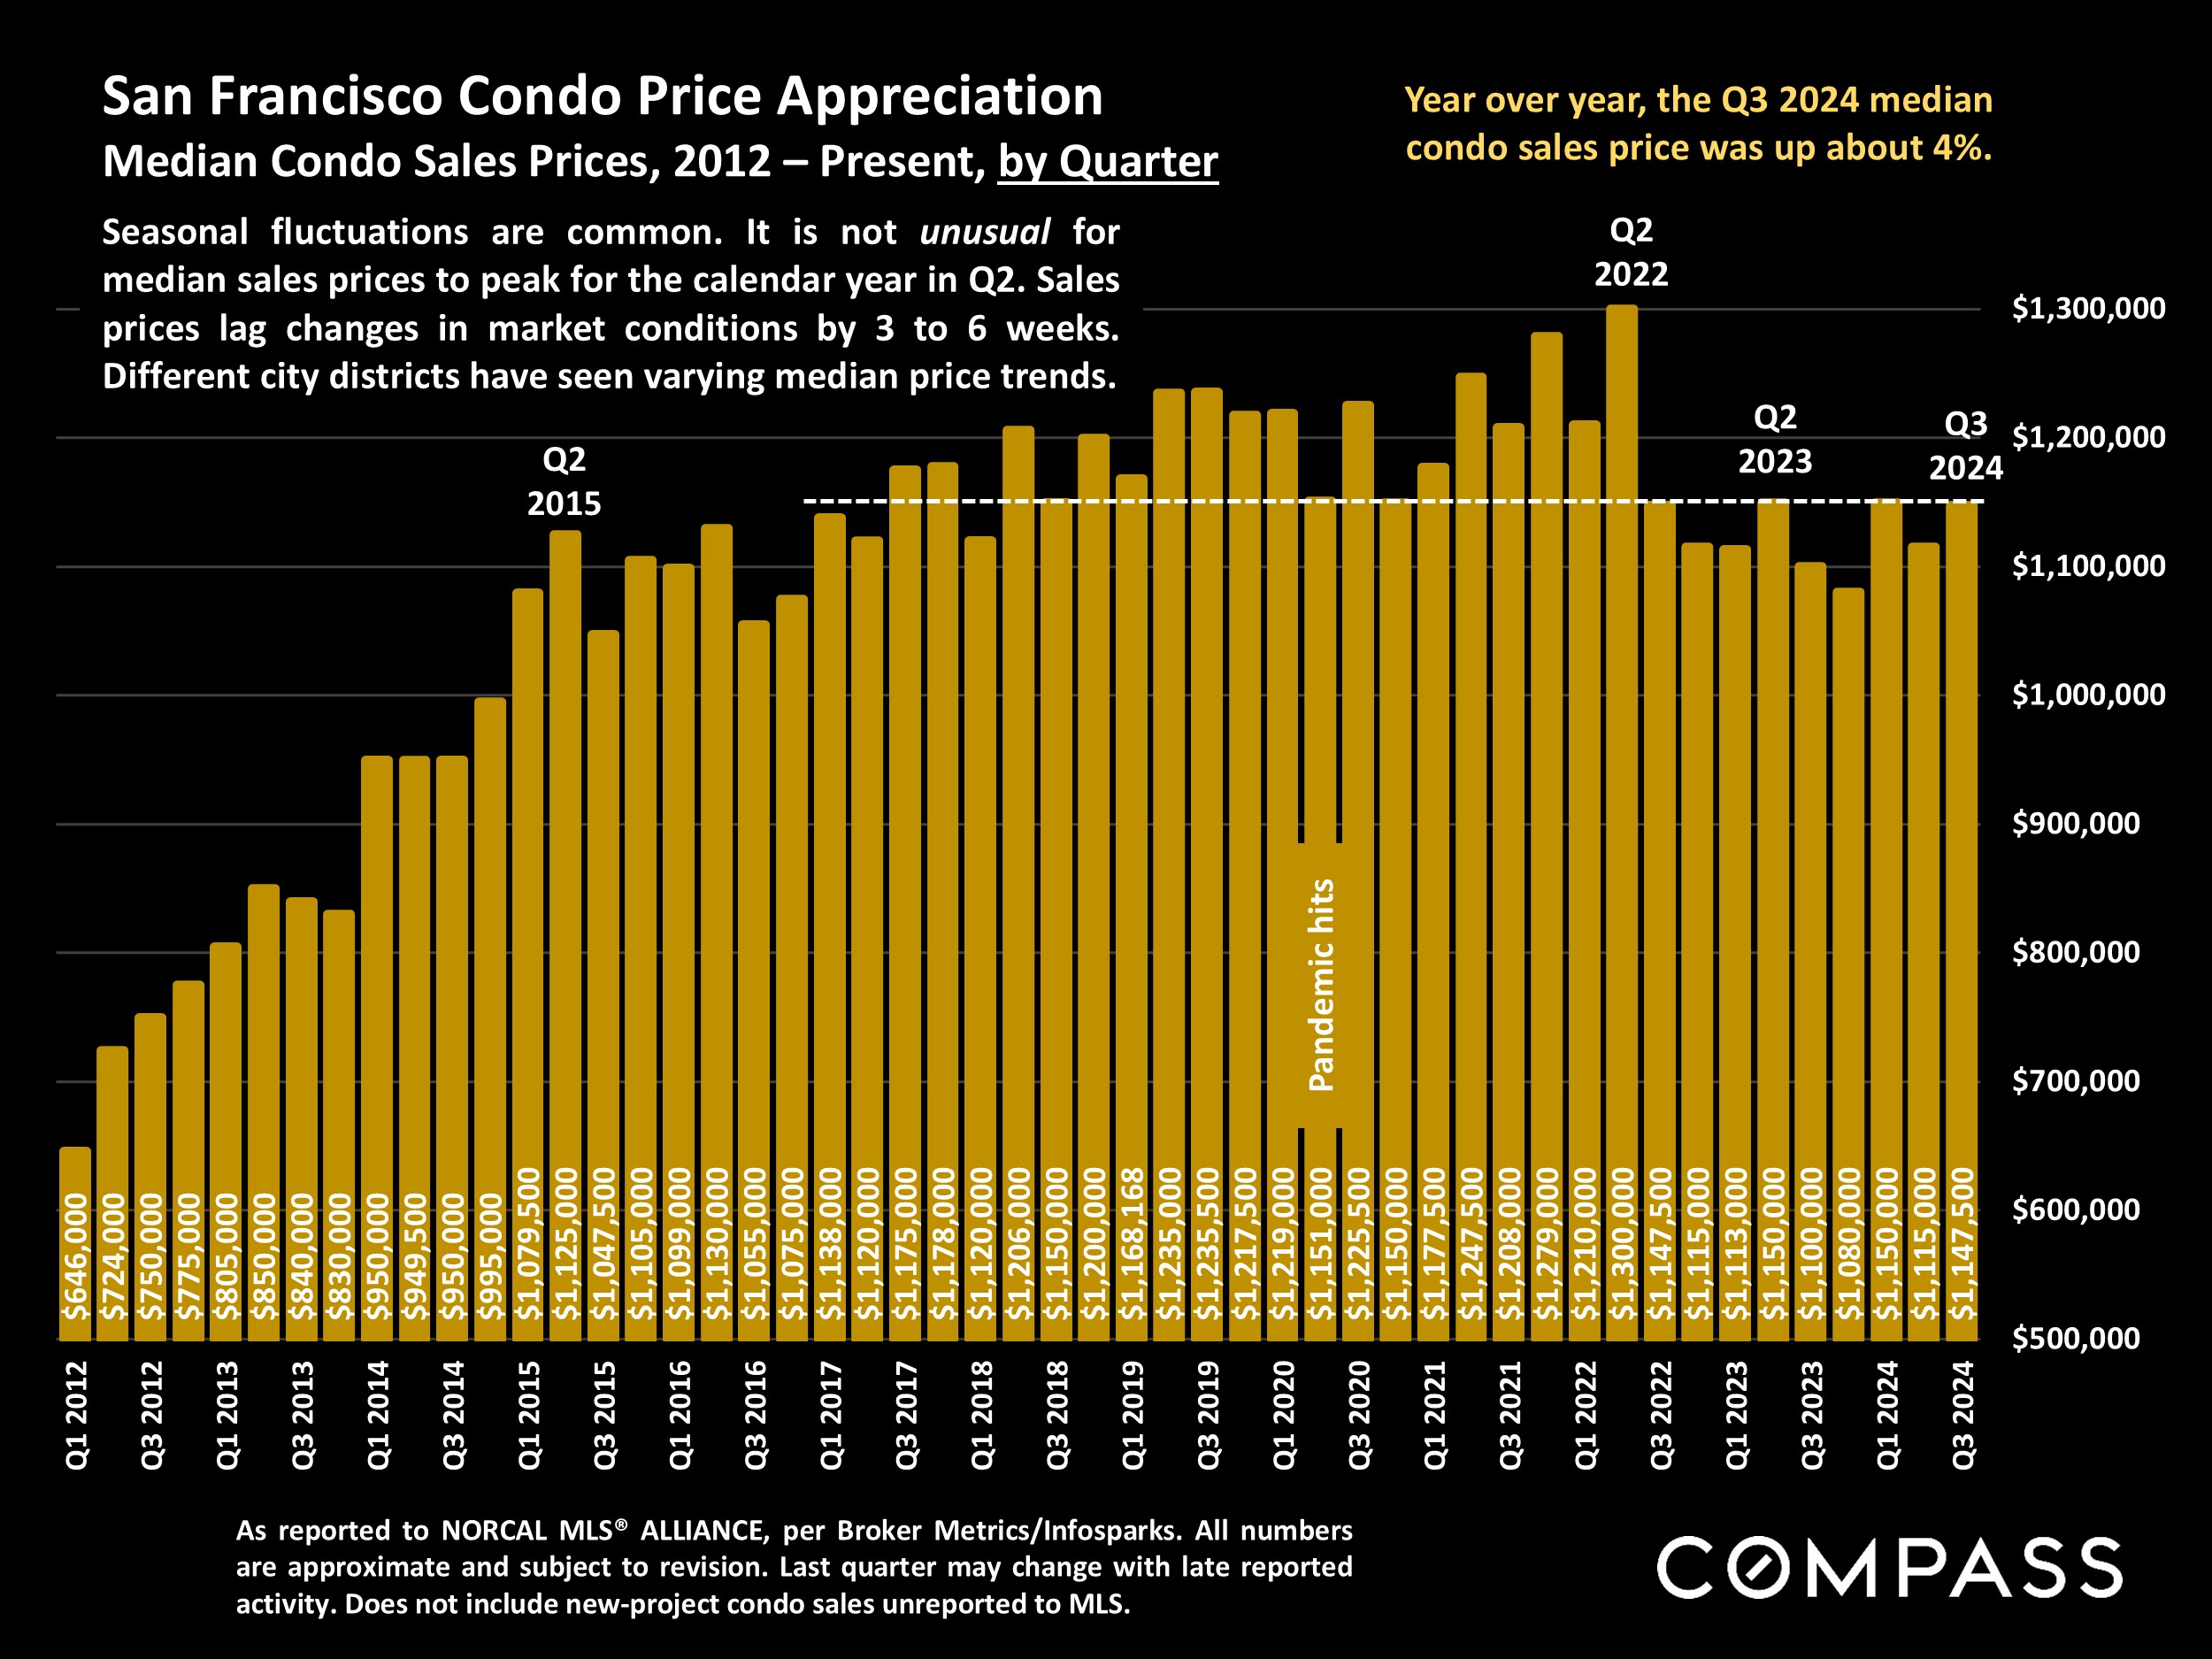
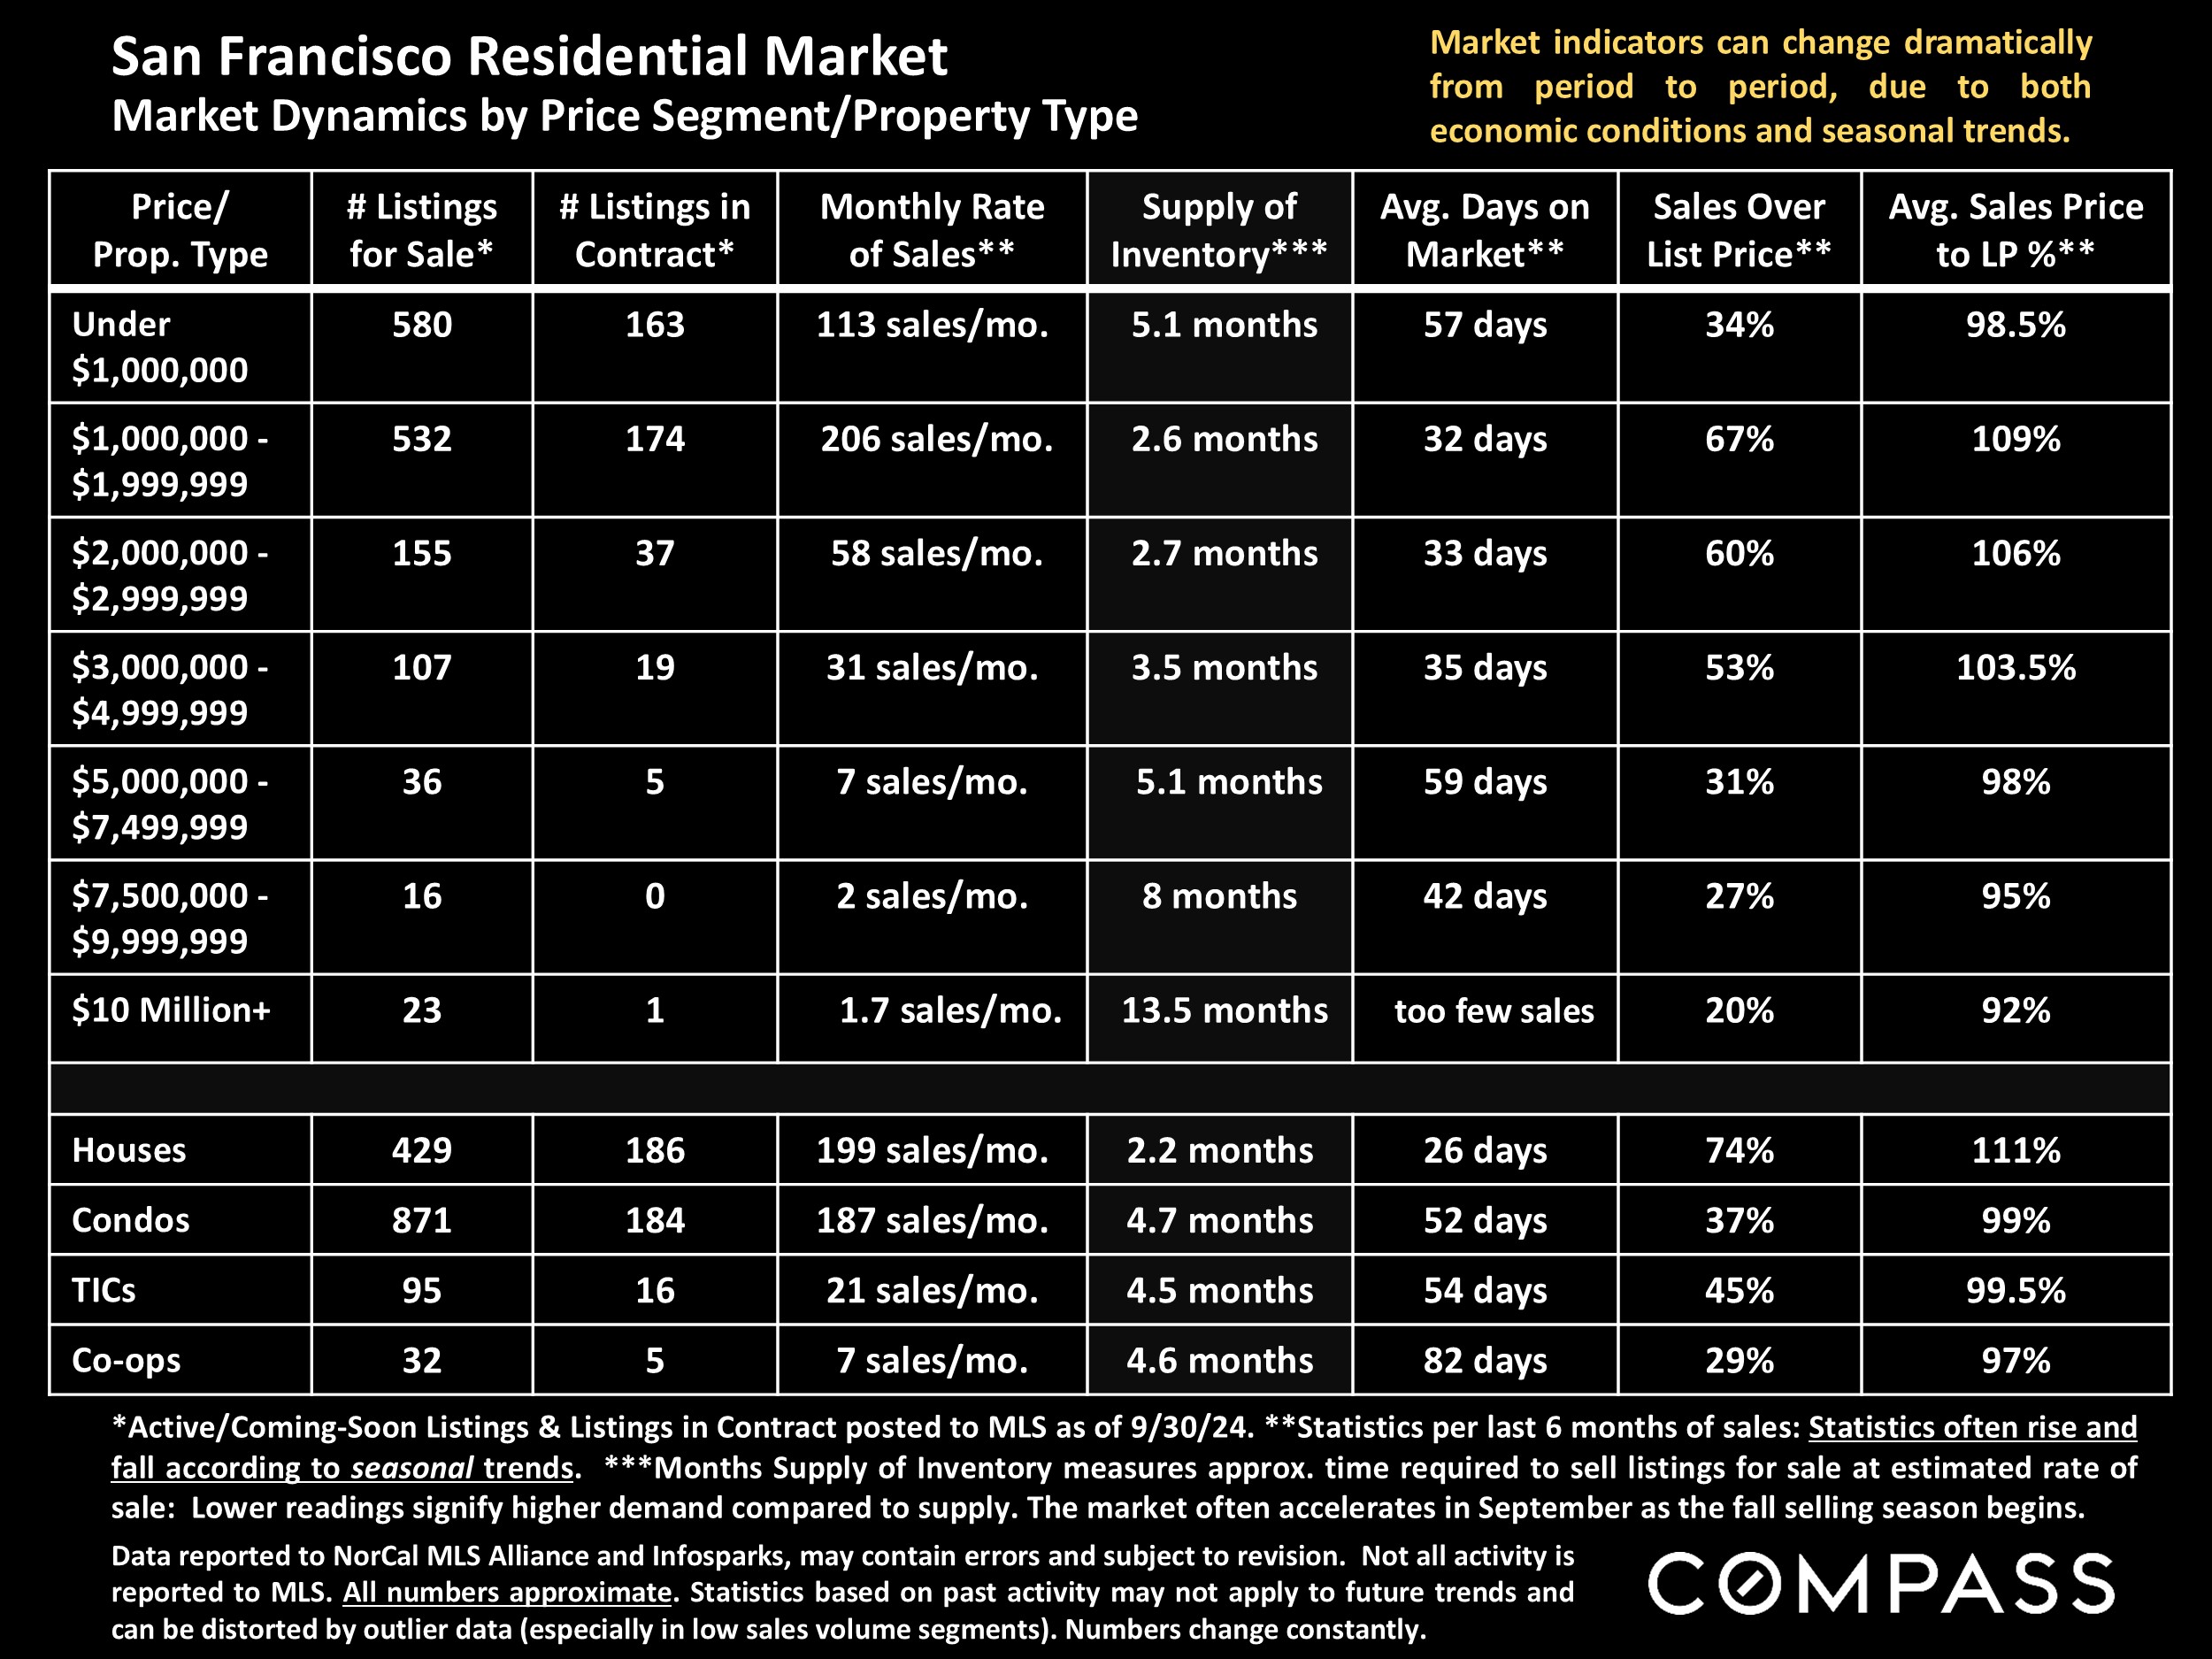
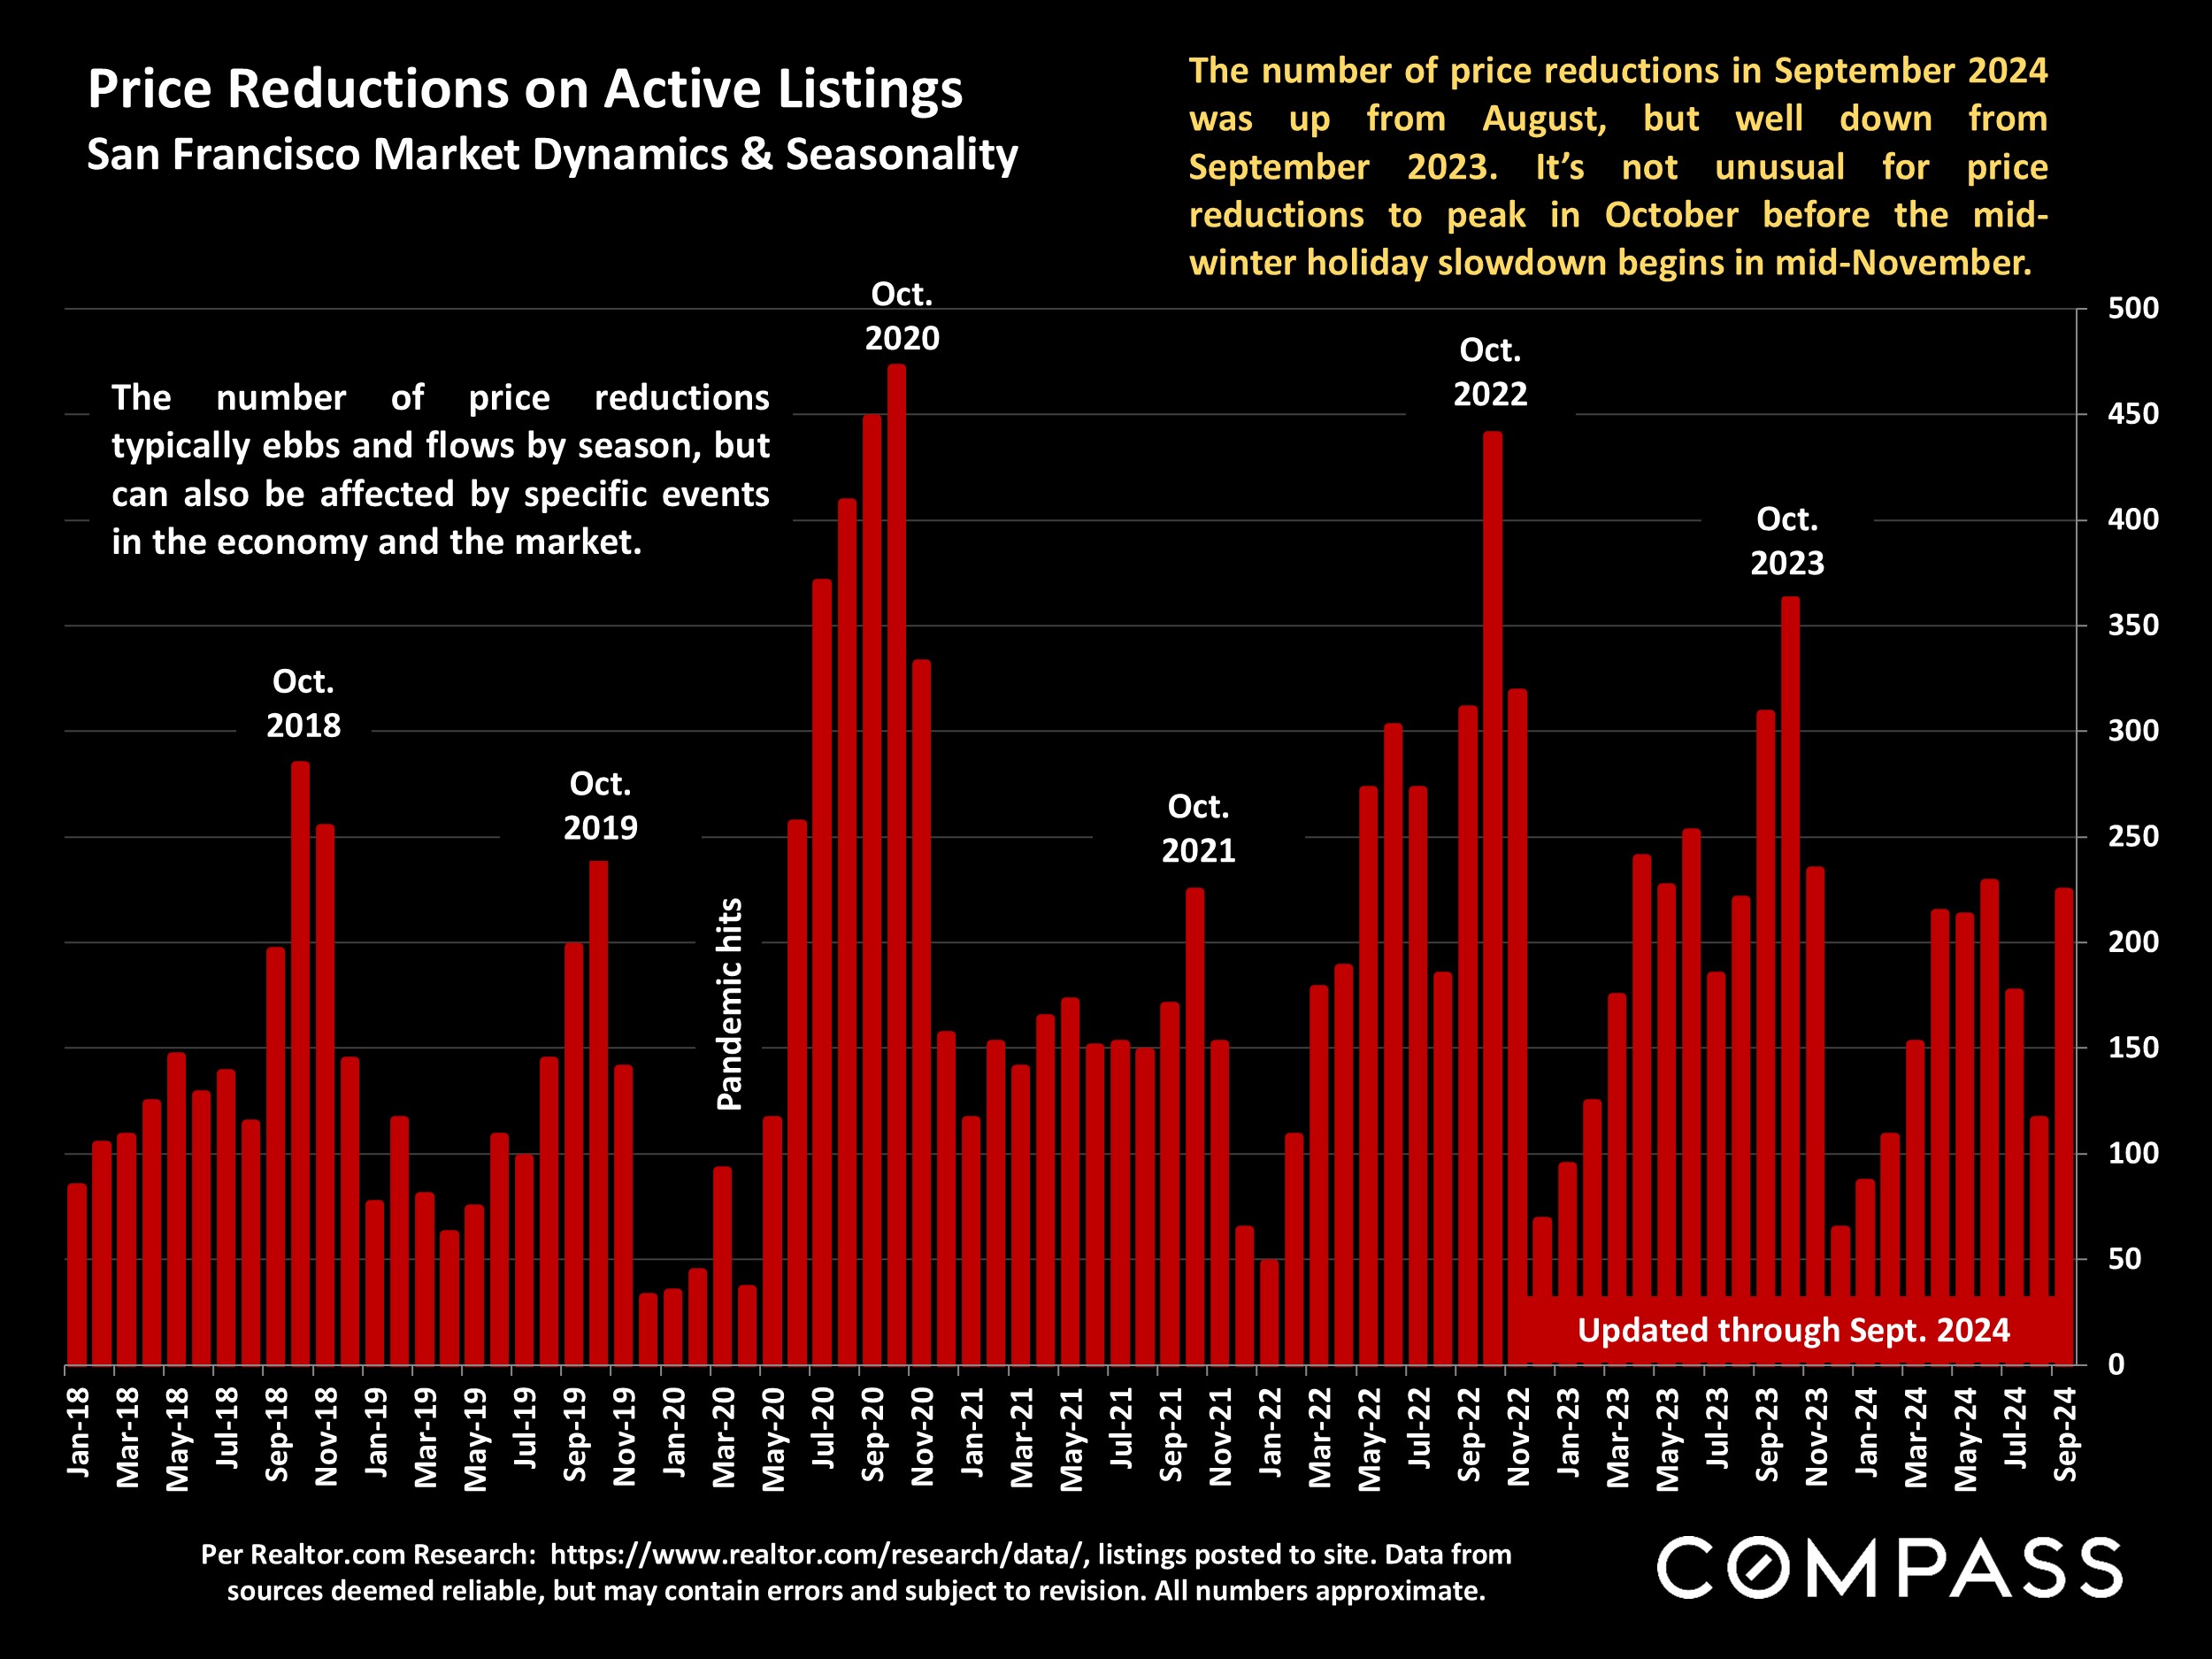
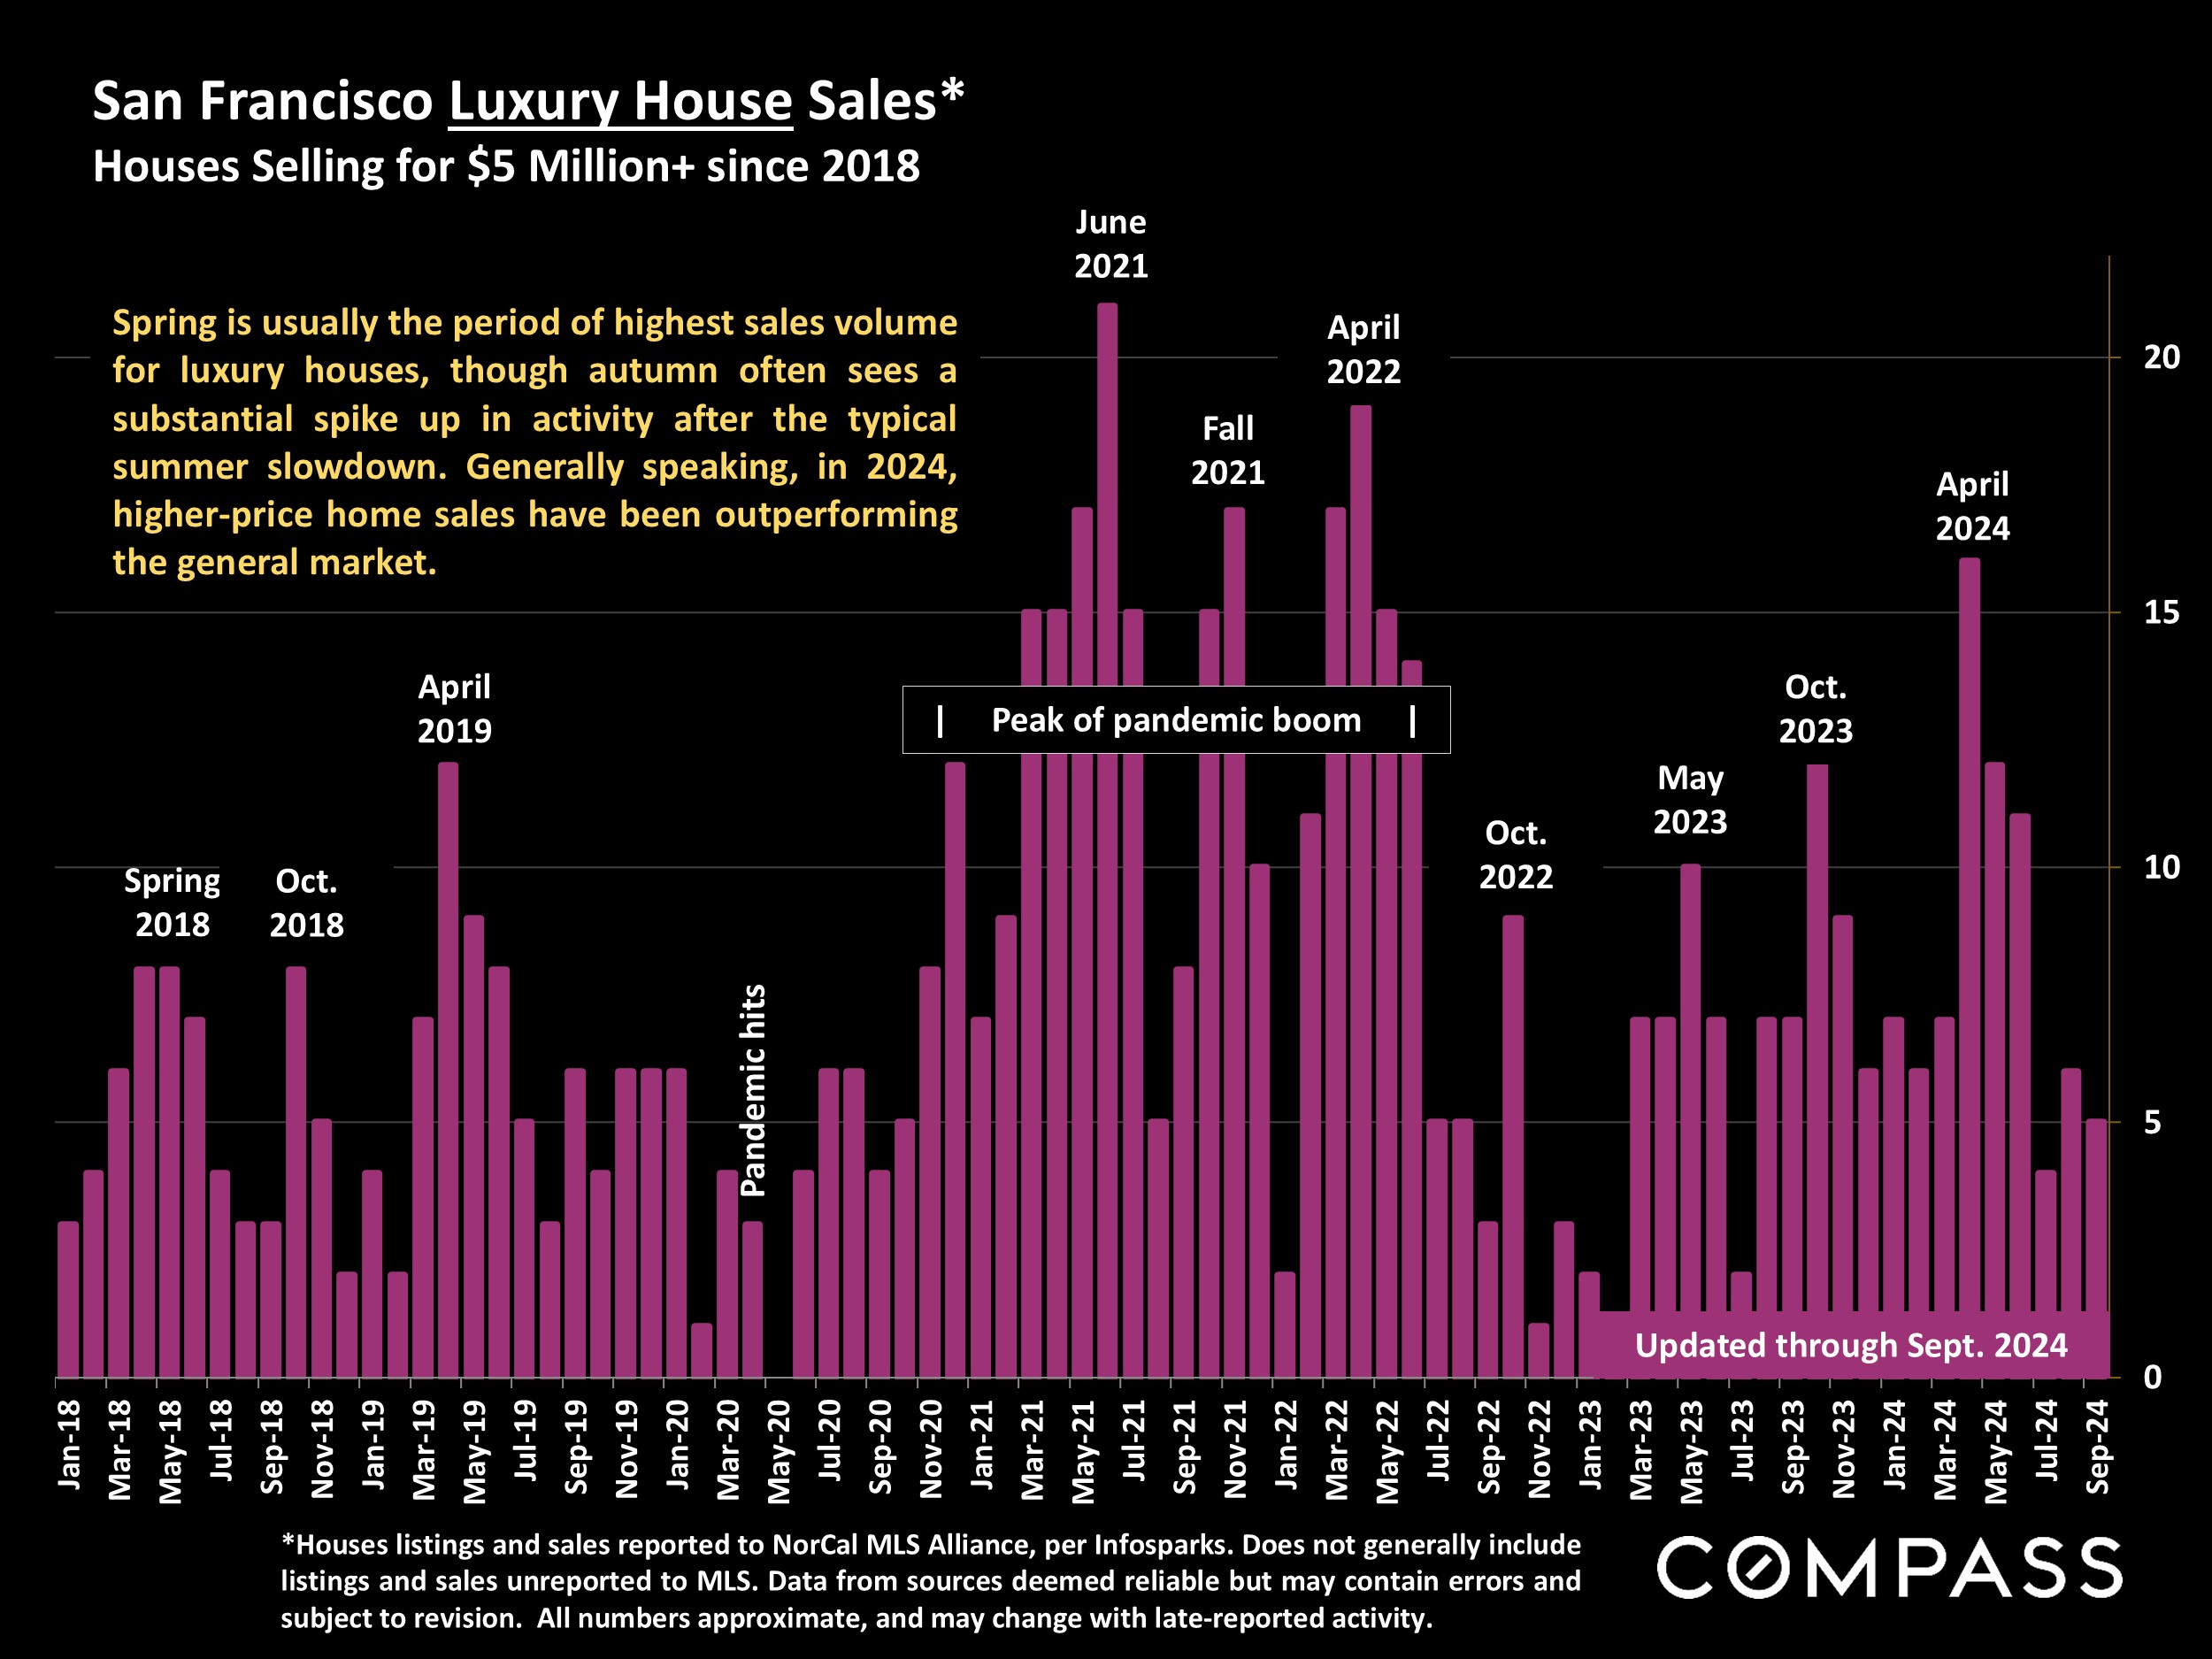
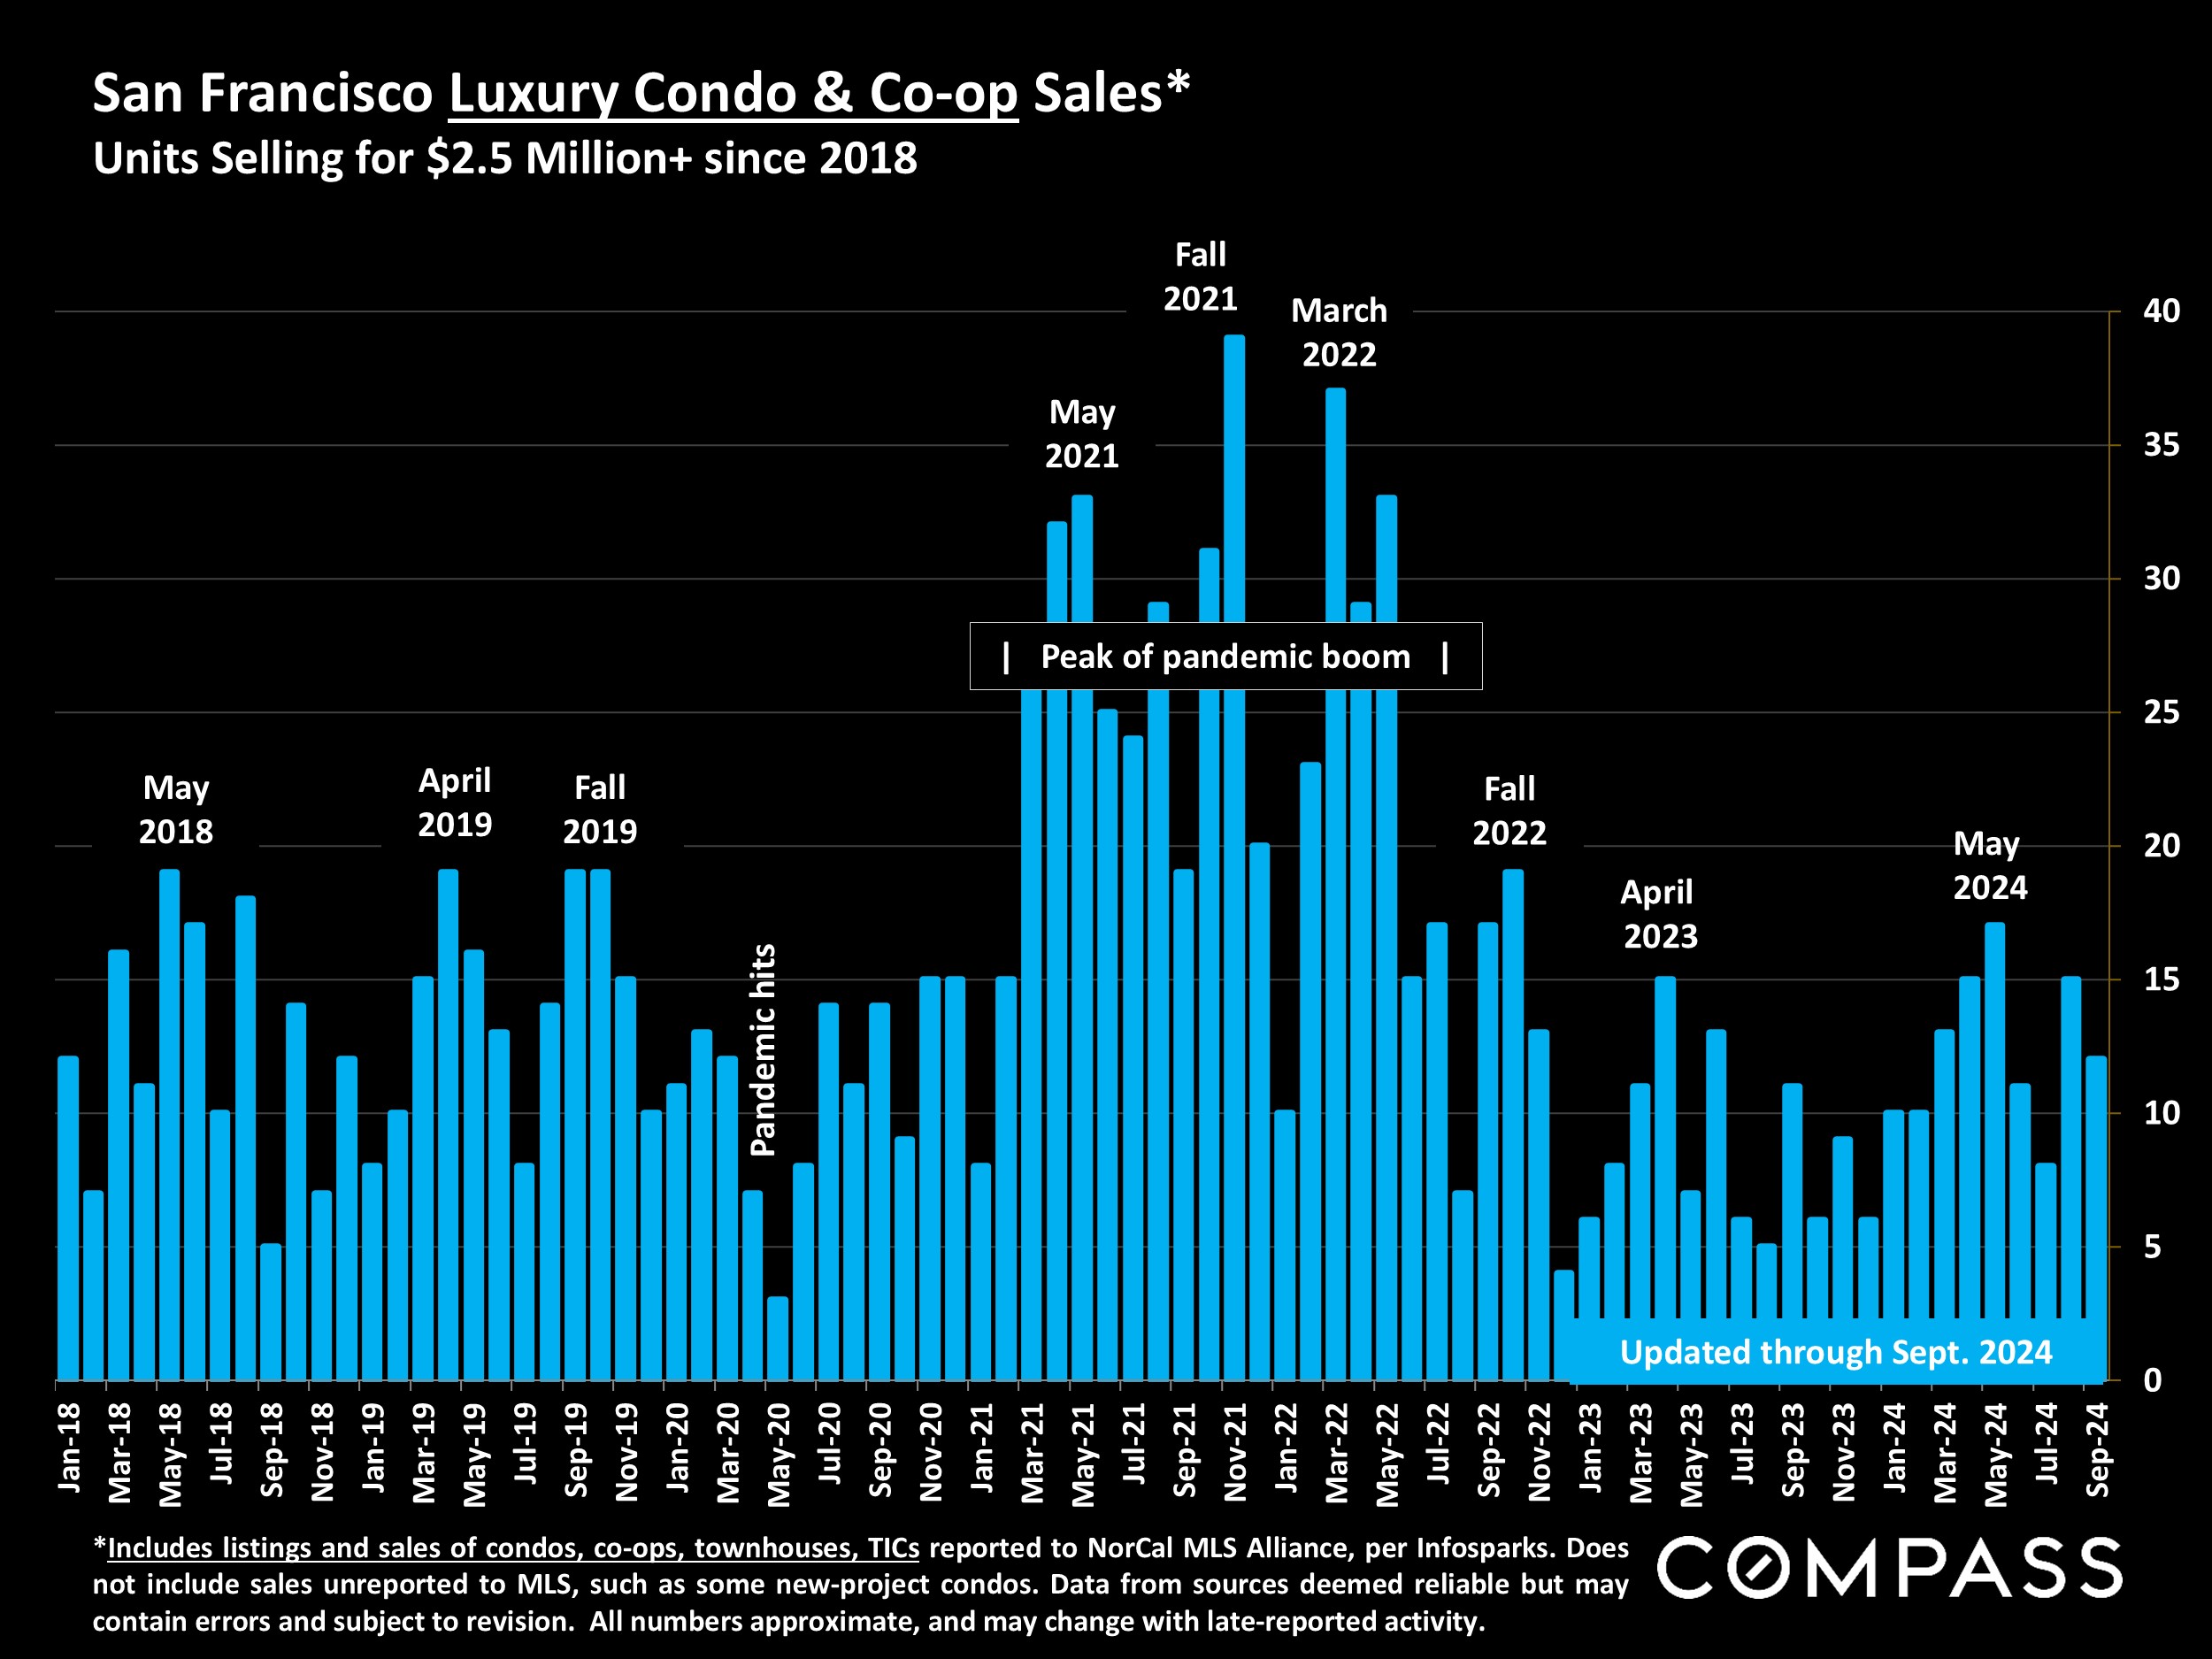
Market-heat indicators (and median sales prices) usually peak in spring (Q2), then cool significantly in Q3 and that was broadly the case this year. October is the heart of the autumn selling season before activity typically begins to plunge heading into the mid-winter holidays. It is also a period that often sees a high number of price reductions as sellers attempt to get unsold homes into escrow before that big slowdown occurs.
Want to learn more about Bay Area market trends?
Let’s connect! With relationships and networks across the city, there are a variety of ways I can help you make informed real estate decisions. Call, email, or text – I’m here to help.
Contact
